0189
Dynamic sodium (23Na) MRI for mapping CSF bulk flow in tissue extracellular space for clearance in human brains1Radiology, New York University, New York, NY, United States, 2Neurology, New York University, New York, NY, United States
Synopsis
This study presents preliminary data to demonstrate the potential of dynamic sodium MRI for mapping cerebrospinal fluid (CSF) bulk flow in extracellular space of tissues in whole brain.
INTRODUCTION
Recent studies have shown that disruption of cerebrospinal fluid (CSF) clearance of brain waste may contribute to development of Alzheimer’s disease (AD) which is characterized by excessive toxic deposits in the brain. Studies on mice demonstrated that impairment of CSF clearance led to 70% reduction in amyloid beta (Aβ) clearance1,2 while sleep-induced enhancement of CSF flow increased Aβ clearance by 100% 3. It is unclear whether these impairment and enhancement exist in humans. Technical limitations on noninvasive in vivo approaches hinder adequate study on this important issue. Specifically, phase-contrast (PC) MRI usually measures CSF flow at aqueduct and ventricles, instead of brain tissues 4-7. Contrast-enhanced (CE) MRI (including dynamic CE-MRI) only tracks CSF flow along vasculature8,9. Low-b value diffusion tensor imaging (DTI) assesses local flow of CSF in drainage 10-12. There’s no known proton (1H)-based MRI approaches capable of distinguishing CSF from water in the brain parenchyma when external tracer is not appropriate9,13. Here we leverage the high concentration of sodium in CSF and interstitial fluid in extracellular space against intracellular space in the parenchyma, and show a dynamic sodium (23Na) MRI for mapping CSF bulk flow in tissues in whole brain.METHODS
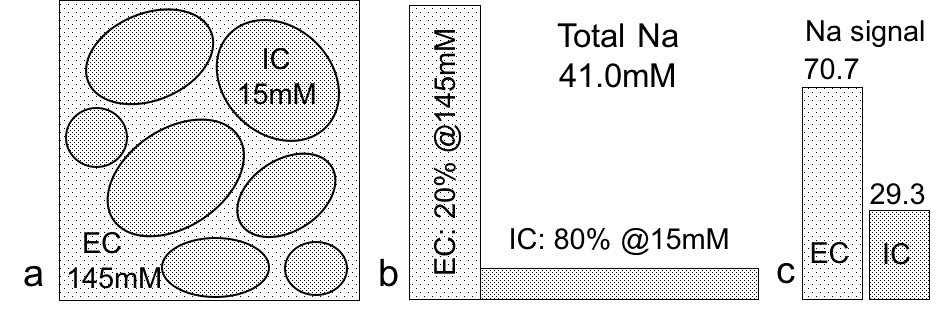
Sodium MR signal is from sodium nuclei (23Na), not protons (1H), in tissues. CSF has a high sodium concentration of 145mM, which is nearly 10 times that in intracellular space (15mM) of human brain14 and can be more reliably measured. CSF exclusively occupies extracellular space in brain parenchyma and self-serves as an endogenous tracer on sodium imaging for bulk flow driven by pulsation. Sodium signal at an imaging voxel is defined (Eq. 1) by the voxel volume ∆V and intra-/extracellular volume fraction a and sodium concentration C. Any change in extracellular space ae is amplified by a factor of 130 (=145-15) and leads to a scaled-up variation in signal (Eq. 2 and Fig. 1).Eq. 1: s = ΔV (aeCe + aiCi) = ΔV (145 ae + 15 ai),
Eq. 2: Δs = ΔV [ Δae (Ce - Ci) + Ci] = ΔV (130 ae + 15).
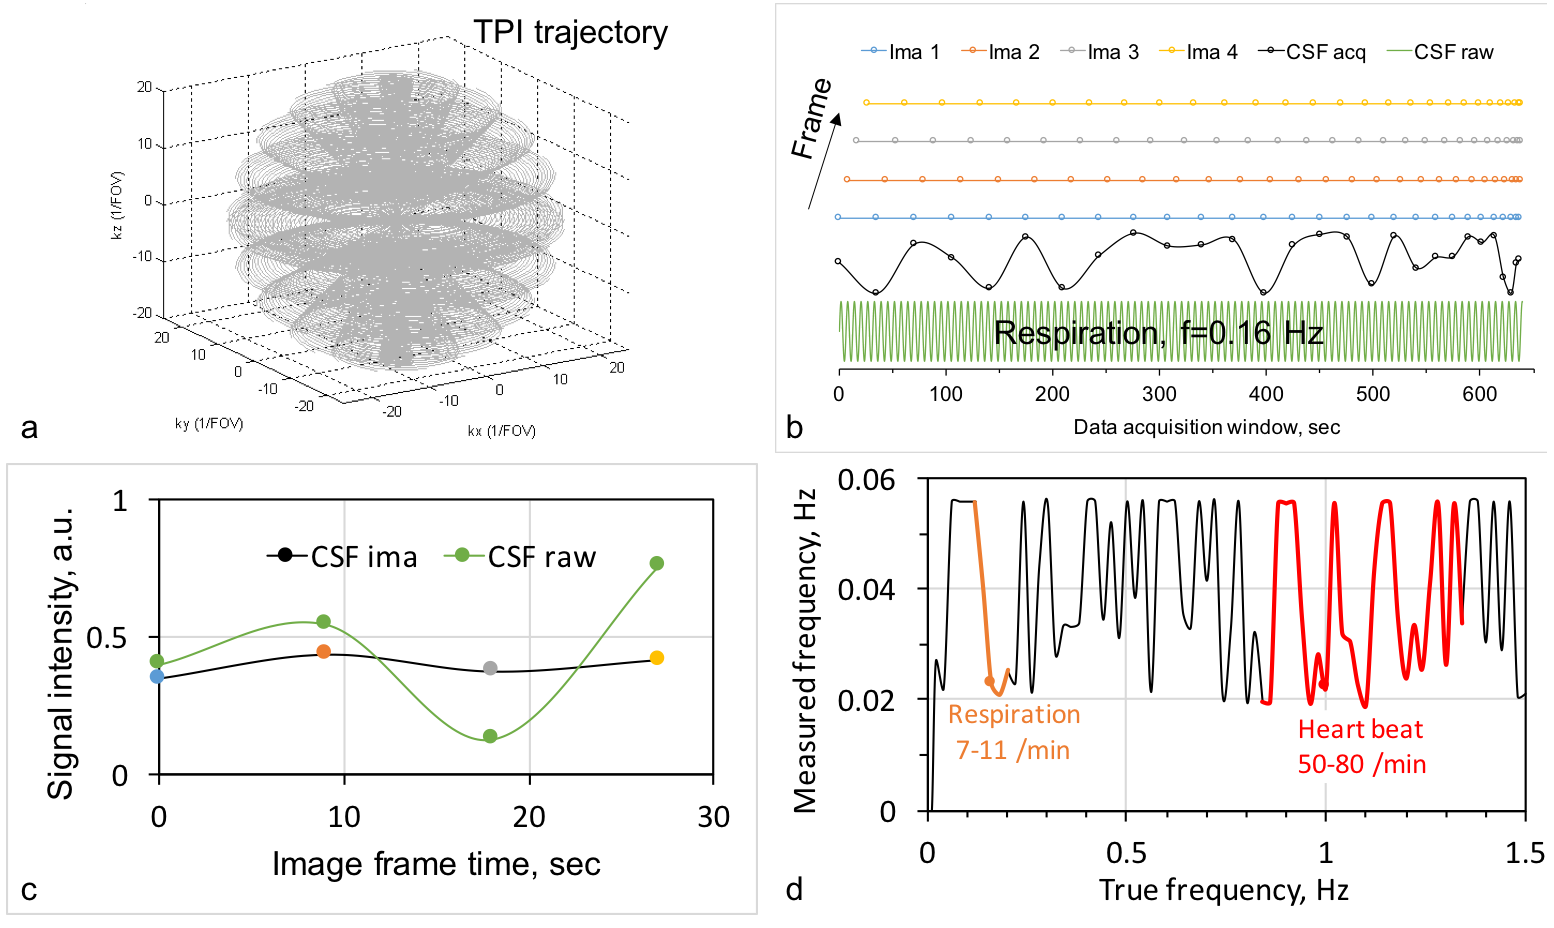
Dynamic sodium MRI employed an interleaved-viewing scheme in data acquisition to achieve a high temporal resolution (9.0 sec). To compensate for its intrinsically low signal-to-noise ratio (SNR), the sodium MRI used an SNR-efficient 3D trajectory, the twisted projection imaging (TPI)15, for data acquisition (Figs. 2a,b). Each frame has an independent full sampling of the k-space.
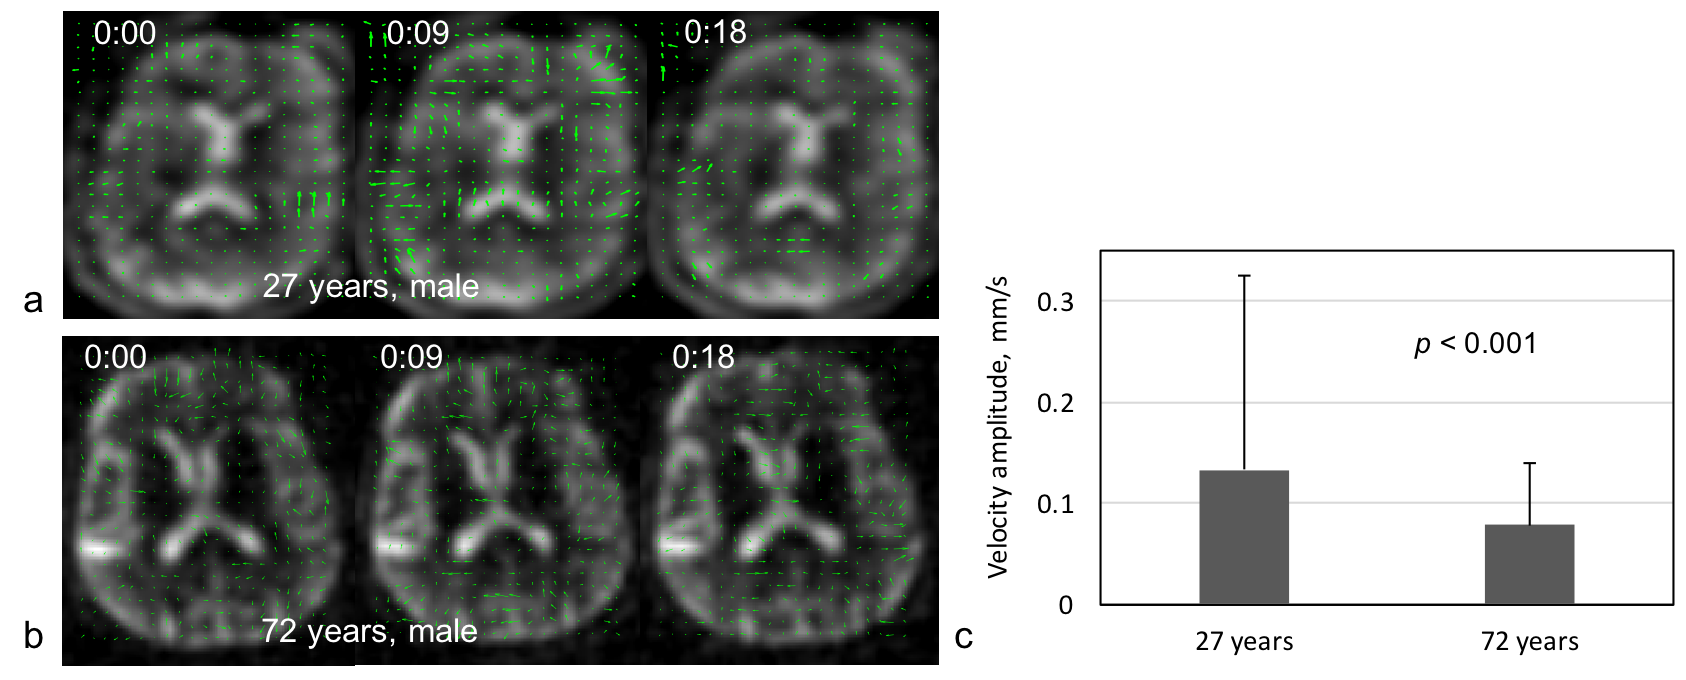
Velocity map (vector field) of CSF bulk flow was created based on the frame images using an open-source software OpenPIV (Particle Image Velocimetry, v2.5)16. It calculates pixel velocity between time frames using a correlation between image patches in an interrogation window centered at the pixel.
Numerical simulations were also performed to calculate sodium MR signal at a pixel with a given intensity varying with time at a range of frequencies of interest.
EXPERIMENTS
Two male subjects of age 27 and 72 years were studied on a 3T MRI scanner (Prisma, Siemens) with a custom-built 8-channel dual-tuned (1H-23Na) head array coil17. Approved IRB and written consent forms were obtained. A custom-developed TPI sequence15 was used with FOV=220mm, matrix size=64, 3D isotropic, TE/TR=5/100ms, flip angle=90°, averages=1, frames=4, p=0.4, and TA=10min28sec. The image reconstruction was implemented offline with custom-developed programs in C++ (MS Visual Studio 2012). A image slice in each subject was selected for OpenPIV to perform with interrogation window 32x32 pixels and spacing step 8x8 pixels for the best output. The velocity map was then displayed in MATLAB (R2018a). Mean and standard deviation (SD) of the velocity magnitude were computed at each frame.RESULTS
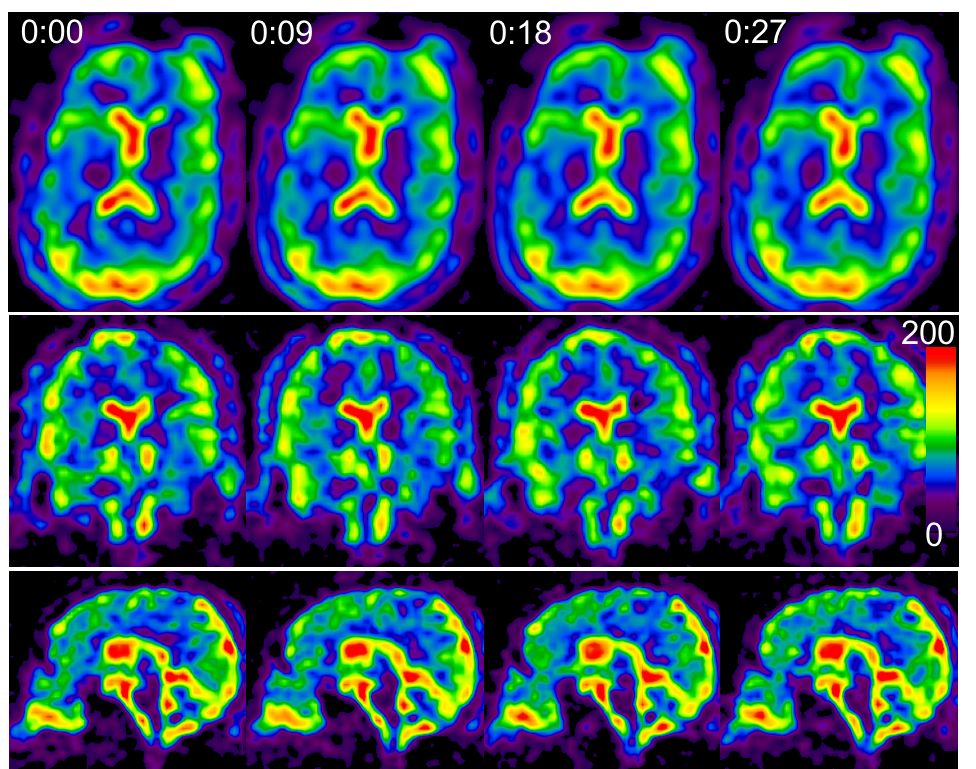
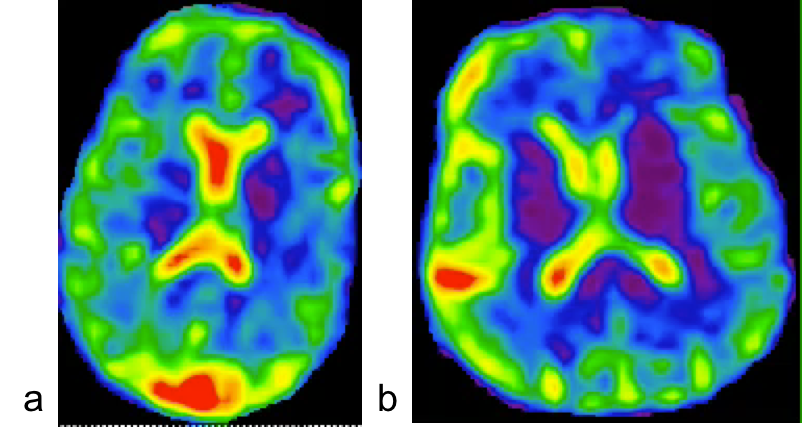
The simulated sodium image intensity in Fig. 2c correlated with the true CSF intensity although the amplitude was not matched well. The frequency of true CSF variation was also captured by the simulated image intensity but with an unmatched value: regular heart beats (50-80/min) and normal respiration (7-11/min)18 were wraparound into 0.02-0.55 Hz (Fig. 2b). Nevertheless, the simulation clearly suggested that the dynamic sodium MRI can detect whether CSF is in motion (0.02-1.5 Hz) or at rest (0.0-0.02 Hz). Fig. 3 shows the 3D frame images of the young subject. CSF bulk flow velocity map at a slice was demonstrated in Fig. 4. For a dynamic display, two video clips for the subjects (Fig. 5) will be demonstrated at on-site presentation. The mean magnitude of CSF velocity was found decreasing by 41.4% (0.1328 vs. 0.0778 mm/s) from the young to older subject.DISCUSSION
The mismatch between simulated and true frequencies of CSF variation in Fig. 2d was due to the relatively low temporal resolution (9 sec), which needs to be improved in the future. The decrease in velocity with aging in Fig. 4c is consistent with expectation. But it needs to be confirmed with more subjects. Sodium MRI however is not distinguishing CSF from blood or interstitial fluid in the parenchyma as they have the same sodium concentration and co-exist in extracellular space19,20.CONCLUSION
Dynamic sodium MRI has been demonstrated for the first time the feasibility to map velocity of CSF bulk flow in tissues in whole brain. This will encourage more efforts to invest in the improvement of temporal resolution and velocity measurement accuracy in the future.Acknowledgements
This work was financially supported in part by NIH grants R56 AG060822, R01 NS113517, and R01 CA111996. This work was also performed under the rubric of the Center for Advanced Imaging Innovation and Research (CAI2R, www.cai2r.net), an NIBIB Biomedical Technology Resource Center (NIH P41 EB017183).References
1. Iliff JJ, Wang M, Liao Y, et al. A paravascular pathway facilitates CSF flow through the brain parenchyma and the clearance of interstitial solutes, including amyloid β. Sci Transl Med. 2012; 4(147):147ra111
2. Nedergaard M. Garbage truck of the brain. Science 2013; 340:1529-1530. https://doi.org/10.1126/science 12405 14.
3. Xie L, Kang H, Xu Q, Chen MJ, Liao Y, Thiyagarajan M, O'Donnell J, Christensen DJ, Nicholson C, Iliff JJ, Takano T, Deane R, Nedergaard M. Sleep drives metabolite clearance from the adult brain. Science. 342 (6156): 373-377. doi:10.1126/science.1241224. PMC 3880190. PMID 24136970.
4. Venkataraman A, Deane R, Zhong J. CSF Flow and Aging: An Early Marker of Pathology? In: Proceedings of the 27th ISMRM Annual Meeting, Montreal, Canada. May 11-16, 2019. p.2549.
5. Horie T, Kajihara N, Saito H, Shibukawa S, Takano S, Konta N, Obara M, Ogino T, Niwa T, Kuroda K, Matsumae M. Visualization of irregular CSF flow by dynamic iMSDE SSFP using acceleration-selective motion - sensitized gradient (AS-MSG). In: Proceedings of the 27th ISMRM Annual Meeting, Montreal, Canada. May 11-16, 2019. p.2550.
6. Haughton V, Mardal KA. Spinal fluid biomechanics and imaging: An update for neuroradiology. AJNR Am J Neuroradiol 2014; 35(10):1864-9. doi: 10.3174/ajnr. A4023.
7. Bateman GA, Brown KM. The measurement of CSF flow through the aqueduct in normal and hydrocephalic children: from where does it come, to where does it go? Childs Nerv. Syst 2012; 28:55-63.
8. Naganawa S, Nakane T, Kawai H, Taoka T. Gd-based contrast enhancement of the perivascular spaces in the basal ganglia. Magn Reson Med Sci 2017. 16(1):61-65.
9. Jiang Q, Zhang L, Ding G, Davoodi-Bojd E, Li Q, Li L, Sadry N, Nedergaard M, Chopp M, Zhang Z. Impairment of the glymphatic system after diabetes. J Cereb Blood Flow Metab. 2017; 37(4):1326-1337. doi: 10.1177/0271678X16654702.
10. Tuura RO, Volk C, Jaramilo V, Huber R. Sleep-related changes in diffusivity overnight: a window into glymphatic activity in humans. In: Proceedings of the 27th ISMRM Annual Meeting, Montreal, Canada. May 11-16, 2019. p.752.
11. Bito Y, Harada K, Ochi H, Kohsuke Kudo K. Stirred CSF Measured by Low b-value DTI. In: Proceedings of the 27th ISMRM Annual Meeting, Montreal, Canada. May 11-16, 2019. p.1045.
12. E Komlosh M, Benjamini D, Williamson NH, Horkay F, Hutchinson EB, Basser PJ. A Novel MRI Phantom to Study Interstitial Fluid Transport in the Glymphatic System. In: Proceedings of the 27th ISMRM Annual Meeting, Montreal, Canada. May 11-16, 2019. p.747.
13. Iliff JJ, Lee H, Yu M, et al. Brain-wide pathway for waste clearance captured by contrast-enhanced MRI. J Clin Invest. 2013; 123(3):1299-309.
14. Thulborn KR. Quantitative sodium MR imaging: A review of its evolving role in medicine. NeuroImage 2018; 168:250-268.
15. Boada FE, Gillen JS, Shen GX, Chang SY, Thulborn KR. Fast three dimensional sodium imaging. Magn Reson Med 1997; 37:706-715.
16. Taylor ZJ, Gurka R, Kopp GA, Liberzon A. Long-Duration Time-Resolved PIV to Study Unsteady Aerodynamics, Instrumentation and Measurement, IEEE Transactions on, 2010; 59 (12): 3262-3269. doi: 10.1109/TIM.2010.2047149.
17. Lakshmanan K, Brown R, Madelin G, Qian Y, Boada F, Wiggins GC. An eight-channel sodium/proton coil for brain MRI at 3 T. NMR Biomed. 2018; 31(2). doi: 10.1002/nbm.3867.
18. Yamada S, Miyazaki M, Yamashita Y, Ouyang C, Yui M, Nakahashi M, Shimizu S, Aoki I, Morohoshi Y, McComb JG. Influence of respiration on cerebrospinal fluid movement using magnetic resonance spin labeling. Fluids and barriers of the CNS 2013;10(1):36.
19. Thal DR, Grinberg LT, Attems J. Vascular dementia: different forms of vessel disorders contribute to the development of dementia in the elderly brain. Exp Gerontol 2012; 47:816-824. doi.org/10.1016/j.exger.2012.05.023.
20. Matsumae M, Sato O, Hirayama A, Hayashi N, Takizawa K, Atsumi H, Sorimachi T. Research into the Physiology of Cerebrospinal Fluid Reaches a New Horizon: Intimate Exchange between Cerebrospinal Fluid and Interstitial Fluid May Contribute to Maintenance of Homeostasis in the Central Nervous System. Neurol Med Chir (Tokyo) 2016; 56(7):416-41.
Figures