0184
Microscopic multifrequency MR elastography with 40 micrometer spatial resolution: Application to murine neural tissue specimens1Department of Radiology, Charite Universitätsmedizin Berlin, Berlin, Germany, 2Tierhaltung CCM, Charite Universitätsmedizin Berlin, Berlin, Germany, 3Molecular Imaging, Leibniz Forschungsinstitut für Molekulare Pharmakologie, Berlin, Germany, 4Department of medical Informatics, Charite Universitätsmedizin Berlin, Berlin, Germany
Synopsis
The purpose of this study was the development of multifrequency MR elastography (MRE) of tissue samples with 40 micrometer pixel edge size for analyzing the mechanical properties of murine neural tissue. The new technique revealed in specimens of cerebellum and cortical brain areas that white matter is significantly stiffer than gray matter. Microscopic multifrequency MRE provides insight into micro mechanical structures of ex-vivo soft tissues and might be used in the future to investigate fresh biopsy samples.
Introduction
Viscoelastic constants measured at different length scales provide insight into the biophysical properties of soft tissues [1]. State-of-the-art measurement methods for biomechanical parameter quantification in tissue specimens can be based on scanning force microscopy, tensile tests, shear rheometry or indentation techniques. Some of these methods can be applied to very small tissue samples and can resolve parameters in the micrometer range. However, all these methods are surface based and cannot directly be compared with in-vivo measurement methods such as MR elastography (MRE). MRE can quantify mechanical properties in bulky samples of biological soft matter at different mechanical excitation frequencies and can be applied to in-vivo tissues non-invasively [2]. Preclinical MRE in small animals can measure mechanical properties on the millimeter or sub-millimeter scale [3]. Recently, high resolution multifrequency MRE with tomoelastography post-processing was introduced for studies of tissue mechanical parameters of the mouse brain [4]. We here present tomoelastography of neural tissue specimens in the range of tens of micrometer resolution (μ-tomoelastography). The technique provides unprecedented spatial resolution in MRE of small tissue samples and might thus bridge the gap between macroscopic MRE measurements and micromechanical test methods.Methods
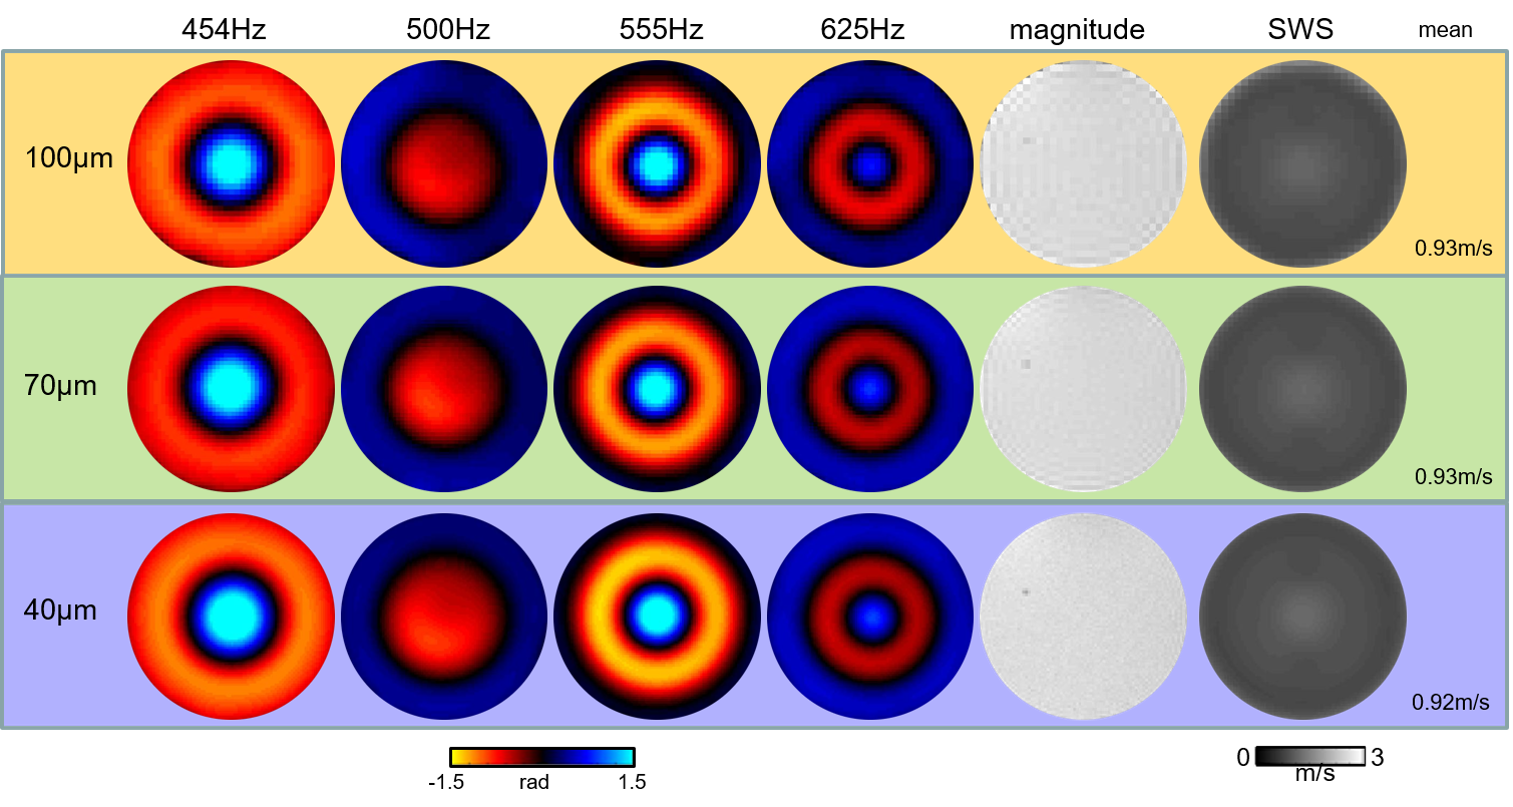
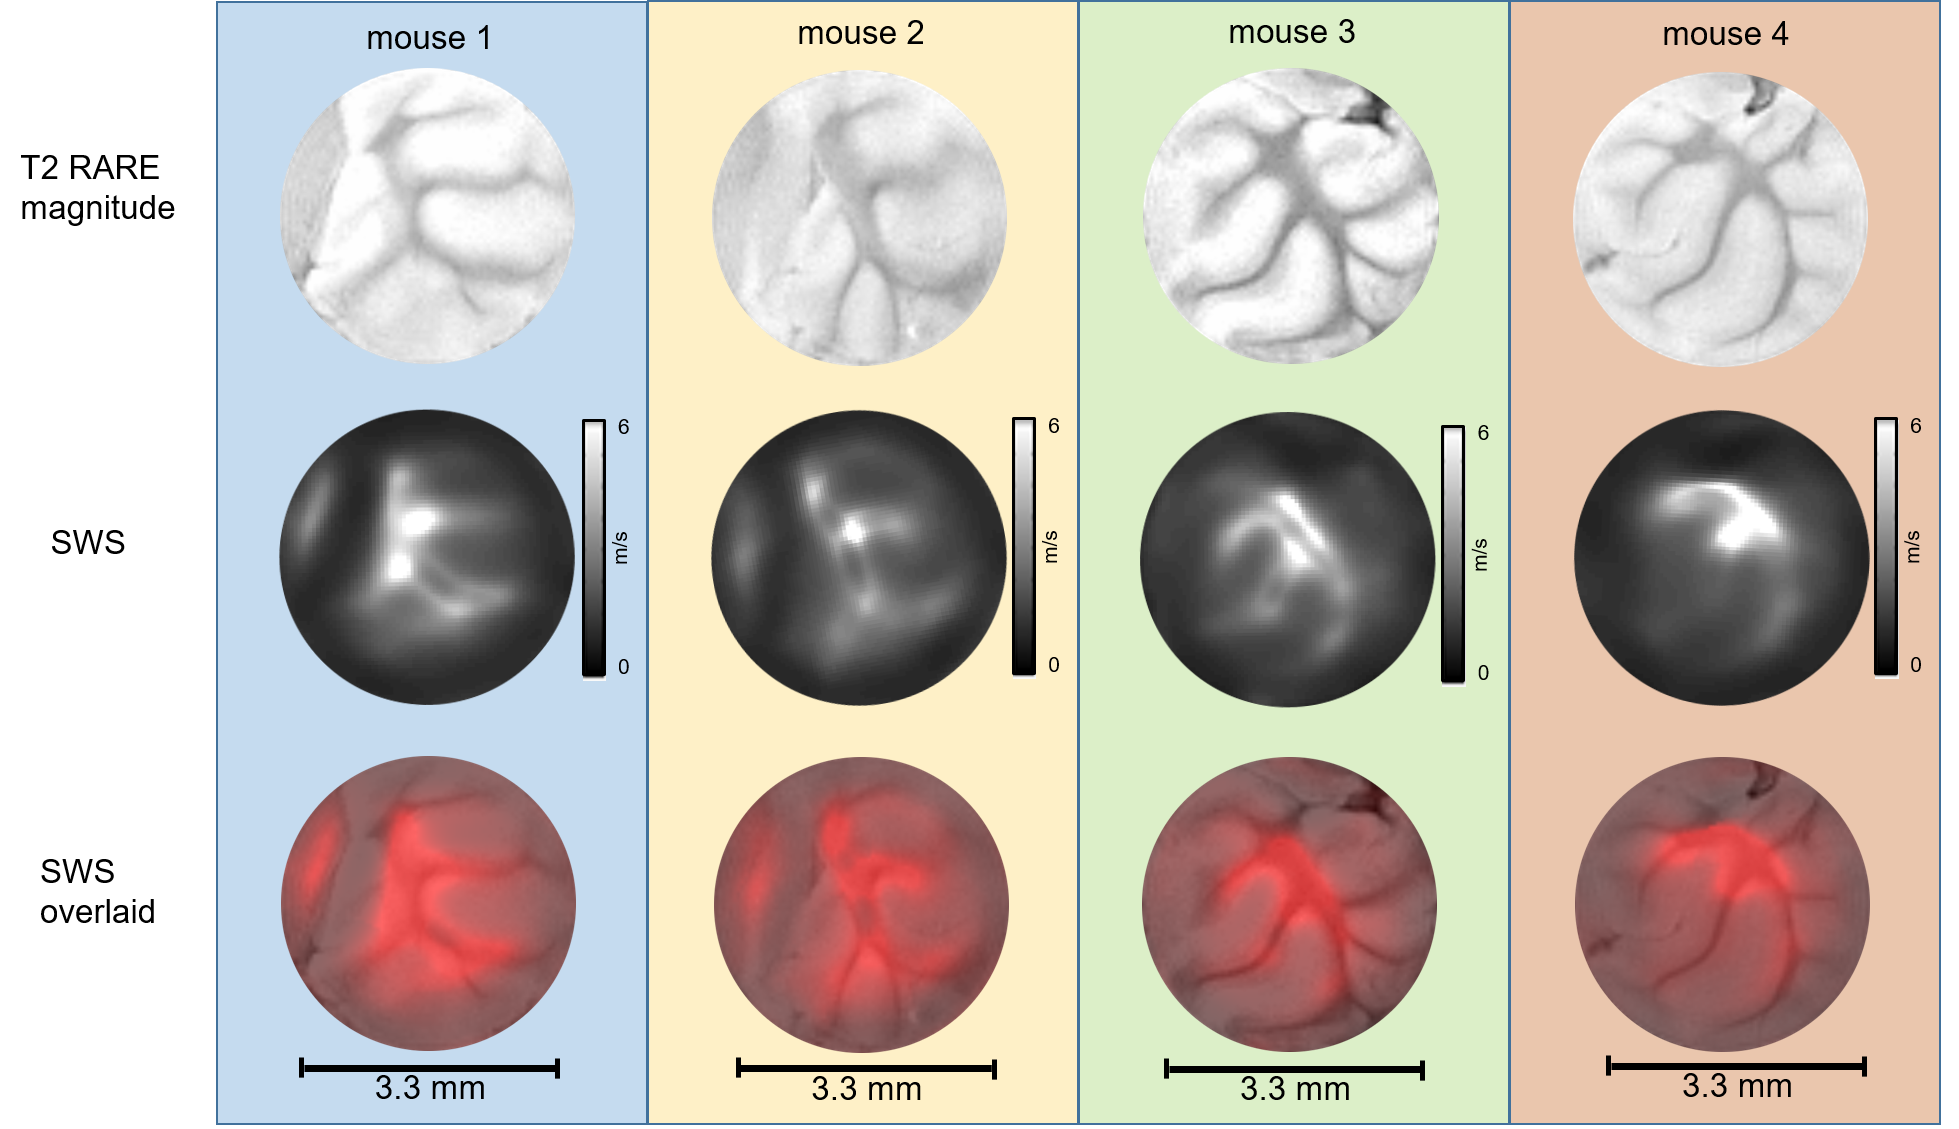
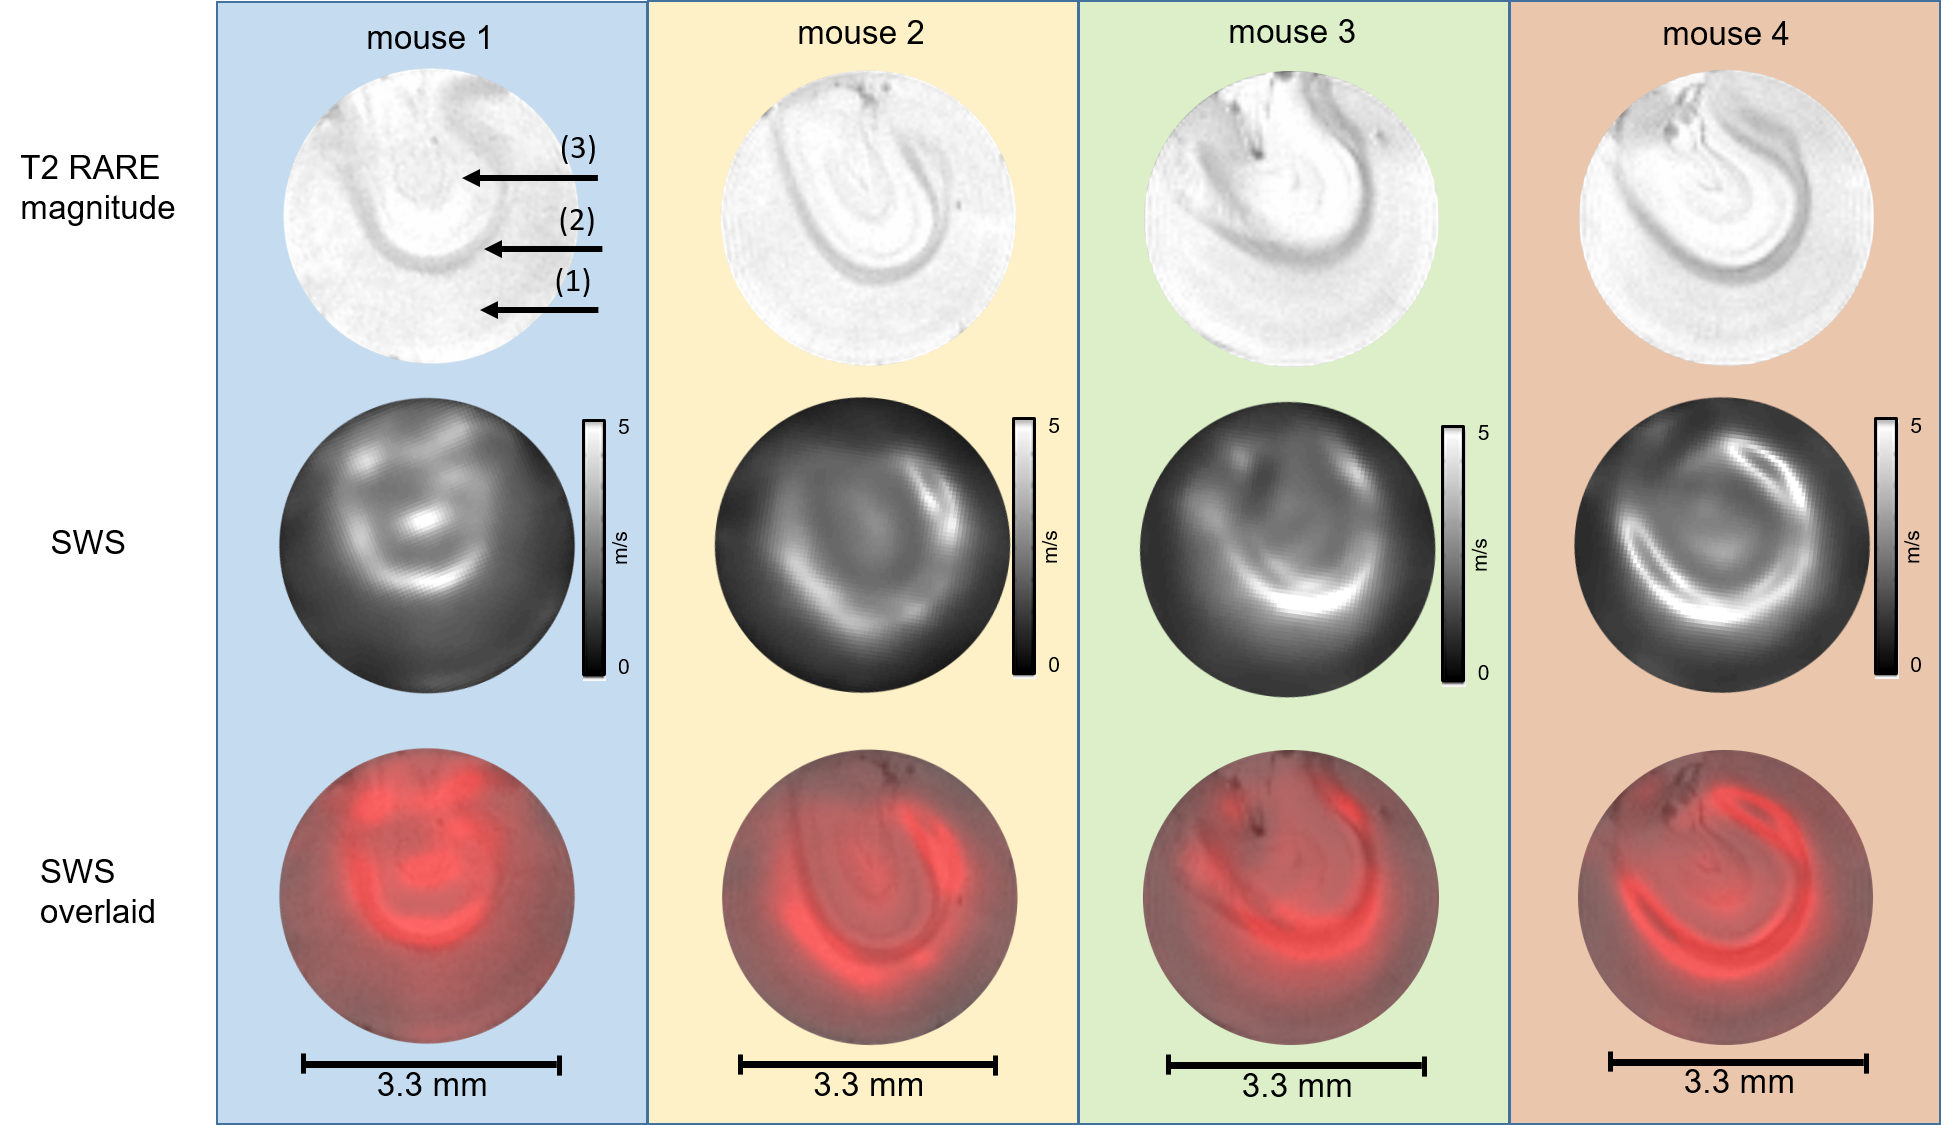
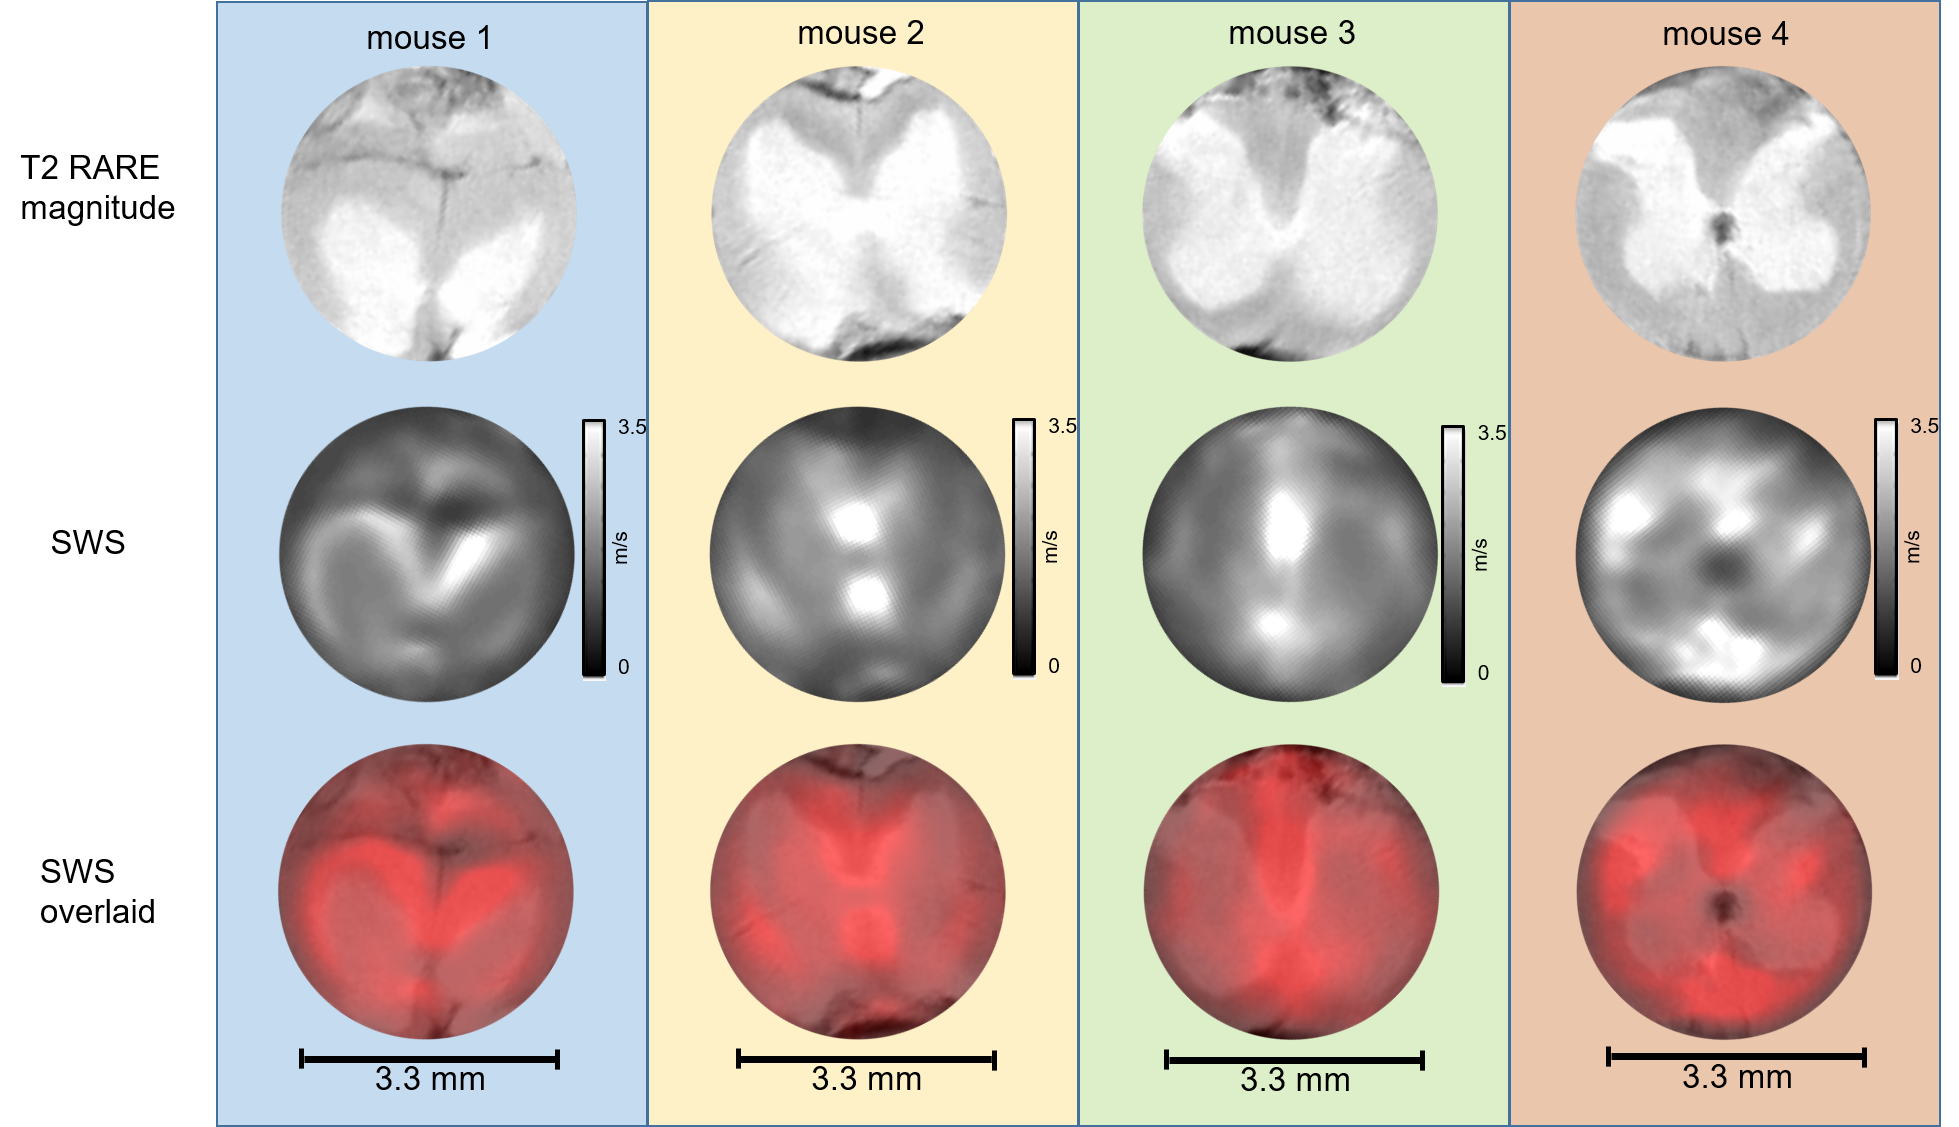
Unprocessed neuronal tissues from four C57BL-6 mice were investigated in a 9.5T horizontal bore NMR spectrometer (Bruker, Avance III Ultrashield 400 plus, Ettlingen, Germany) equipped with imaging gradient insert, 5mm diameter quadrature volume coil. Tissue samples were placed in a glass tube with 3.3mm inner diameter (Wilmad NMR tube, St. Louis, MO).Tissue samples of cerebellum (CB), spinal cord (SC) and cerebral cortex (CO) with corpus callosum (CC) were investigated by multifrequency MRE 24 h post mortem. Cylindrical waves of 454, 500, 555, 625Hz were induced by a piezo based driver similar to the one used for tabletop MRE [3]. Wave images polarized along the main cylinder axis were acquired in a transversal view using a multi-shot spin-echo MRE sequence [4]. The frequency of the sinusoidal motion encoding gradients (MEG) was identical to the vibration frequency. Number of MEG cycles were 8, 8, 10 and 12 for 454, 500, 555 and 625Hz, respectively. Further acquisition parameters were: 1400ms repetition time (TR), 30ms echo time (TE), 110*110 matrix size, 4.4*4.4mm2 field of view (FoV), 40*40µm² in-plane resolution and 0.6mm slice thickness. Total acquisition time for 4 frequencies each sampled with 6 wave dynamics was ca. 1h. Shear wave speed (SWS) maps as a surrogate of stiffness were generated from the complex valued wave images using multifrequency wave-number inversion (k-MDEV) [5]. Reference T2 RARE images were acquired with the same resolution but with longer TR in order to increase image quality (TR=3s, TE=10ms, rare factor of 6). SWS maps were overlaid on corresponding T2 RARE images using Elastix [6]. The method was validated in cylindrical phantoms made of ultrasound gel (Sonogel, Germany) at three different resolutions (100, 70 and 40µm) using identical parameters as for ex vivo measurements.Results
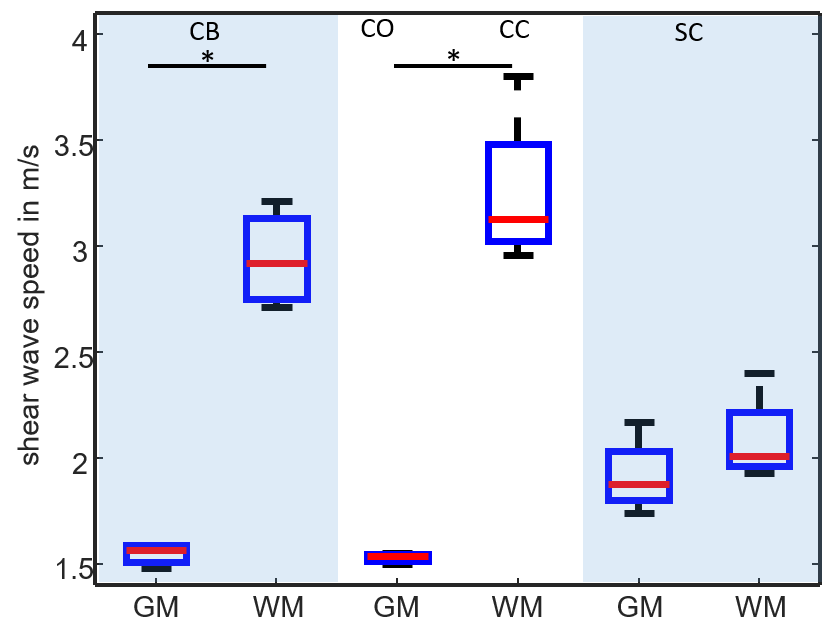
Figure 1 shows shear wave images and parameter maps acquired in phantoms at three different resolutions. Mean SWS was 0.93±0.05m/s with 100µm and 70µm and 0.92±0.06m/s with 40µm pixel edge sizes. Figures 2, 3 and 4 show SWS maps for CB, CO+CC and SC for all animals. Figure 5 shows group mean SWS values in different areas of the brain and the spinal cord. Cerebellum and cortical brain tissue are characterized by abundant white matter which was significantly stiffer than surrounding tissue containing mainly gray matter. No significant difference was found between gray and white matter in spinal cord tissue, which is probably an effect of the small group size.Discussion & conclusion
Our study presents first MRE-measured stiffness maps of murine neuronal tissues with an in-plane resolution of 40*40µm2. In phantom experiments, increasing the resolution from 100 to 40µm did not influence SWS values demonstrating the validity of our μ-tomoelastography method. By pushing the limits of spatial resolution to an unprecedented small pixel size, μ-tomoelastography revealed for the first time mechanical tissue structures and stiffness variation in murine CB, CO, CC and SC specimens including relatively stiff white matter and relatively soft gray matter. The visually stiffer appearance of white matter compared with gray matter in spinal tissue has to be validated by a larger group size. It should be noted that there are divergent reports in the literature about relative stiffnesses of gray and white matter which might be resolved by multifrequency MRE when accounting for different length scales, dynamic ranges, anisotropy and in-vivo versus ex vivo. μ-tomoelastography provides insight into micro mechanical structures of ex-vivo soft tissues and might be used in the future to investigate fresh biopsy samples.Acknowledgements
Support from the German Research Foundation (Sa901/16, Sa901/17, Ste1450/8-1, GRK2260 BIOQIC, SFB1340 “Matrix in Vision” and Cluster of Excellence Exc 257 NeuroCURE), from the German Federal Ministry of Education and Research (BMBF; 01EO0801, Center for Stroke Research Berlin) as well as from the European Union’s Horizon 2020 Program (ID 668039, EU FORCE – Imaging the Force of Cancer) is gratefully acknowledged.References
[1] Fung Y. Biomechanics: mechanical properties of living tissue. New York: Springer-Verlag; 1993.
[2] Hirsch S, Braun J, Sack I., Magnetic Resonance Elastography - Physical Background and Medical Applications, Weinheim, Germany: Wiley-VCH; 2017.
[3] Braun J, Tzschatzsch H, Korting C, Ariza de Schellenberger A, Jenderka M, Driessle T, Ledwig M, Sack I., A compact 0.5 T MR elastography device and its application for studying viscoelasticity changes in biological tissues during progressive formalin fixation.Magn Reson Med 2018;79(1):470-478.
[4] G. Bertalan, J. Guo, H. Tzschatzsch, C. Klein, E. Barnhill, I. Sack, J. Braun, Fast tomoelastography of the mouse brain by multifrequency single-shot MR elastography, Magn Reson Med 81(4) (2019) 2676-2687.
[5] Tzschätzsch H et al., Tomoelastography by multifrequency wave number recovery from time-harmonic propagating shear waves, Med Image Analysis (30):1-10, 2016.
[6] S. Koch, S. Mueller, M. Foddis, T. Bienert, D. von Elverfeldt, F. Knab, T.D. Farr, R. Bernard, M. Dopatka, A. Rex, U. Dirnagl, C. Harms, P. Boehm-Sturm, Atlas registration for edema-corrected MRI lesion volume in mouse stroke models, J Cereb Blood Flow Metab (2017) 271678X17726635.
Figures