0183
Reduction strategies for breathing motion artifacts in abdominal MR elastography1Department of Radiology, Charité - Universtitätsmedizin Berlin, Berlin, Germany, 2Institute of Medical Informatics, Charité - Universtitätsmedizin Berlin, Berlin, Germany
Synopsis
MR elastography can provide high-resolution stiffness maps of abdominal organs. However, MRE – in particular when applied with multiple drive frequencies – requires measure times which significantly exceed single breath holds. Therefore, reduction strategies for motion artifacts are required including breath-holds, navigators and image registration, which all were consistently applied and analyzed in this in-vivo study. Our results show that displacement of organs is smallest during breath-hold MRE while, remarkably, mean stiffness values are not significantly affected by breathing. Overall image quality is comparable between breath-hold and free-breathing MRE when the latter is corrected by 2D-image registration during post processing.
Introduction:
Abdominal magnetic resonance elastography (MRE) is a reproducible quantitative MRI method that provides imaging biomarkers reflecting the viscoelastic properties of tissues1. Since the introduction of MRE in 1995 by Muthupillai et al., various MRE methods have been developed which differ in image acquisition sequences, mechanical vibration hardware or image processing algorithms. Most abdominal MRE examinations are conducted during breath-hold, whereas other methods, such as tomoelastography allow the patient to breathe freely2,3. The impact of breathing motion on abdominal MRE has been addressed by only few studies4,5. Therefore, we aimed at (I) displacement quantification and (II) stiffness quantification of abdominal organs acquired by MRE under free-breathing, breath-hold and respiratory navigated tomoelastography, as well as (III) improvement of image quality by 2D-image registration before tomoelastography processing.Method:
11 healthy male participants were examined on a 1.5 T MRI Scanner (Magnetom Sonata, Siemens, Germany). MRE was performed using a single-shot spin-echo EPI sequence as described in2 using externally induced mechanical vibrations of 30, 40, 50 and 60 Hz. 9 coronal image slices with 2.7×2.7×5 mm³ voxel size were acquired at eight time steps equally spaced over a full vibration cycle with three dimensional flow-compensated motion encoding gradients (MEG). Full MRE examination was conducted in each participant four times: (1) repeated breath-hold examinations (BH) in expiration, (2) free-breathing (FB) during the whole scan, (3) respiratory navigator-triggered with gating method (G) and (4) respiratory navigator-triggered with gating and following (GF) by slice adjustment of the respective abdominal motion. Navigator MRE was performed with a pencil beam technique capturing diaphragmatic motion. Total MRE scan time was approximately 6min for BH, 3.5min for FB, 5min for G and 4.5 min for GF. 2D Displacement of the liver, spleen, pancreas and kidneys were quantified along the cranio-caudal axis for each of the four experiments by 2D-image registration, choosing one slice covering the majority of the respective organ. Using elastix with (i) rigid body transformation and (ii) advanced Mattes mutual information as a metric, all images are registered to the first of all n=96 time points yielding the 2D displacement (xn, yn)6,7. Based on the effective displacement un=√((x ̅-xn )2+(y ̅-yn )2) the standard deviation σu and the range Δu=max(un)-min(un) are calculated. MRE data were postprocessed using k-MDEV providing maps (elastograms) of shear wave speed c in m/s which indicate tissue stiffness8.Statistical analyses were performed for comparing Δu and σu, as well as c in elastograms the liver, pancreas, kidney and spleen acquired by the four MRE experiments (BH, FB, G, and GF). Additionally, elastograms were generated after motion correction by image registration.
Results:
Organs were differently affected by breathing motion (Figure 1A) with liver showing highest displacement amplitudes (Δu=13.75 mm; σu=3.04 mm) followed by spleen (Δu=11.15 mm; σu=2.18 mm), pancreas (Δu=10.26 mm; σu=2.25 mm) and kidneys (Δu=7.45 mm; σu=1.71 mm). Kidneys exhibited significantly lower displacement than liver (P<0.05).Breath-hold MRE (Figure 1B) resulted in relatively amotile organs with the following effective displacements: liver (Δu=4.8 mm; σu=0.77 mm), pancreas (Δu=4.22 mm; σu=0.72 mm), spleen (Δu=3.43 mm; σu=0.53 mm) and kidneys (Δu=2.94 mm; σu=0.5 mm).
Navigator based MRE allowed for motion compensation yielding good effective displacement reduction in the liver (GF: Δu=8.43 mm; σu=1.82 mm; G: Δu=13.35 mm; σu=2.57 mm). GF resulted in significant lower effective displacement than free-breathing MRE. Figure 1C shows effective displacement values of the different measurement techniques.
Despite large differences of effective displacement amplitudes among organs and techniques mean shear wave speed c values were not significantly different among the different techniques (Figure 2- 3 and Table 1). In general, visual inspection indicates better detail resolution in the stiffness maps was better in breath-hold than free-breathing MRE (Figure 2A and B). Further improvement was observed by rigid body image registration of free-breathing data (Figure 4). Specifically, in renal tissue and pancreas sharper organ borders and less blurry images could be achieved by image registration.
Discussion and Conclusion:
Breath-hold MRE results in smallest displacements of abdominal organs compared to free-breathing MRE and navigator-triggered gating MRE techniques. Among abdominal organs, the liver is most affected by breathing while the kidneys show smallest displacement amplitudes. Other than indicated by blurred MRE magnitude images in free-breathing examinations, mean stiffness values were not significantly affected by the motion. 2D rigid body registration of images before multifrequency inversion leads to an overall improved image quality and sharper tissue interfaces especially for data acquired under free-breathing.Among all tested artifact reduction strategies, free-breathing multifrequency MRE in combination with retrospective rigid body image registration is recommended for the following reasons: i) shortest acquisition times, ii) no collaboration of the patient is needed, and iii) overall stability of mean stiffness values.
Acknowledgements
References
1. Muthupillai, R., et al. Magnetic resonance elastography by direct visualization of propagating acoustic strain waves. Science 269, 1854-1857 (1995).
2. Dittmann, F., et al. Tomoelastography of the abdomen: Tissue mechanical properties of the liver, spleen, kidney, and pancreas from single MR elastography scans at different hydration states. Magnetic Resonance in Medicine 78, 976-983 (2017).
3. Shahryari, M., et al. Tomoelastography Distinguishes Noninvasively between Benign and Malignant Liver Lesions. Cancer Res (2019).
4. Murphy, I.G., et al. Comparison of breath-hold, respiratory navigated and free-breathing MR elastography of the liver. Magn Reson Imaging 37, 46-50 (2017).
5. Garcia, S.R.M., et al. Tomoelastography of the native kidney: Regional variation and physiological effects on in vivo renal stiffness. Magnetic Resonance in Medicine 79, 2126-2134 (2018).
6. Klein, S., Staring, M., Murphy, K., Viergever, M.A. & Pluim, J.P. elastix: a toolbox for intensity-based medical image registration. IEEE Trans Med Imaging 29, 196-205 (2010).
7. Shamonin, D.P., et al. Fast parallel image registration on CPU and GPU for diagnostic classification of Alzheimer's disease. Front Neuroinform 7, 50 (2013).
8. Tzschatzsch, H., et al. Tomoelastography by multifrequency wave number recovery from time-harmonic propagating shear waves. Medical Image Analysis 30, 1-10 (2016).
Figures
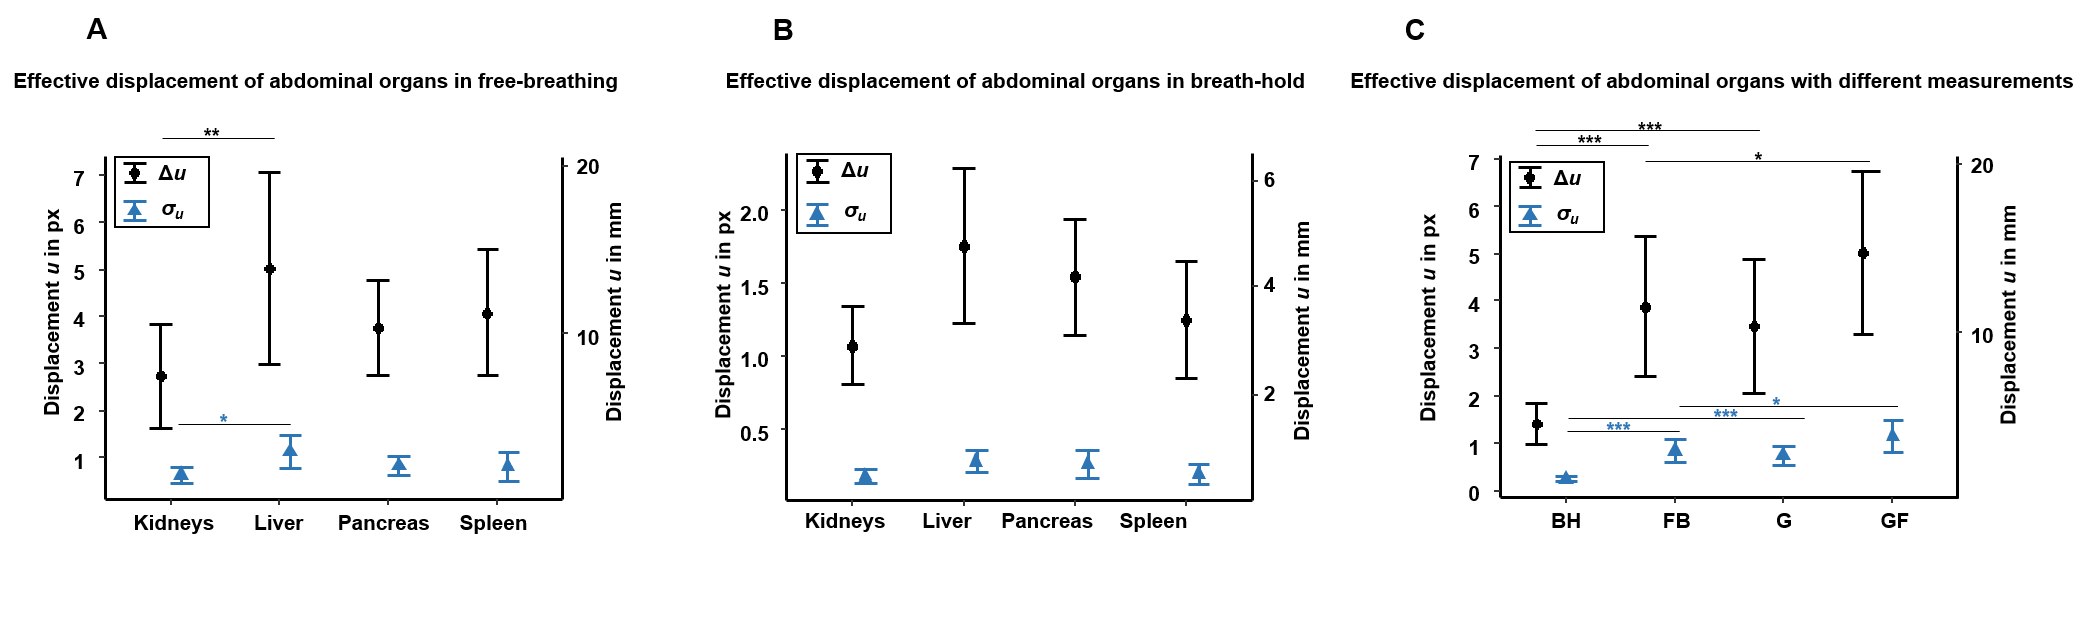
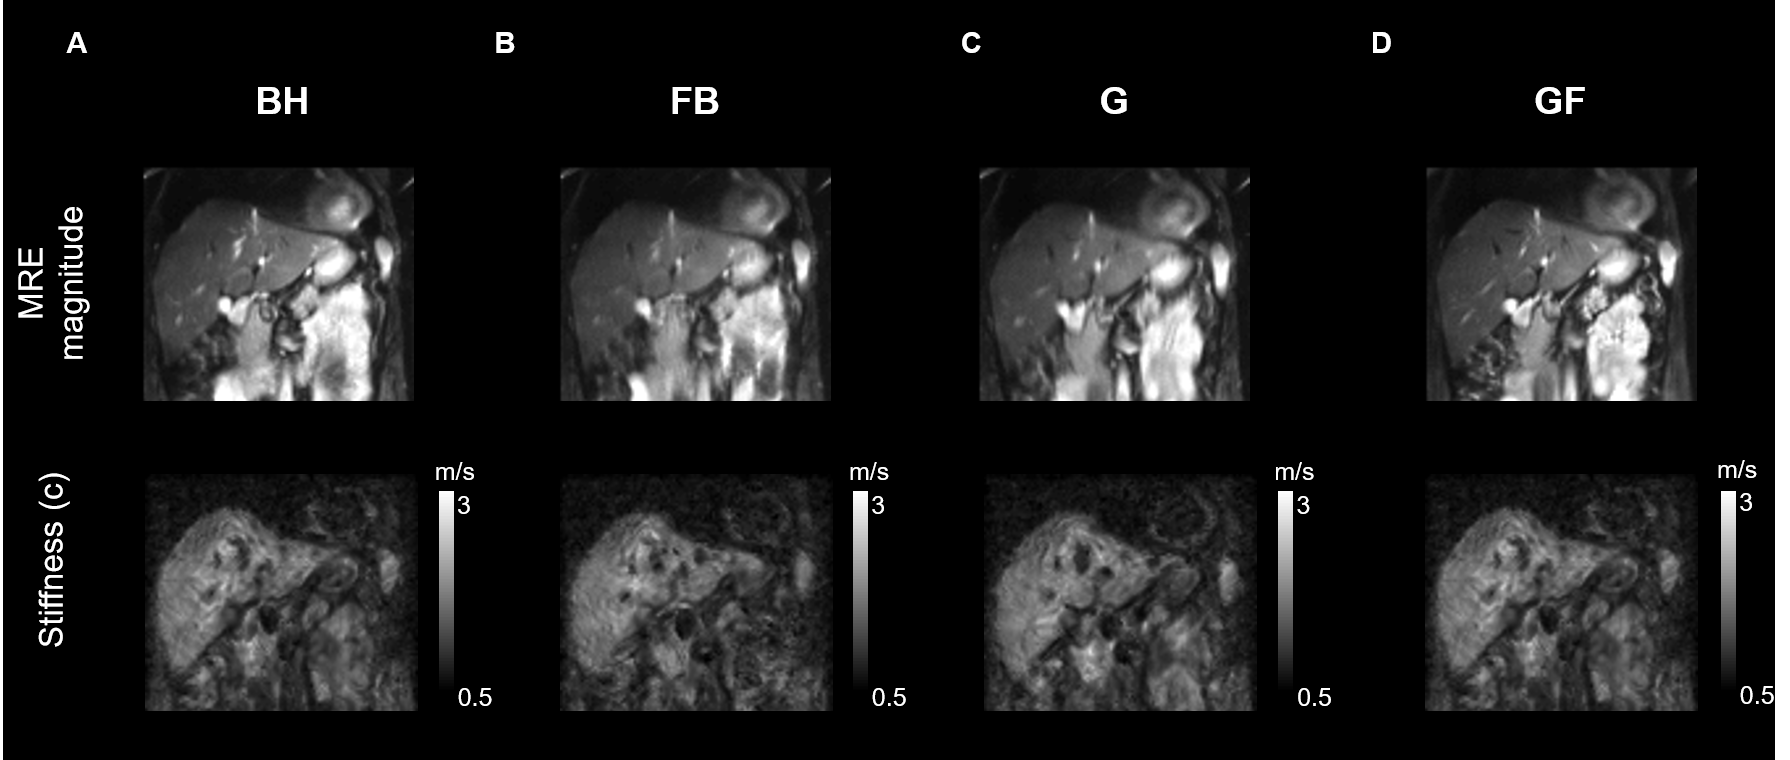
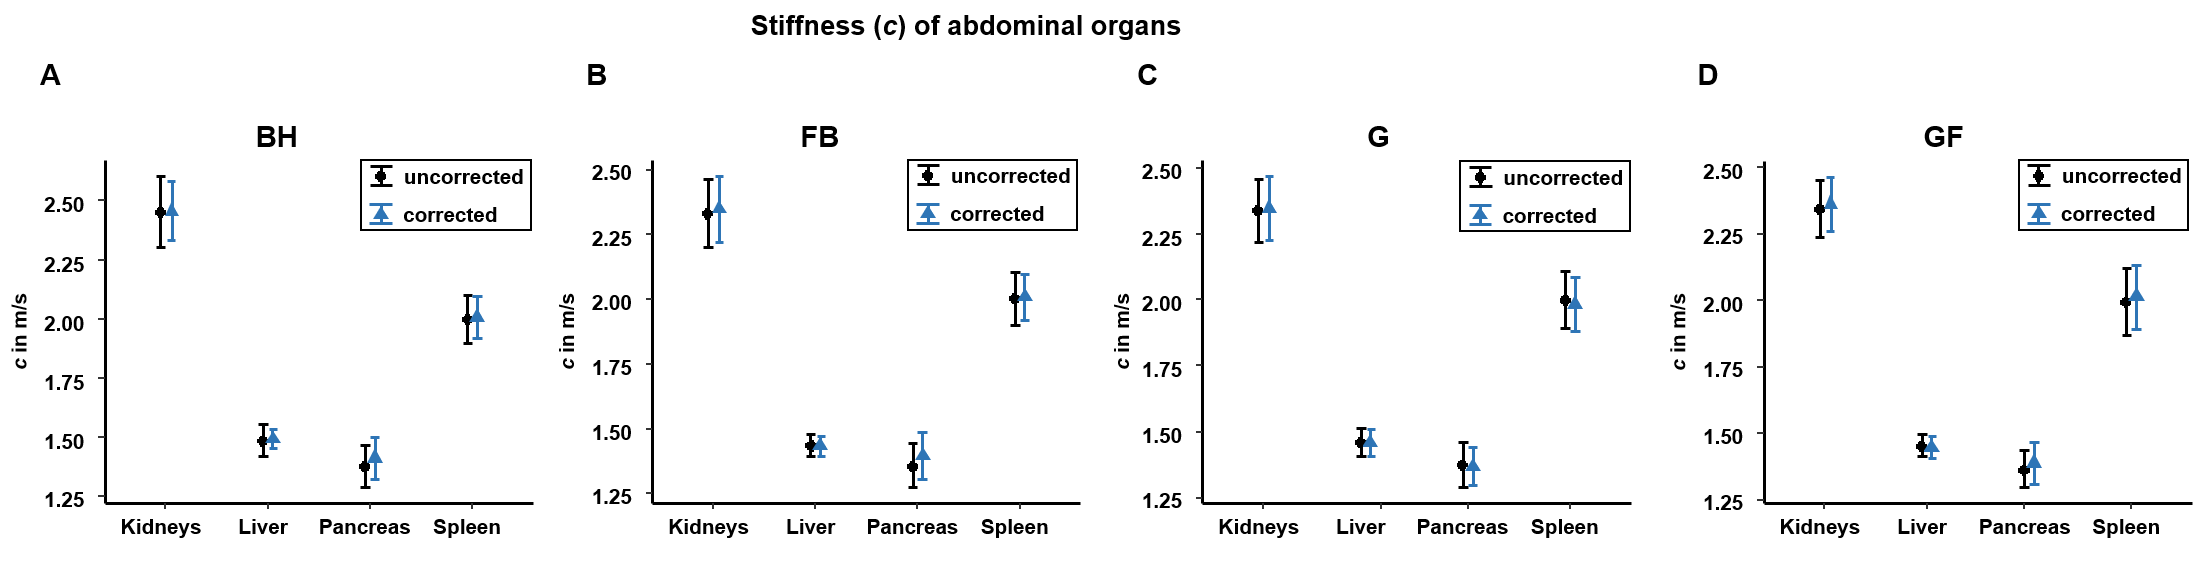
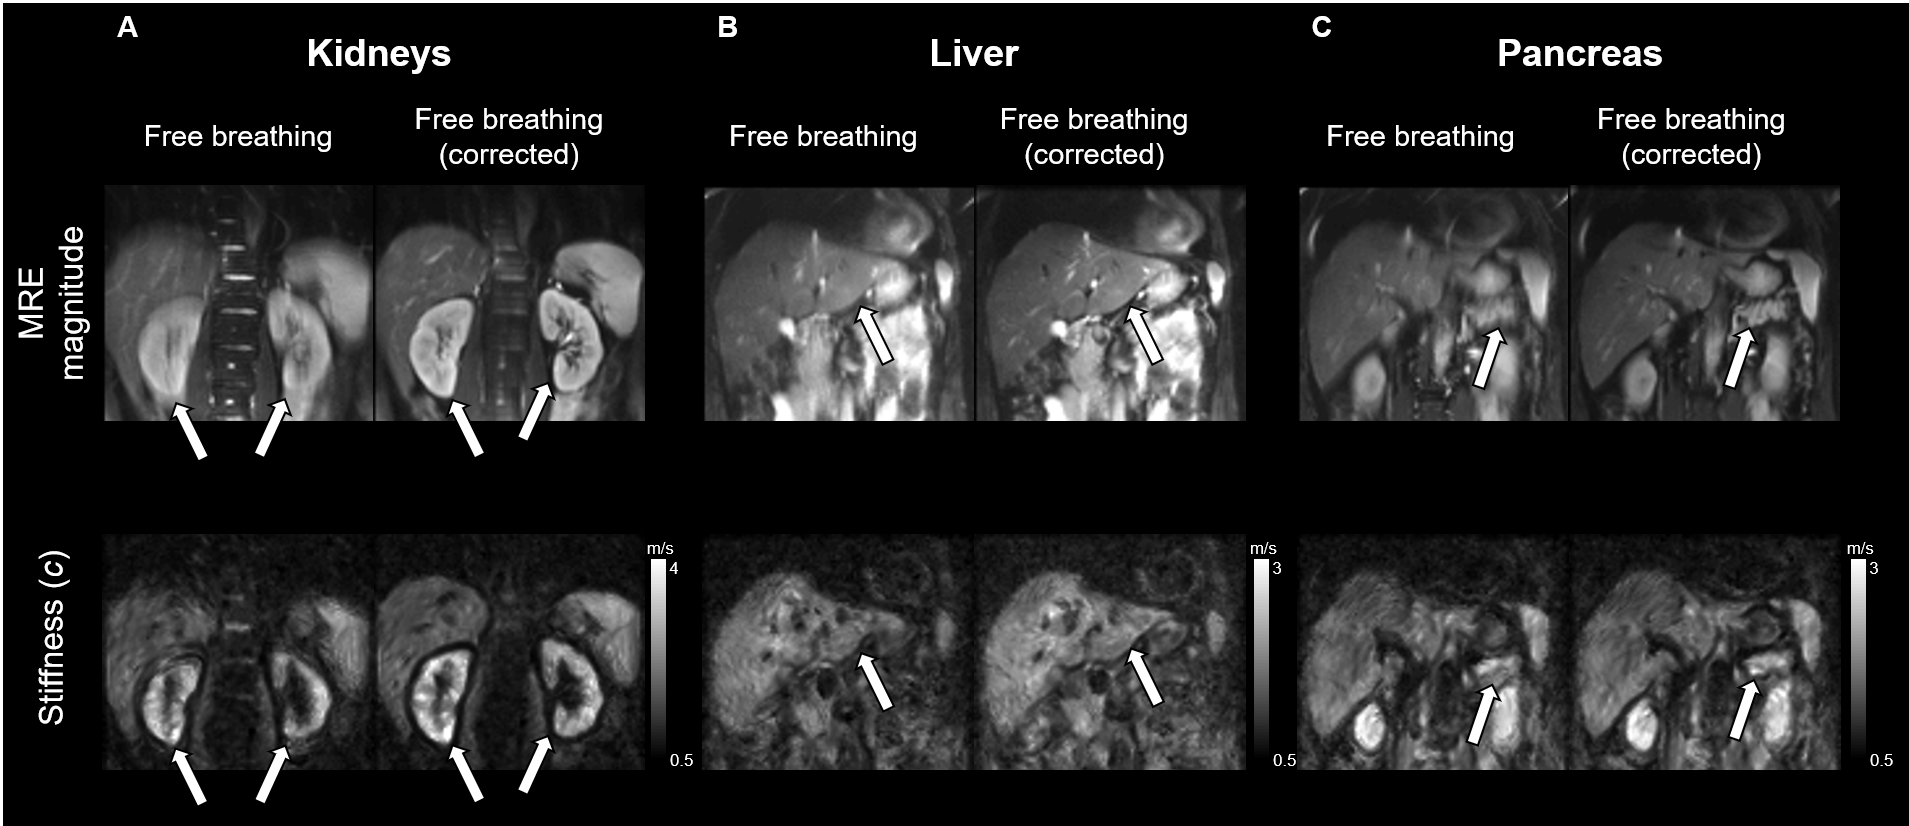
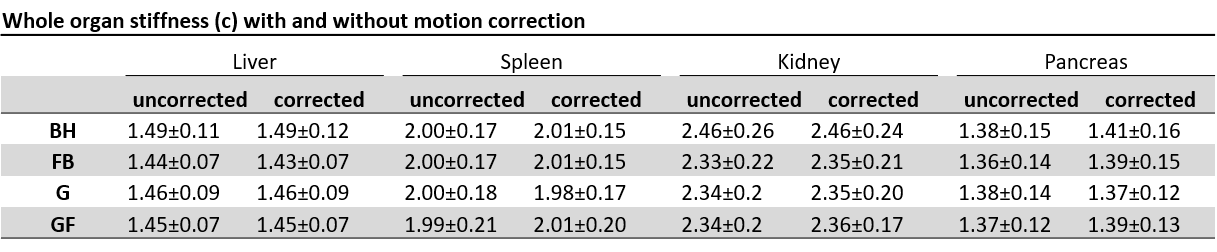
Table 1: Whole organ stiffness (c) for different data acquisition schemes with and without motion correction
c, shear wave speed; before motion correction (uncorrected) and corrected, after motion correction with rigid body image registration (corrected). Means are given with ± standard deviation.