0181
Improving Phase-based Conductivity Reconstructions by Means of Deep Learning-based Denoising of B1+ Phase Data1Department of Electrical and Electronic Engineering, Yonsei University, Seoul, Korea, Republic of, 2Department of Radiotherapy, Division of Imaging & Oncology, University Medical Center Utrecht, Utrecht, Netherlands, 3Computational Imaging Group for MR diagnostics and therapy, Center for Image Sciences, University Medical Center Utrecht, Utrecht, Netherlands, 4Department of Radiology, Gangnam Severance Hospital, Seoul, Korea, Republic of
Synopsis
Electrical Properties Tomography reconstruction technique is highly sensitive to noise, as it requires Laplacian calculations of phase data. To alleviate the noise amplification, large derivative kernels combined with image filters are used. However, this leads to severe errors at tissue boundaries. In this study, we employ a deep learning-based denoising network allowing for noise robust conductivity reconstructions obtained using smaller derivative kernels sizes. This comes with the intrinsic advantage of reduced boundary errors. The feasibility study was performed using cylindrical numerical simulations. Then, the proposed technique was tested using spin echo in-vivo data, and clinical patient data.
Introduction
Electrical Properties Tomography (EPT) is a non-invasive technique that reconstructs tissue conductivity by computing second order spatial derivatives of B1+ phase maps1,2. However, this operation leads to severe noise amplification in the reconstructed conductivity maps3,7.To overcome signal-to-noise (SNR) problem, image filtering methods have been proposed1,3, leading to a tradeoff between noise amplification and boundary errors. Larger kernel size yields bigger errors at boundary. In this work, we propose a deep learning-based denoising method for noise-robust conductivity reconstructions. This allows for using smaller derivative kernels and therefore leads to smaller boundary errors.Method
A deep convolutional framelets network was utilized for denoising of phase data4. This network was first trained and tested using simulated phantom data, which allow knowledge of ground-truth conductivity values, and then training and testing were performed in-vivo.[Simulation]
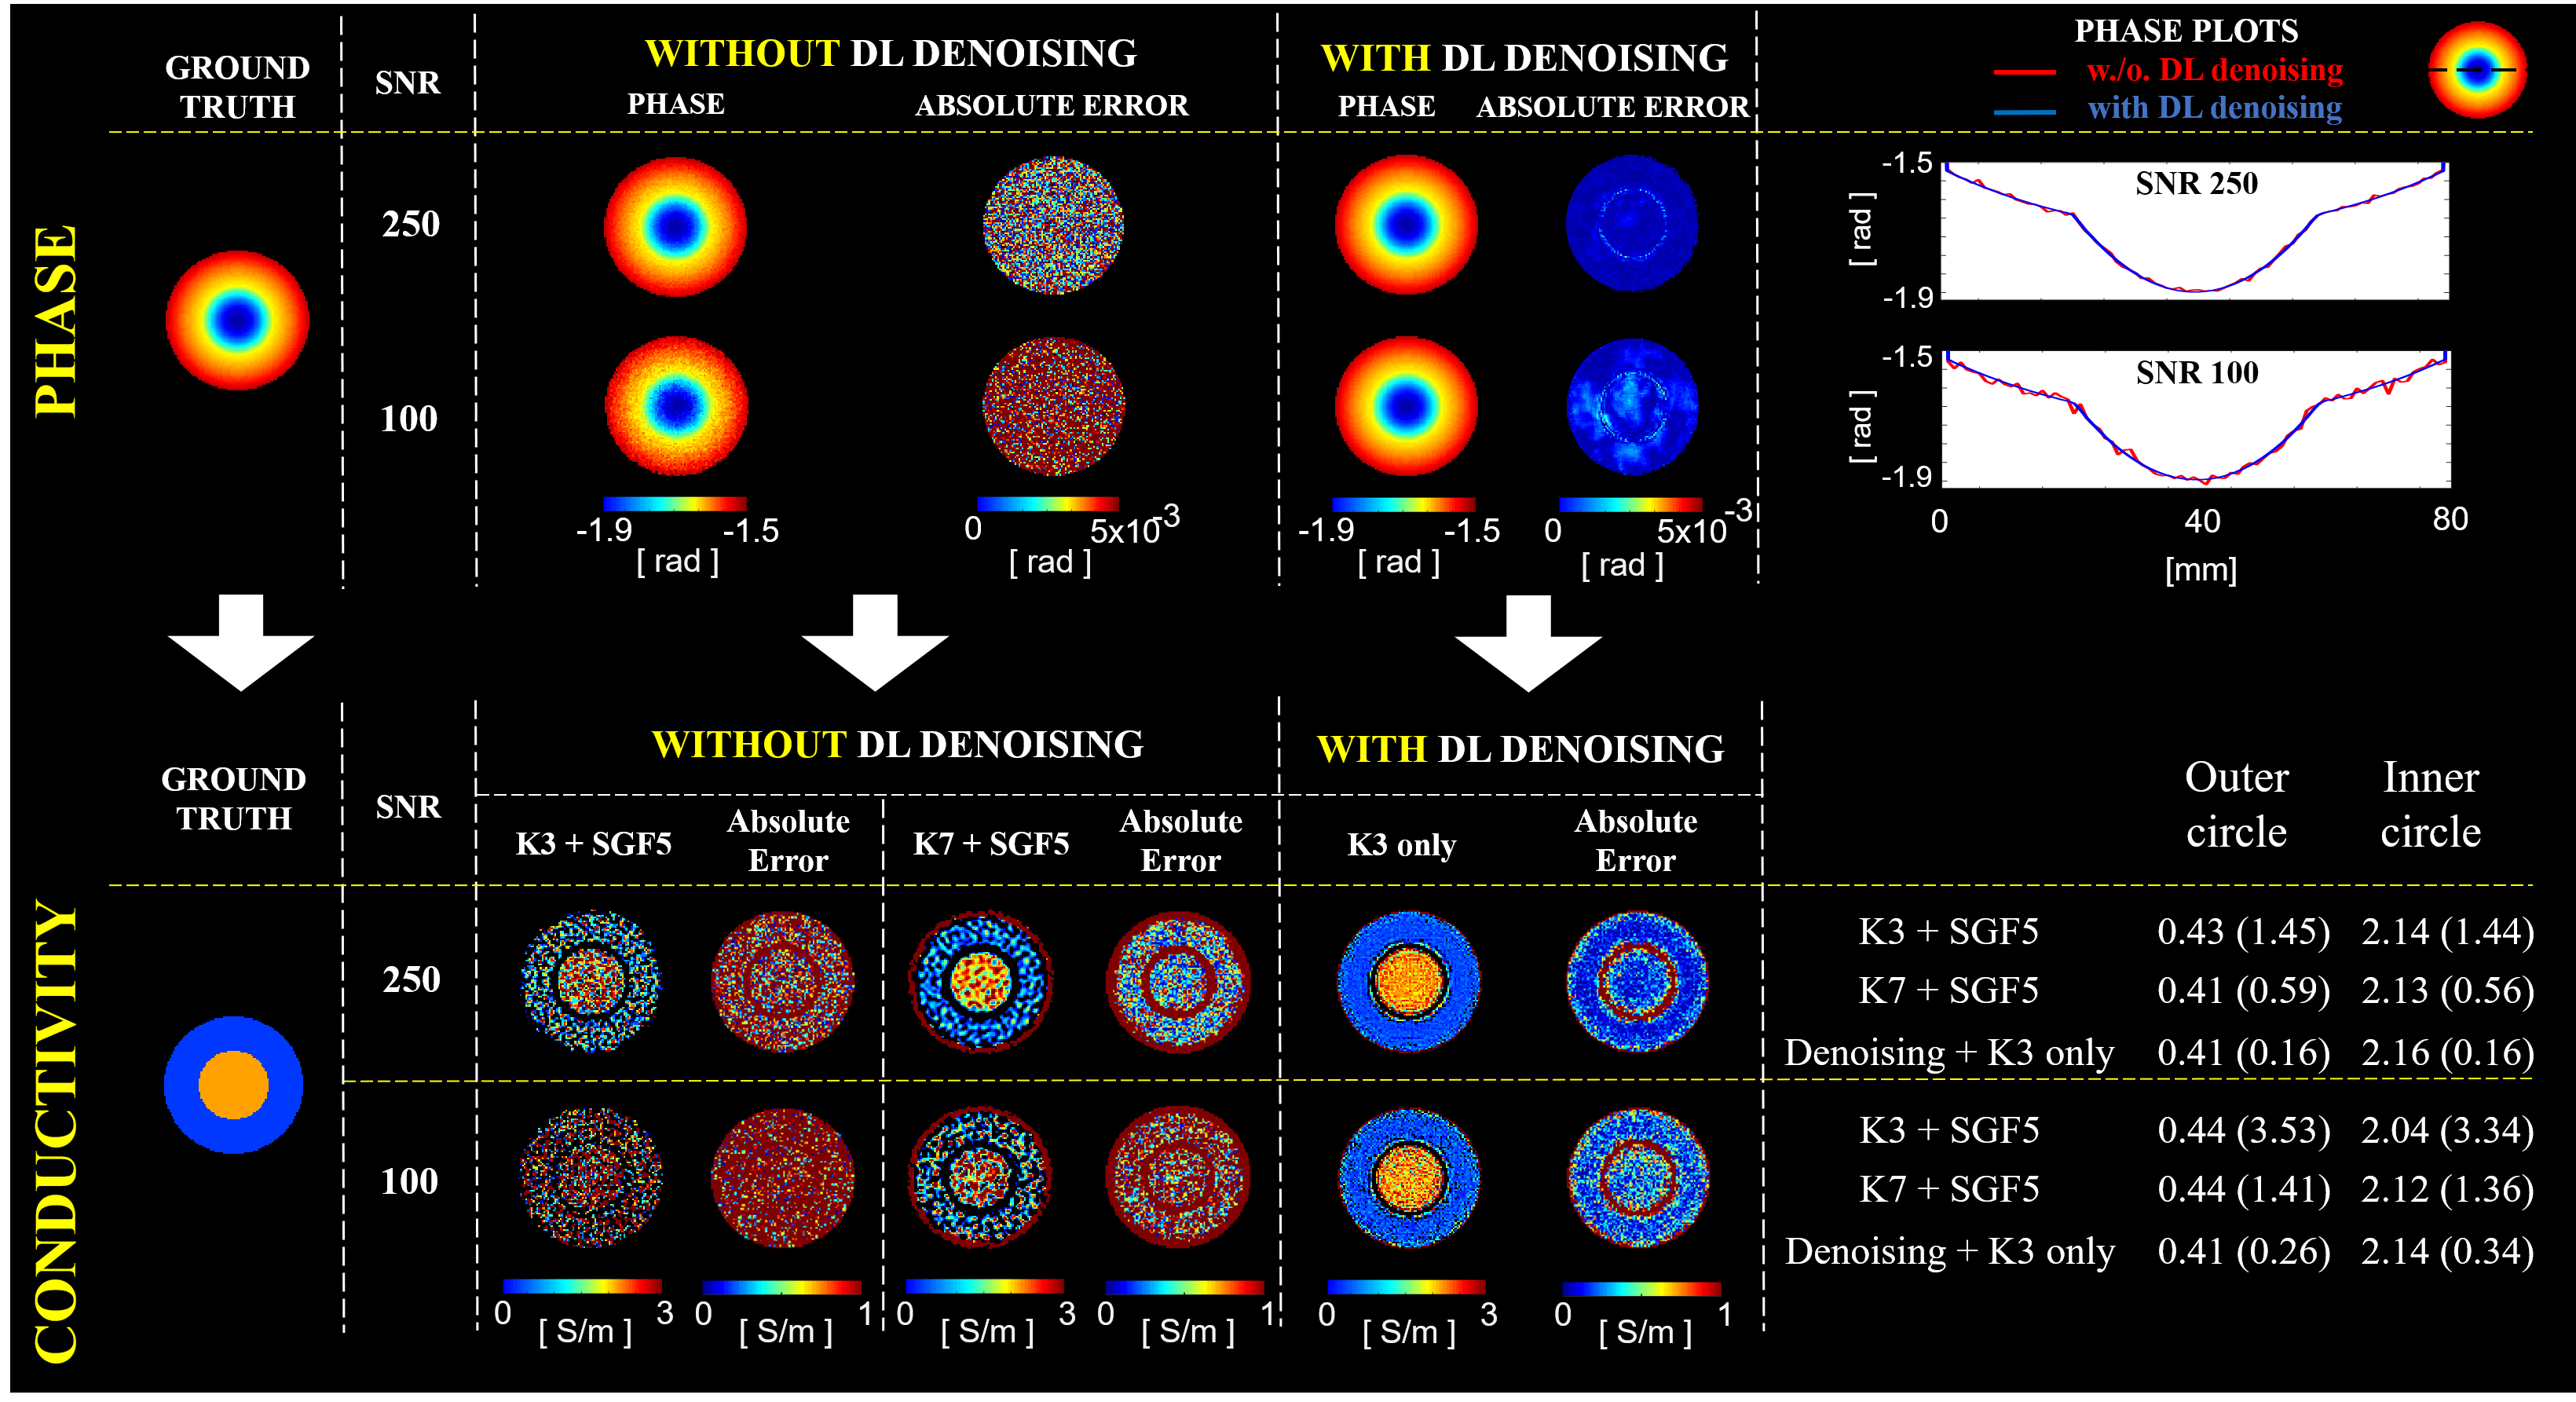
Numerical simulations were performed in MATLAB for cylindrical phantoms: 2D-complex B1+ maps were obtained by Bessel-boundary-matching method, which enables electromagnetic field (EMF) simulations for concentric models5. Double-layers cylindrical models are composed with various radiuses, various conductivity values (0.2/0.4/0.5/0.7/1.2/1.4/1.6/1.8/2.5 S/m) and various SNR levels (100/150/200/250/300). A total of 672 2D-complex B1+ numerical maps were generated for training, which were paired with their corresponding noiseless models. The network was tested on one double-layer cylindrical model (inner-radius=20mm, outer radius=40mm, image resolution=1x1mm2, inner conductivity=2.14S/m, outer conductivity=0.34S/m) which was excluded from training set6. Afterwards, conductivity reconstructions with different EPT derivative kernel sizes (i.e., K3=3x3 voxels and K7=7x7 voxels) combined with Gaussian filters (here defined as SGF5:5x5 voxels and SGF7:7x7voxels) were compared with conductivity reconstructions performed after DL-based denoising. For these latter reconstructions, Gaussian filters were not employed7. Then, we investigated whether DL-denoising of phase data can allow using small derivative kernels (K3), which in turn allows for smaller boundary errors and thus better detection of small structures.
[In-vivo Data]
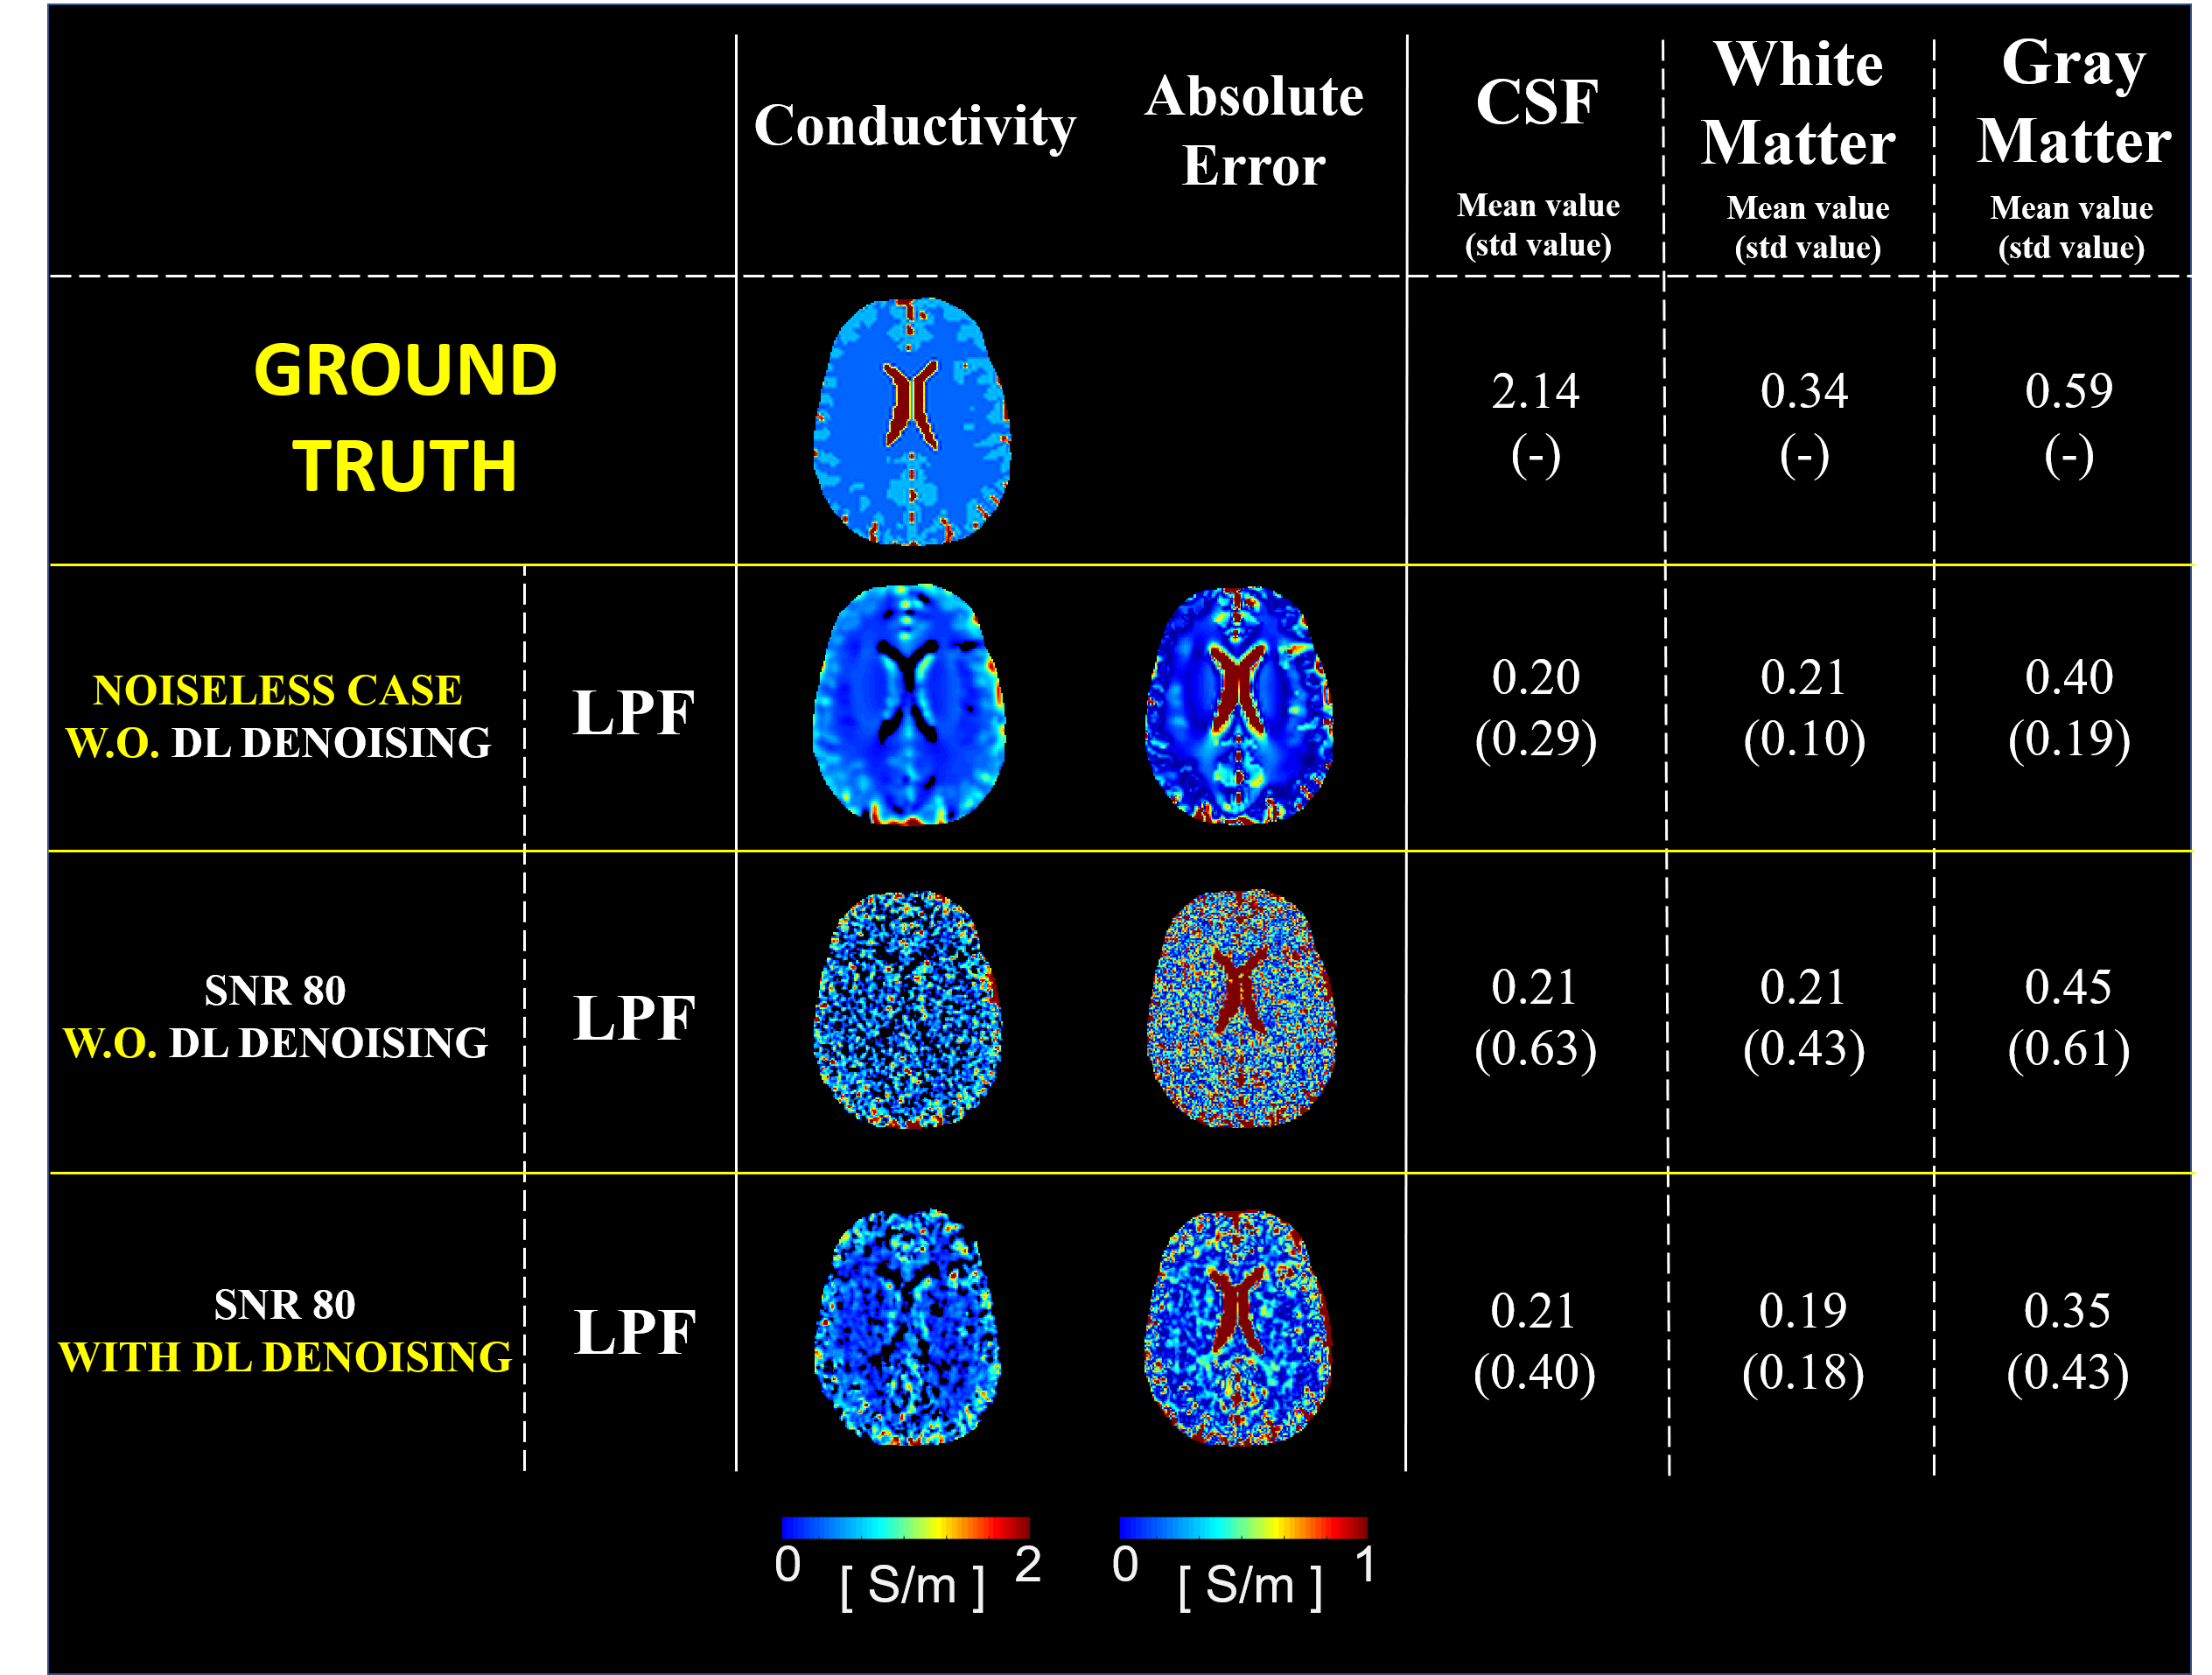
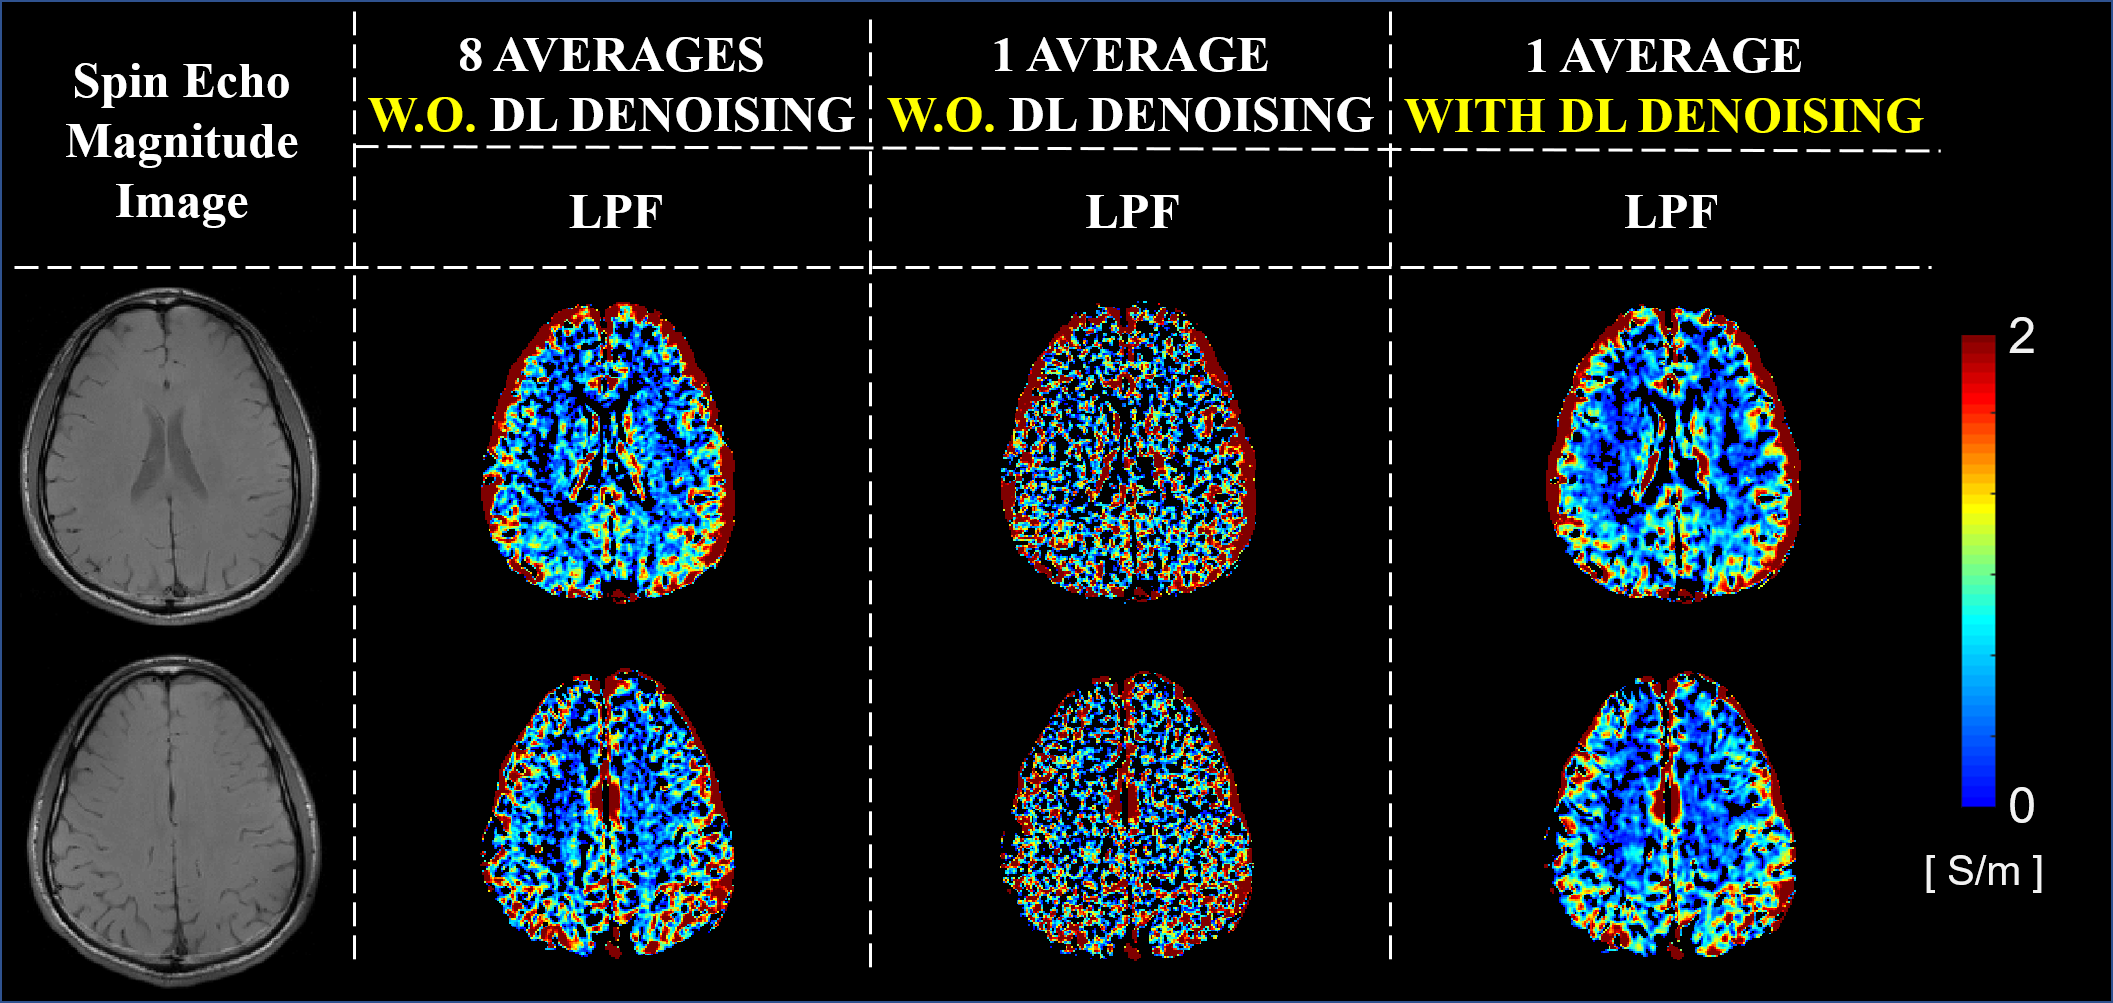
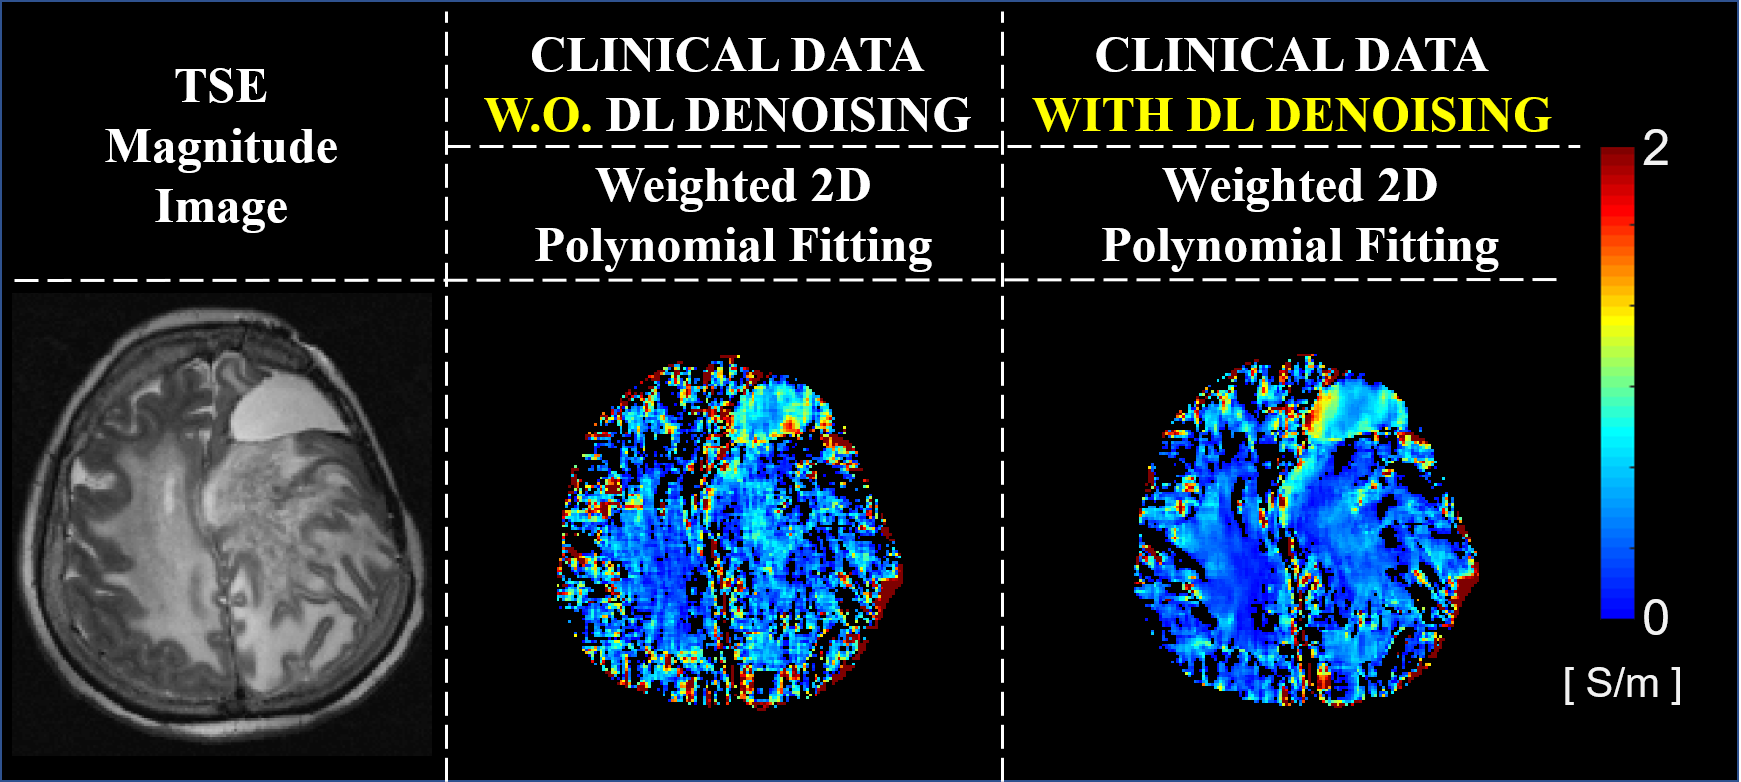
Spin-Echo (SE) phase data were acquired at 3T (Skyra; Siemens, Erlangen, German): TR/TE=1500/20ms, image resolution=1×1×3mm3, 25 slices, number-of-averages=8. For DL-denoising, training was performed by using in input complex pair images from 11 healthy volunteers with respectively 1 signal-average and 8 signal-averages. Testing was performed on one volunteer (excluded from the training set). Conductivity reconstructions were performed on phase data before and after DL-denoising. Conductivity reconstructions from phase data with 8 signal-averages were performed as reference. In-vivo conductivity reconstructions were performed using an advanced kernel: Low-Pass-Filter (LPF) kernel8, since in-vivo data are affected by other sources of artifacts not present in simulations. As a reference for the in-vivo results, we investigated the impact of DL-denoising on conductivity reconstructions using realistic simulation on a head model (DUKE, Sim4Life)9, using the same pipeline used for the in-vivo data. Finally, conductivity reconstructions from a patient with Anaplastic oligodendroglioma are shown. Conductivity reconstructions were performed from phase data acquired using a Turbo Spin Echo (TSE) sequence: TR/TE=7840/98ms, image resolution=0.5×0.6×4mm3, 31 slices, which were resized to match the required resolution for the input to the DL-network. Conductivity reconstructions were performed using a weighted 2D polynomial fitting method10, given the very low SNR of the input data (SNR=22).
Results
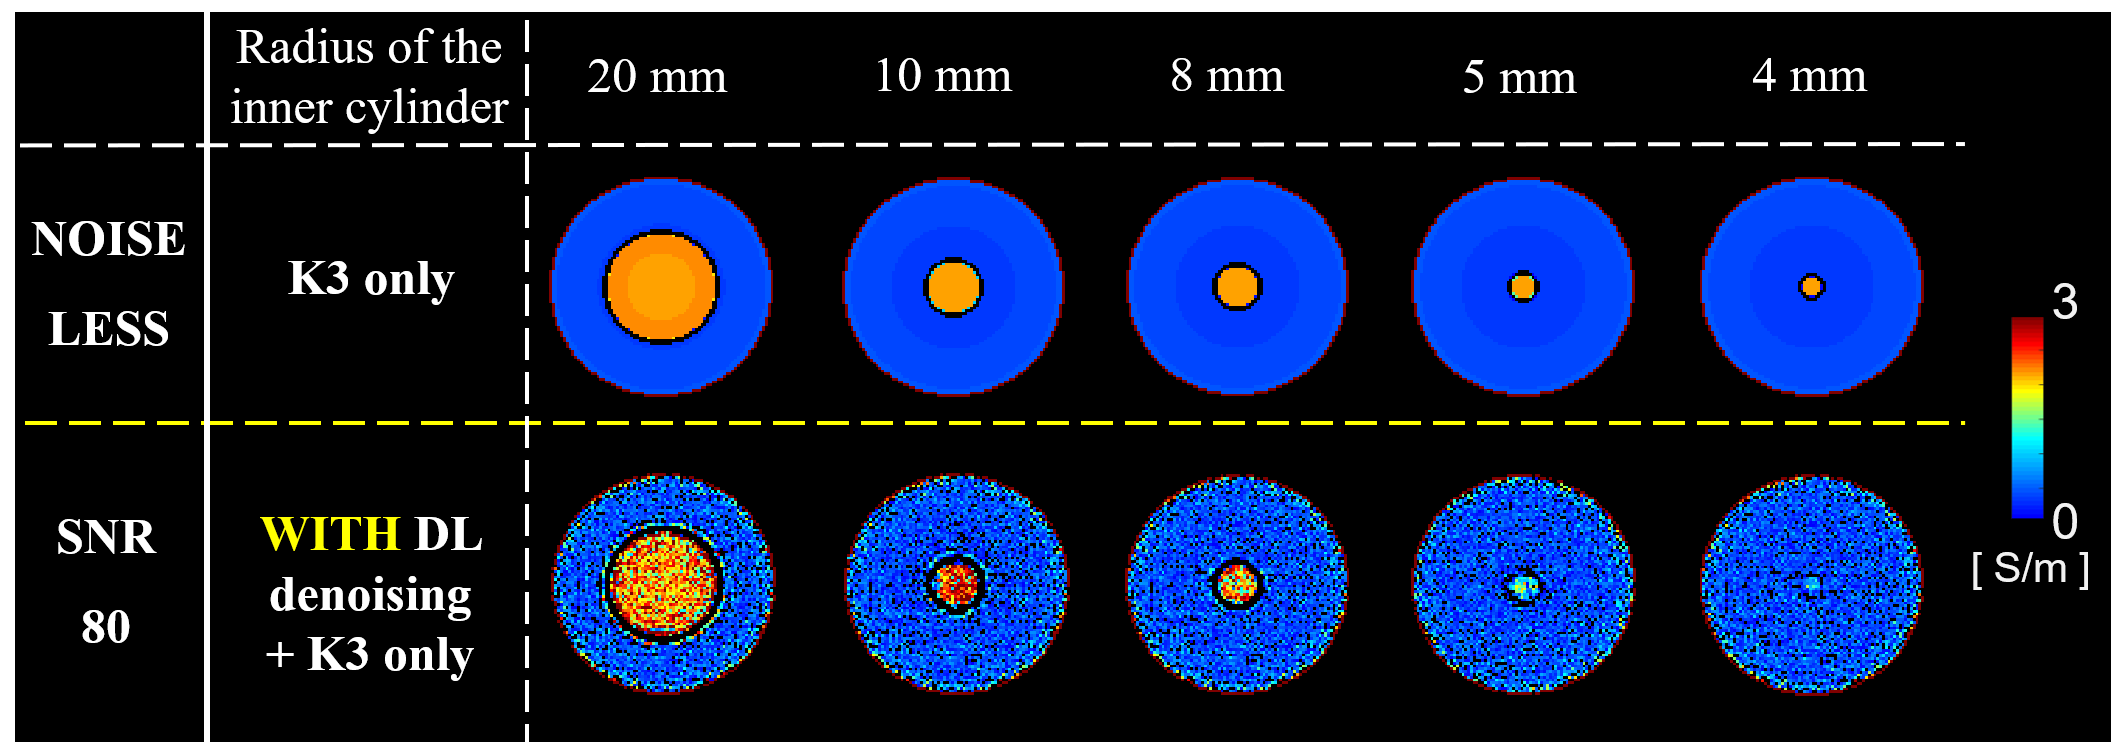
Figure 1 shows the impact of DL-denoising on phase data and corresponding conductivity reconstructions. Considerable reduction of noise can be observed. Without DL-denoising, large kernels (K7) are needed for conductivity reconstructions, since small kernels (K3) lead to severe noise amplification. In contrast, small kernels can be used after DL-denoising leading to good quality conductivity reconstructions with reduced noise amplification and boundary errors. Figure 2 shows that conductivity reconstructions after DL-denoising allow detection of small structures until 4 mm, although with loss in accuracy. Accurate reconstructions are observed for structures bigger than 8 mm. Figure 3 shows that DL-denoising improves the precision of conductivity reconstructions for white matter (WM) and gray matter (GM) (reduced standard deviations). Conductivity reconstructions of cerebrospinal fluid (CSF) are yet not feasible. Figure 4 shows in-vivo reconstructions. In-vivo reconstructions performed by combining DL-denoising with LPF kernel show good image quality and noise robustness. Figure 5 shows the results on retrospectively collected data from a clinical dataset. As it can be seen, the DL-denoising shows visual improvement compared to conductivity reconstructions without DL-denoising.Discussion and Conclusion
We studied the impact of DL-based denoising of phase data to improve phase-based conductivity reconstruction. By performing phase denoising, smaller kernels can be used for EPT reconstructions, thus boundary errors can be reduced and smaller structures can be detected, compared to standard EPT reconstructions using large kernels (i.e., K7) and image filters. However, since simulation study was performed only for simple cylindrical simulations, it is necessary to consider the training and testing for various shapes (e.g. different brain models). In-vivo reconstructions, benchmarked by simulations, show that this approach leads to an improvement of the reconstructed conductivity maps, however other source in-vivo artifacts such motion/pulsation which affect the phase data can still lead to erroneous conductivity reconstructions, in particular in the CSF. Nonetheless, DL-denoising appears a promising solution to alleviate the noise amplification on conductivity maps introduced by the Laplacian calculation, and its application is fast, therefore implementable for in-vivo reconstructions/clinical settings.Acknowledgements
This work was supported by the National Research Foundation of Korea(NRF) grant funded by the Korea government(MSIT) (NRF-2019R1A2C1090635)References
1. U. Katscher, T. Voigt, C. Findeklee, et al., Determination of Electric Conductivity and Local SAR Via B1 Mapping. IEEE TMI. 2009;28(9):1365-1374.
2. T. Voigt, Katscher U., Doessel O., Quantitative conductivity and permittivity imaging of the human brain using electrical properties tomography. Mag. Reson. Med., 2011;66(2): 456-466.
3. Seung-Kyun Lee, et al., Theoretical investigation of random noise-limited signal-to-noise ratio in MR-based electrical properties tomography. IEEE transaction on medical imaging, 2015, 34.11: 2220-2232.
4. Eunhee Kang, et al., Deep convolutional framelet denosing for low-dose CT via wavelet residual network. IEEE transactions on medical imaging, 2018;37.6:1358-1369.
5. Bob van den Bergen, et al., Ultra fast electromagnetic field computations for RF multi-transmit techniques in high field MRI. Physics in Medicine & Biology, 2009, 54.5: 1253.
6. P. A. Hasgall, et al., ITIS Database for thermal and electromagnetic parameters of biological tissues; 2013.
7. Stefano Mandija, et al., Error analysis of helmholtz‐based MR‐electrical properties tomography. Magnetic resonance in medicine, 2018, 80.1: 90-100.
8. Jaewook Shin, et al., Redesign of the Laplacian kernel for improvements in conductivity imaging using MRI. Magnetic resonance in medicine, 2019, 81.3: 2167-2175.
9. Marie-Christine Gosselin, et al., Development of a new generation of high-resolution anatomical models for medical device evaluation: the Virtual Population 3.0. Physics in Medicine & Biology, 2014, 59.18: 5287.
10. Joonsung Lee, et al., MR‐based conductivity imaging using multiple receiver coils. Magnetic resonance in medicine, 2016, 76.2: 530-539.
Figures