0175
Multi-T1D weighting ihMT imaging in the Cuprizone mouse model1Aix-Marseille Univ, CNRS, CRMBM, Marseille, France, 2Aix-Marseille Univ, CNRS, IBDM, Marseille, France, 3Aix-Marseille Univ, CNRS, ICR, Marseille, France, 4Division of MR Research, Radiology, Beth Israel Deaconess Medical Center, Harvard Medical School, Boston, MA, United States
Synopsis
Inhomogeneous magnetization transfer (ihMT) is a myelin sensitive MRI technique that provides access to multiple contrast regimes by tuning the amount of dipolar relaxation time (T1D) weighting of the sequence. This opens new perspectives to characterize the sensitivity and specificity of ihMT for myelin in a pathological context. In this study, multiple T1D-weighting ihMT imaging was investigated in the cuprizone mouse model. IhMT signals compared to myelin imaging with fluorescence microscopy demonstrate that ihMT techniques that are weighted towards long T1D values are more specifically related to myelin content during the demyelinating/remyelinating phases of the cuprizone model.
Introduction
Inhomogeneous magnetization transfer (ihMT)1 is an MT-based imaging technique, whose contrast is weighted by T1D, the dipolar order relaxation time2. Adjustment of the off-resonance irradiation pattern of ihMT sequences allows exploring various T1D-weightings and opens access to a multitude of contrast possibilities. A recent comparative study with fluorescence microscopy, performed on healthy genetically modified GFP mice generally validated ihMT as a myelin-sensitive imaging technique, although distinct characteristics were observed when varying the T1D-weigthing3. Hence, signal attenuation of components associated with short T1Ds by applying T1D-filtering strategies4 allowed deriving ihMT images with a specificity for myelin up to 5 times higher than that of conventional MT techniques albeit at the cost of a loss in sensitivity. Conversely, ihMT images obtained without T1D-filtering offered highest sensitivity but modest specificity for myelin. In the following comparative study between ihMT MRI and GFP fluorescence microscopy, we address the matter of T1D-weightings and the associated sensitivity and specificity of ihMT for myelin in the pathological context of the demyelinating cuprizone mouse model5,6.Materials and Methods
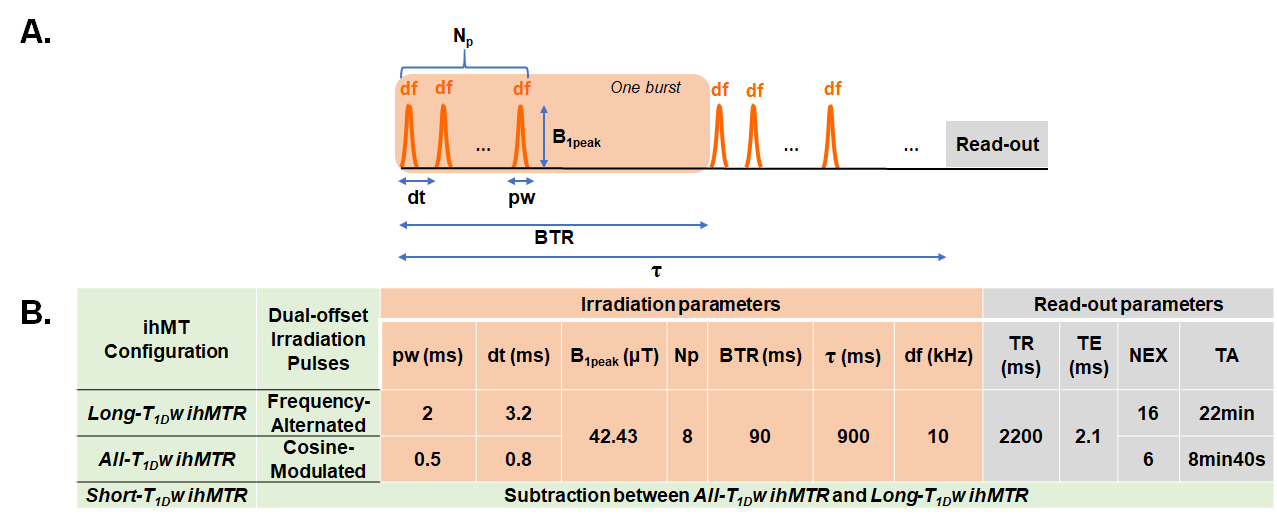
Cuprizone mouse model: Demyelination was induced in plp-GFP mice (n=23) by cuprizone administration in standard powder chow (0.2%) for 5 consecutive weeks and was followed by a 4 weeks remyelination phase, triggered by the termination of the cuprizone diet. Mice were divided into 5 groups (W0-control, W3, W5, W7 and W9), each one corresponding to the week of MR scans and fluorescence microscopy analyses.MR experiments: ihMT images were acquired on a preclinical 7T Bruker scanner (equipped with a 4-channel phased array receive-only MRI CryoProbe) using a slab-selective 3D ihMT-RAGE sequence (Fig.1) (TR/TE= 2200/2.1 ms, matrix size 192x192x8, in-plane resolution 100x100x750 µm3), covering the whole Corpus Callosum (CC). IhMTR images with three different T1D-weigthings were investigated (Table 1): Cosine-modulated (CM) pulses used for simultaneous dual-offset saturation resulted in the absence of any T1D filtering, hence producing ihMTR images sensitive to a wide range of T1Ds (All-T1Dw ihMTR). Frequency-alternated pulses with a repetition time between pulses Δt=3.2 ms, produced ihMTR images weighted toward long T1D values (Long-T1Dw ihMTR). Finally, the composite images made from the difference between All-T1Dw ihMTR and Long-T1Dw ihMTR images correspond to ihMTR images weighted toward short T1D values (Short-T1Dw ihMTR). After the MR scan, mice were anesthetized and intracardially perfused with the fixative paraformaldehyde (PFA 4%). Mouse brains were extracted and sectioned into 20-µm thick slices.
Processing: Sensitivity of All-T1Dw ihMTR, Long-T1Dw ihMTR, and Short-T1Dw ihMTR to demyelination/remyelination processes of the cuprizone model was assessed by comparing ihMTR values to GFP fluorescence intensity. Templates of All-T1Dw ihMTR, Long-T1Dw ihMTR and Short-T1Dw ihMTR were built at each time point upon averages of individual ihMTR maps registered into a T2-weighted high-resolution template using ANTs procedures7. A mouse brain atlas8 was projected onto the T2w template allowing for automatic segmentation of brain structures in the ihMTR templates. Values in corpus callosum and Cortex (Cx) taken at -1 mm and +0.7 mm from bregma were then compared to GFP fluorescence intensity measured using ImageJ (NIH, Bethesda, MD, USA) in regions of interest manually selected in the same structures at the same levels of the brain. Finally, a voxel-based analysis of ihMTR in the whole 3D volume during the demyelinating (W0-W3-W5) and remyelinating (W5-W7-W9) phases was performed using SPM to extract clusters with significant signal variations.
Results and discussion
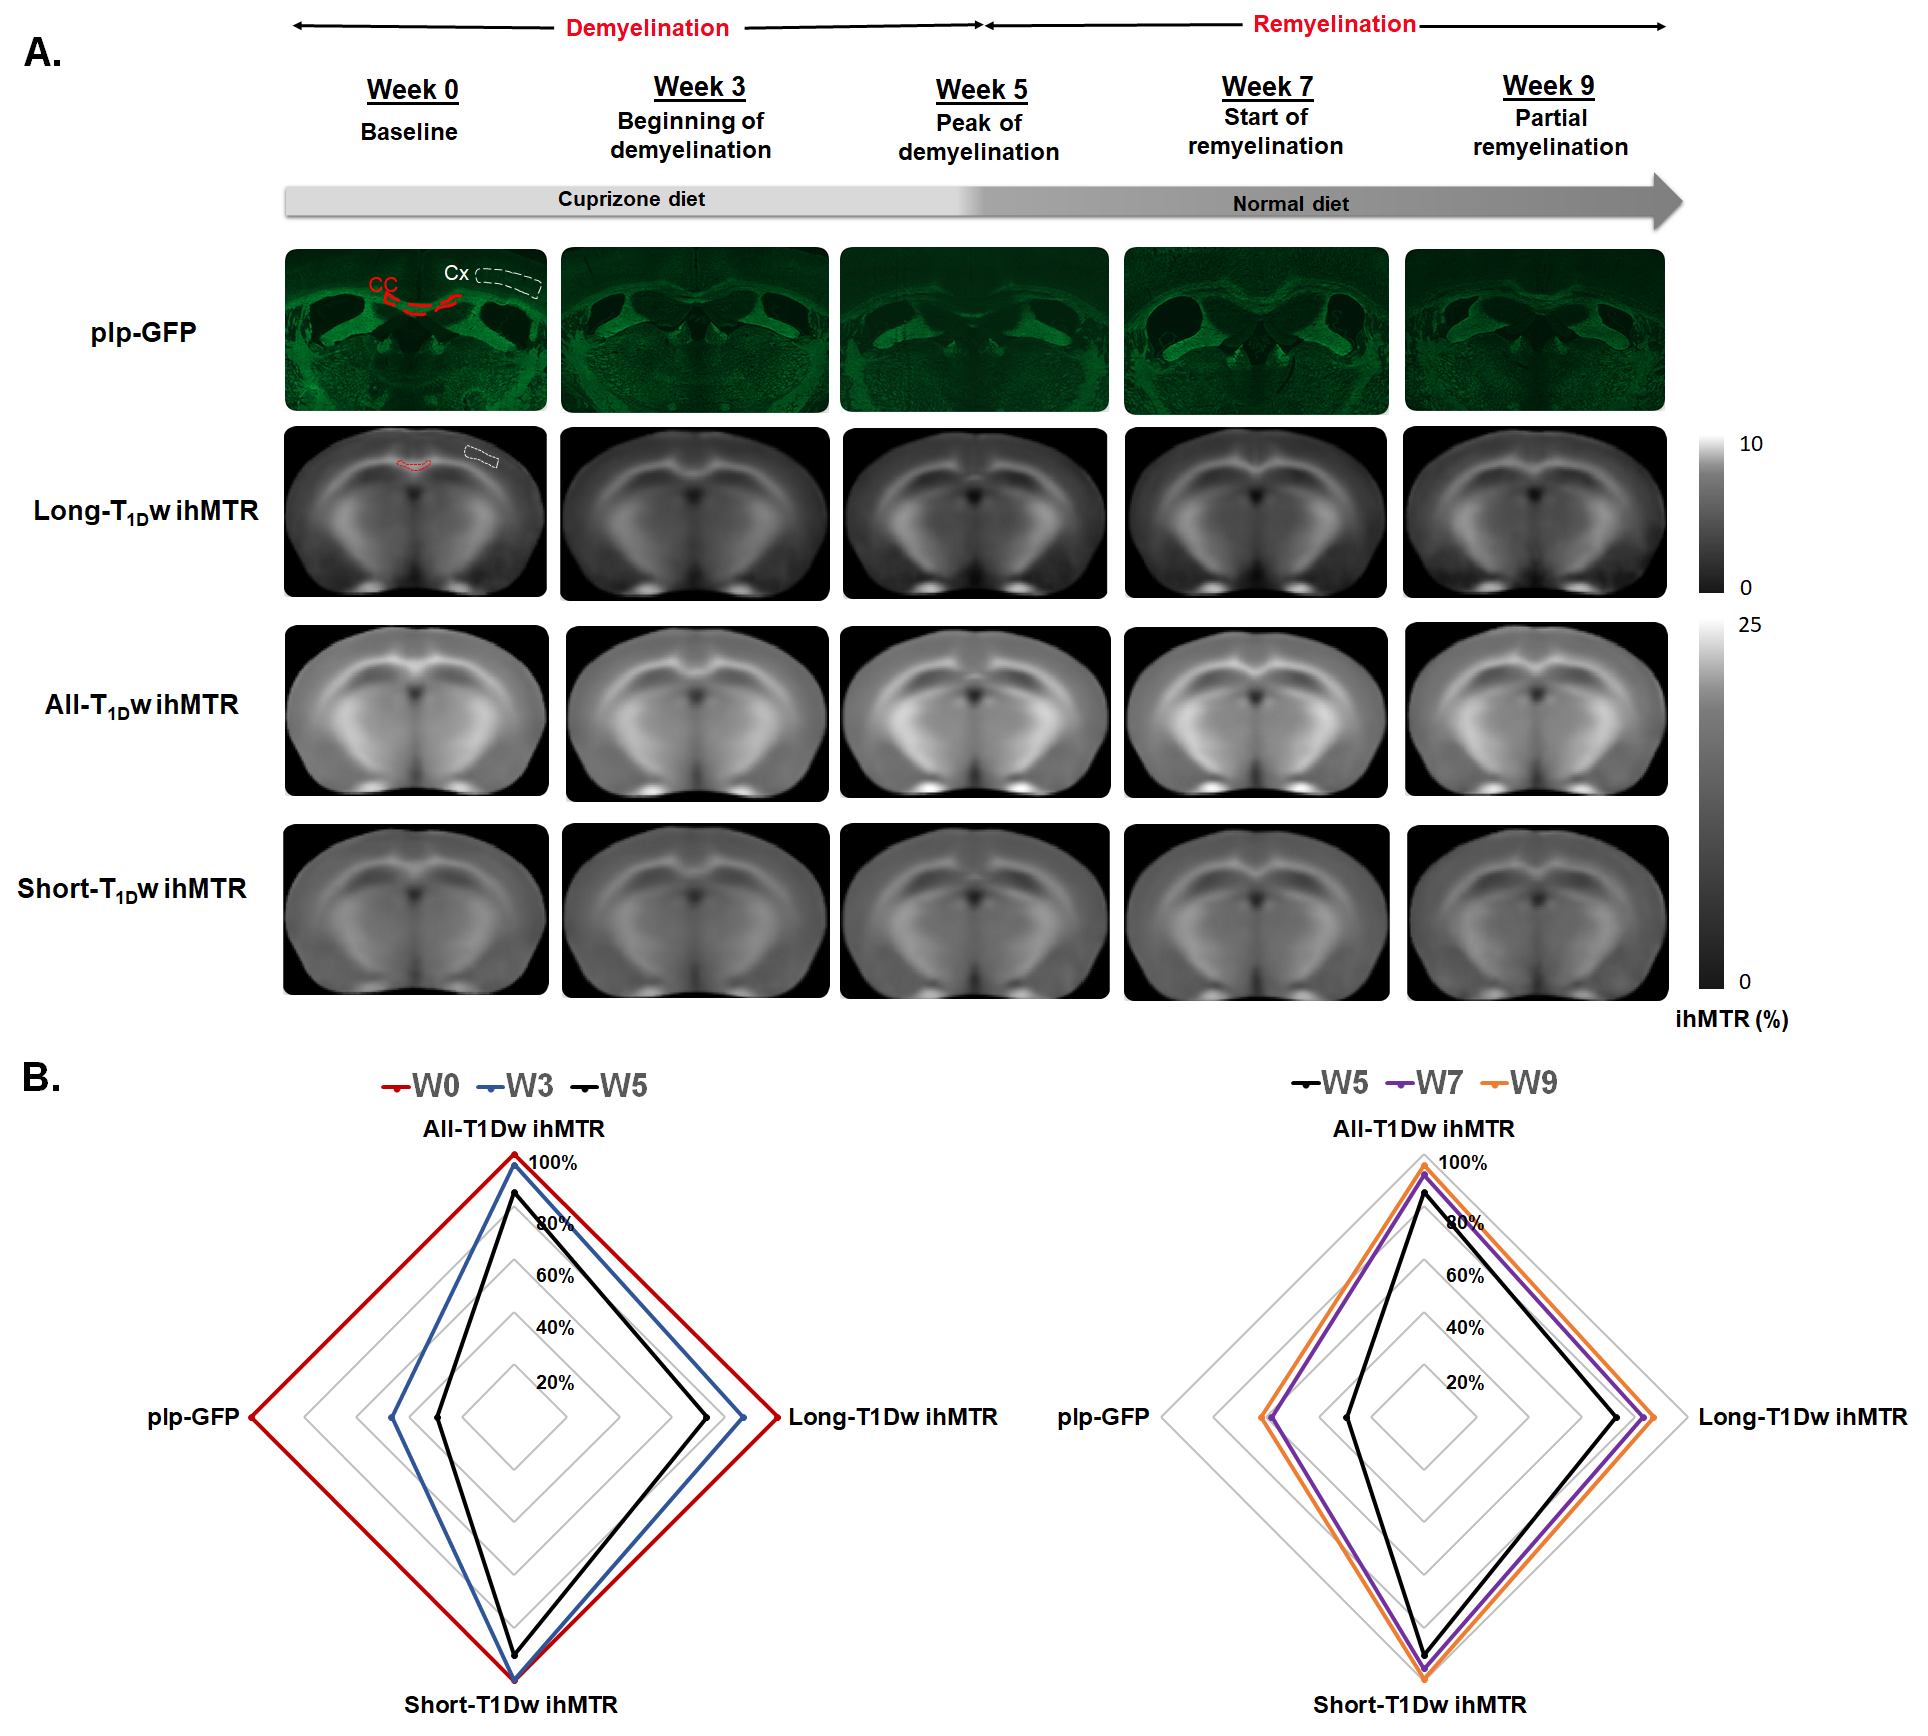
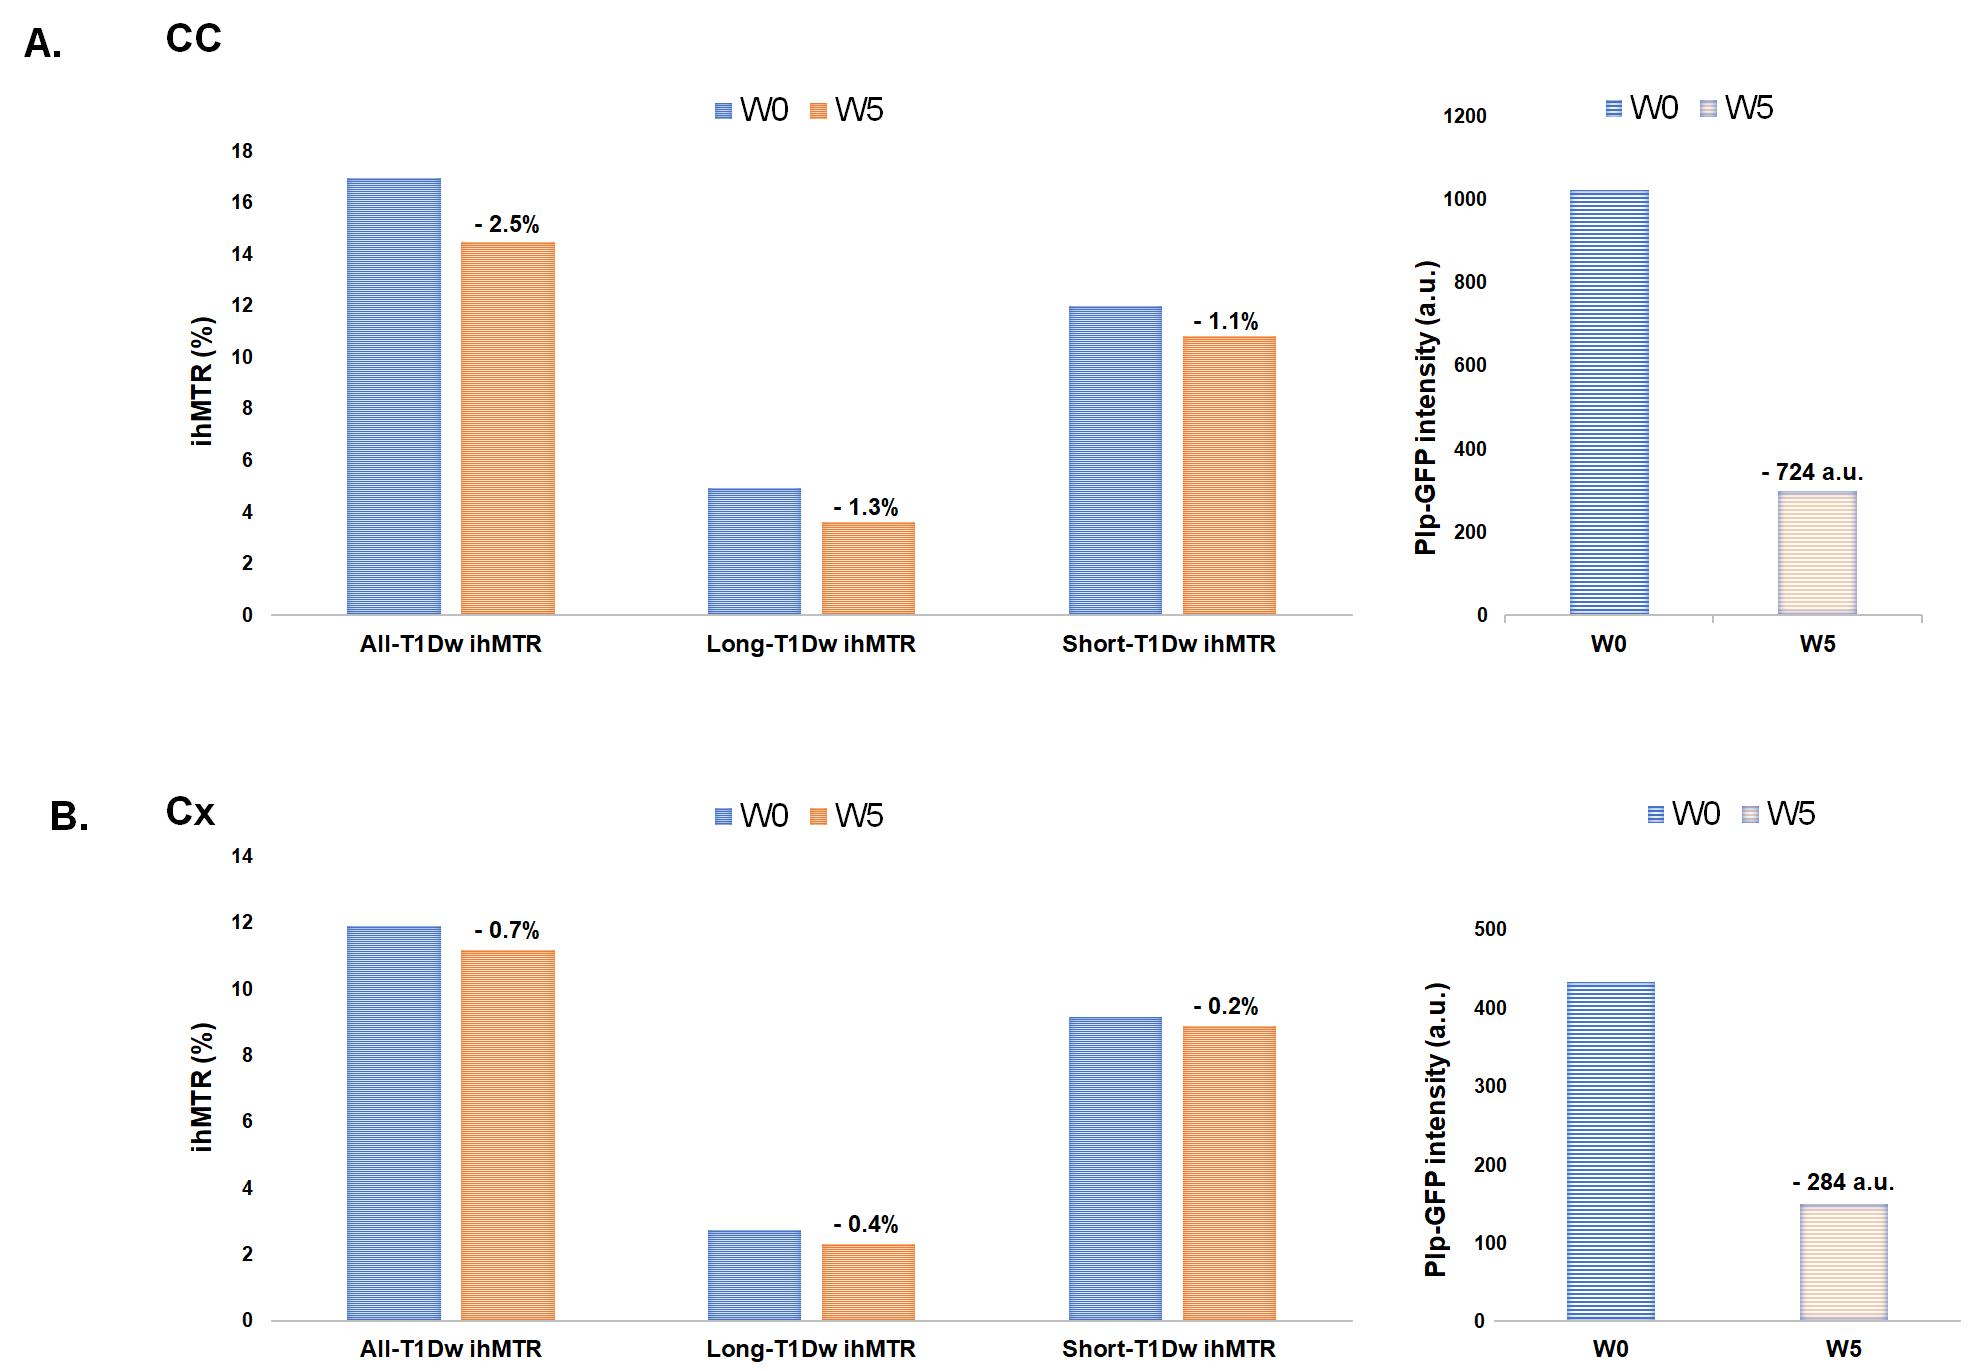
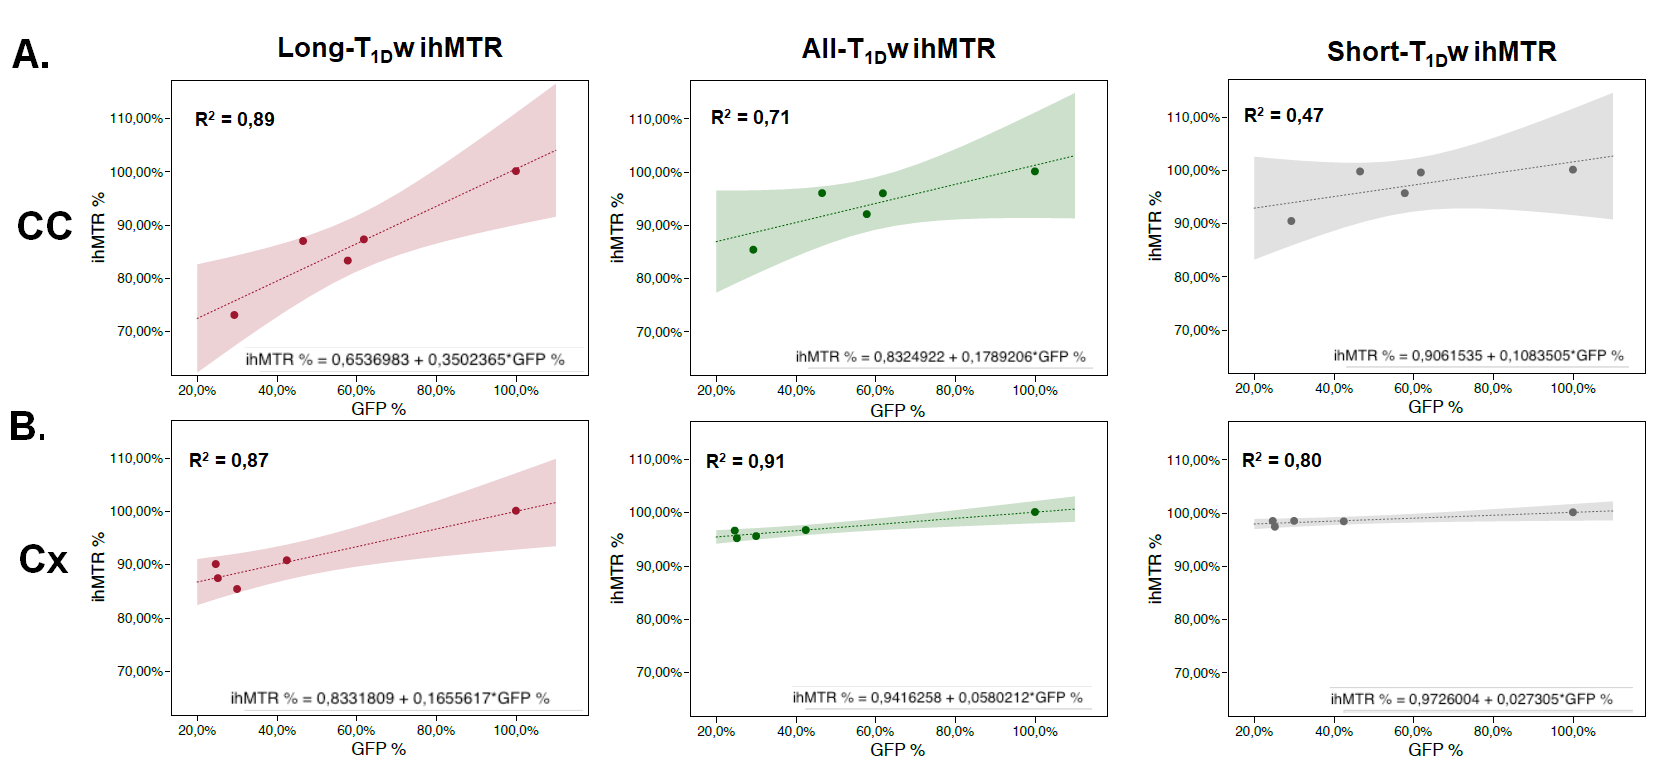
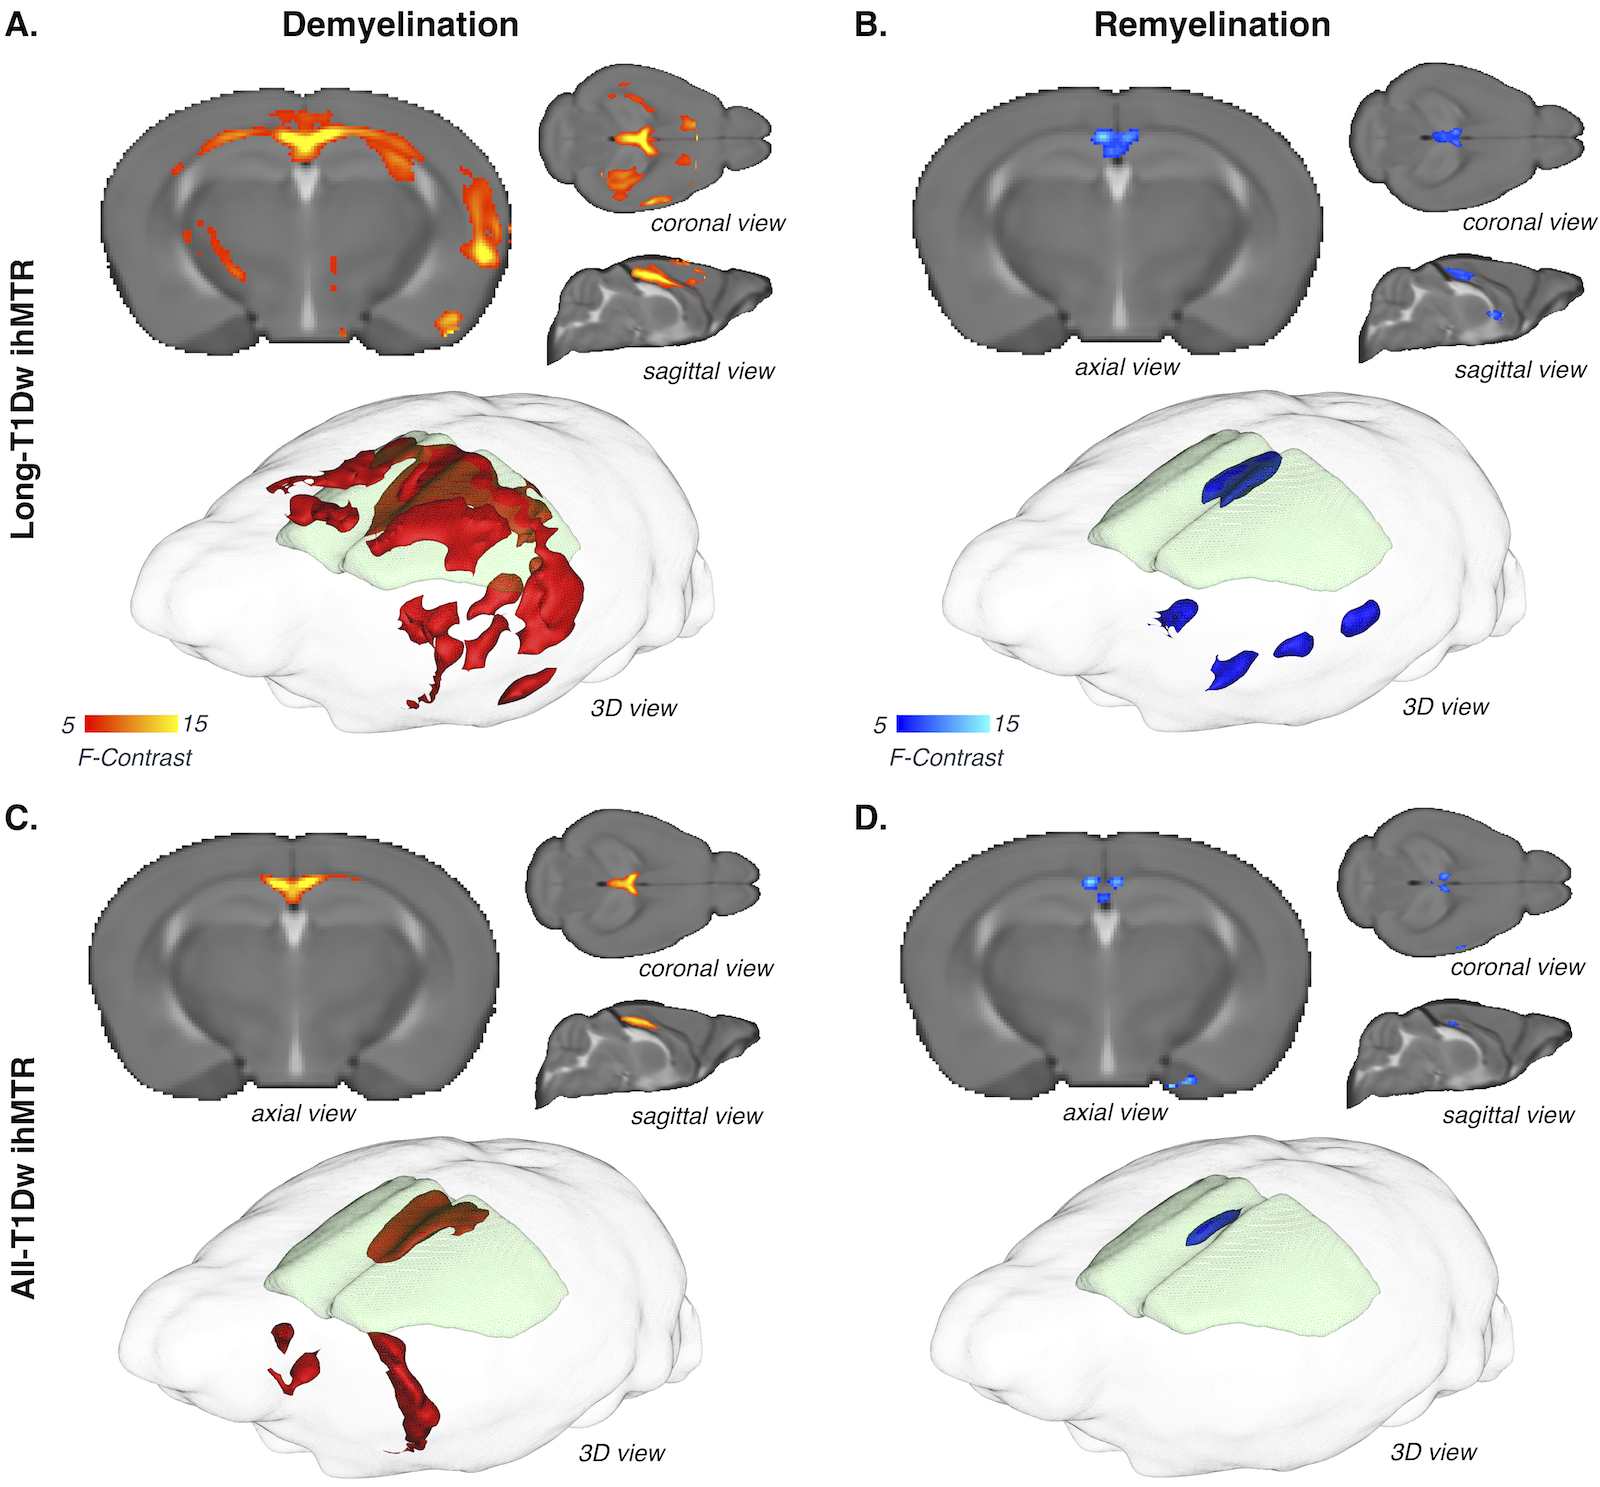
As shown in images of Fig.2A, and particularly evidenced in the CC (Fig.2B), the temporal dynamics of All-T1Dw ihMTR, Long-T1Dw ihMTR, and Short-T1Dw ihMTR and GFP show similar tendencies: following a decrease from W0 to W5, ihMTRs and GFP signals increased after interruption of the cuprizone diet tending toward a partial recovery at W9. Fig.3 compares the variations (in absolute units) of ihMTR values and the GFP signal between W0 and W5, the peak of demyelination. The largest decrease (-2.5%) obtained for All-T1Dw ihMTR indicates a higher sensitivity to alterations occurring during the demyelination phase. Conversely, ihMTR weighted towards long T1D values relates more specifically myelin content in the cuprizone model, as indicated by the stronger correlations with GFP obtained for Long-T1Dw ihMTR compared to that of All-T1Dw ihMTR and Short-T1Dw ihMTR (Fig. 4). More generally, the loss of myelin specificity observed when short-T1D components contribute to the ihMTR values (Fig.4A and Fig.2B W0 versus W3) is an interesting observation, which warrants further investigation. Finally, Figure 5 summarizes the results of the SPM analysis, showing significant clusters of ihMTR variations (F-contrast, p < 0.001) in the whole brain for the demyelinating (W0-W3-W5) and remyelinating (W5-W7-W9) phases of the cuprizone model. This analysis illustrates the potential of 3D ihMT MRI for characterizing spatially and longitudinally demyelination.Conclusion
A comparative study between ihMTR and GFP intensity on the cuprizone mouse model allowed exploring the sensitivity and the specificity of ihMT to demyelination/remyelination processes with the help of a multi T1D-weighted ihMT approach.Acknowledgements
This work was performed by a laboratory member of France Life Imaging network (grant ANR‐17‐ CE18‐0030, VERISMO project).References
1. G. Varma, et al., Magnetization Transfer from Inhomogeneously Broadened Lines: A Potential Marker for Myelin, Magn Reson Med. 2015 February; 73(2): 614–622.
2. G. Varma, et al., Interpretation of magnetization transfer from inhomogeneously broadened lines (ihMT) in tissues as a dipolar order effect within motion restricted molecules. J Magn Reson. 2015 Nov; 260:67-76.
3. G. Duhamel, et al., Validating the sensitivity of inhomogeneous Magnetization Transfer (ihMT) MRI to myelin with fluorescence microscopy, NeuroImage, 199 (2019) 289-303.
4. V. Prevost, et al., Optimization of inhomogeneous magnetization transfer (ihMT) MRI contrast for preclinical studies using dipolar relaxation time (T1D) filtering. NMR Biom., vol 30, June 2017; e3706.
5. Stidworthy MF, Genoud S, Suter U, Mantei N, Franklin RJM. Quantifying the Early Stages of Remyelination Following Cuprizone-induced Demyelination. Brain Pathology 2003; 13(3): 329–339.
6. Steelman AJ, Thompson JP, Li J. Demyelination and remyelination in anatomically distinct regions of the corpus callosum following cuprizone intoxication. Neuroscience Research 2012; 72(1): 32–42.
7. Avants BB, Tustison N, Song G. Advanced Normalization Tools (ANTS). Insight J. 2 2009:1–35.
8. A.E. Dorr, et al, High resolution three-dimensional brain atlas using an average magnetic resonance image of 40 adult C57Bl/6J mice, NeuroImage, vol 42, Aug. 2008, pp. 60-69.
9. S. Mchinda, et al, Whole brain inhomogeneous magnetization transfer (ihMT) imaging: Sensitivity enhancement within a steady-state gradient echo sequence, Magn Reson Med. 2018 May;79(5):2607-2619.
Figures