0173
A Change in Membrane Potential Induces Measurable Changes in Relaxation Times1Laboratory for Imaging Science and Technology, Department of Electrical and Computer Engineering, Seoul National University, Seoul, Korea, Republic of, 2Department of Biomedical Engineering, Sungkyunkwan University, Suwon, Korea, Republic of, 3Center for Neuroscience Imaging Research, Institute for Basic Science, Suwon, Korea, Republic of, 4Department of Physiology, Samsung Biomedical Research Institute, Sungkyunkwan University School of Medicine, Suwon, Korea, Republic of
Synopsis
In this study, the effects of membrane potential on T1 and T2 were examined using Jurkat T lymphocytes. We applied tetraethylammonium ion (TEA) to depolarize Jurkat cell membrane potential. Significant changes in T1 and T2, which were measured to be -10.39 ms/mM and 0.920 ms/mM, respectively, were observed. One potential explanation for the changes of T1 and T2 is the depolarization of membrane potential, while the underlying mechanism needs to be explored. Further studies are expected to utilize the membrane potential as a new contrast mechanism for MRI.
Introduction
Direct detection of neuronal activity in MRI has the potential to provide better spatiotemporal localization of neuronal activity than conventional fMRI which utilizes hemodynamic response. While it has been studied by many groups, most works focused on the locally induced magnetic field by the neuronal current.1-3 Recently, studies by Lee et al.4 and Phan et al.5 demonstrated that a line-scanning FLASH sequence with a very high temporal resolution (~5 ms) enables direct detection of neuronal activity. While the contrast mechanism is not fully elucidated, the authors suggested that T1 and/or T2 change during action potential might be responsible for these observations. This study aims to investigate the changes in T1 and/or T2 could be explained by the change in the cell membrane potential.Method
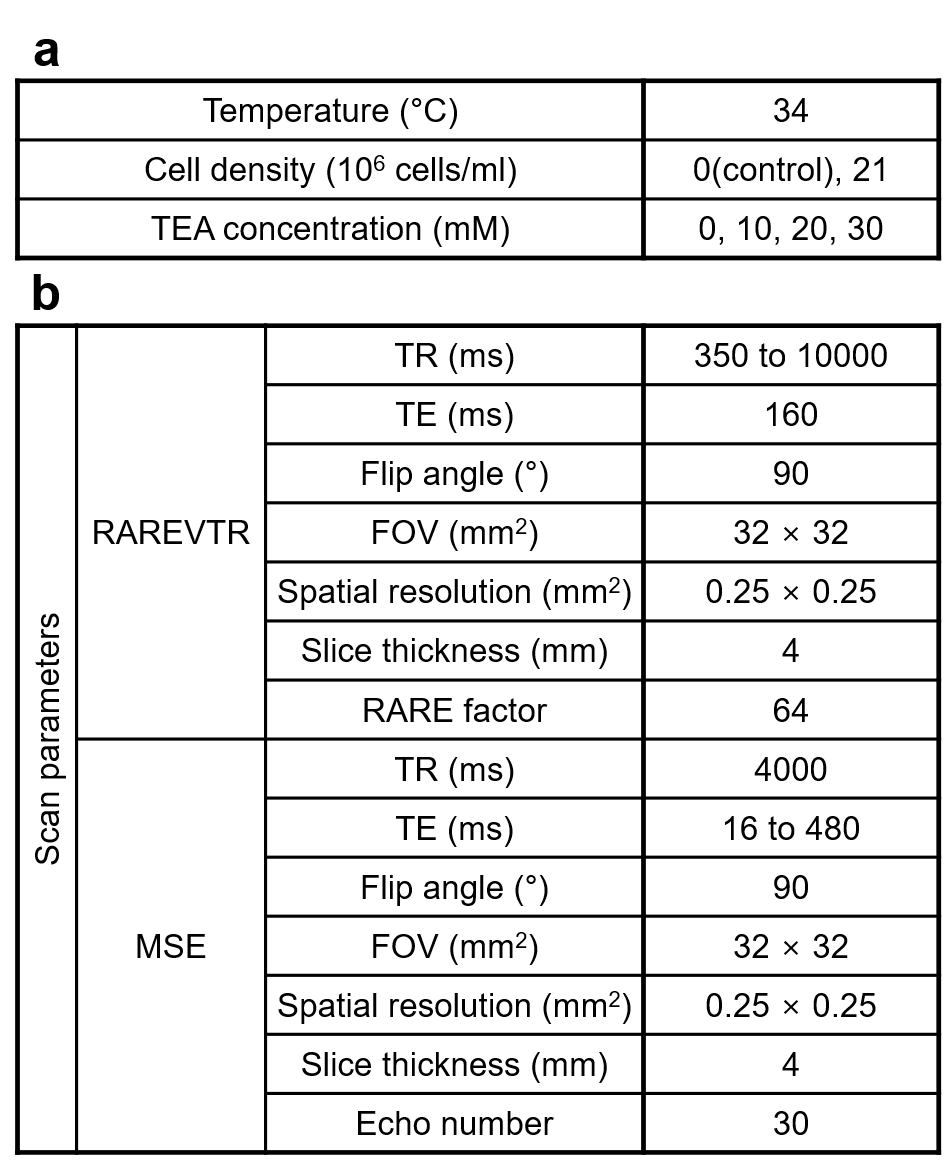
Cell culture preparation. We used Jurkat cells (immortalized human T lymphocyte cells) as the experiment model. The Jurkat cells were cultured in RPMI 1640 medium with 10% fetal bovine serum and 1% penicillin/streptomycin (denoted as RPMI medium hereafter) at 37 °C and 5% CO2 in the air. Immediately before MRI acquisition, the cell density of the suspension was adjusted to 2.1 × 10⁷ cells/ml.Resting potential manipulation. We applied a few concentrations of tetraethylammonium ion (TEA; i.e., 0, 10, 20, 30 mM) on the Jurkat cell suspension to depolarize the membrane potential of Jurkat cells. For a control test, the RPMI media of the same TEA concentrations were prepared, assessing the effect of TEA on T1 and/or T2 change. The cell suspensions were kept at a stable temperature of 34 °C in the MRI scanner. The experimental specifications are detailed in Fig. 1a.
MRI acquisition and analysis. Experiments were performed on a Bruker 9.4 T animal MRI scanner. For T1 estimation, a RARE sequence with varying TR was used. Voxel-wise T1 values were obtained by fitting magnitude data to a mono-exponential recovery function. For T2 estimation, a multi-echo spin-echo sequence was used. Voxel-wise T2 values were obtained by fitting magnitude data to an extended phase graph (EPG) corrected6 exponential decay curve. Fig. 1b lists all the relevant scan parameters. The regions of interest (ROIs) were set as circles at the center of each tube containing Jurkat cell suspension or RPMI medium. Since there is no available theoretical prediction of the relationship between the relaxation times and TEA concentration, the linear fitting was performed.
Results
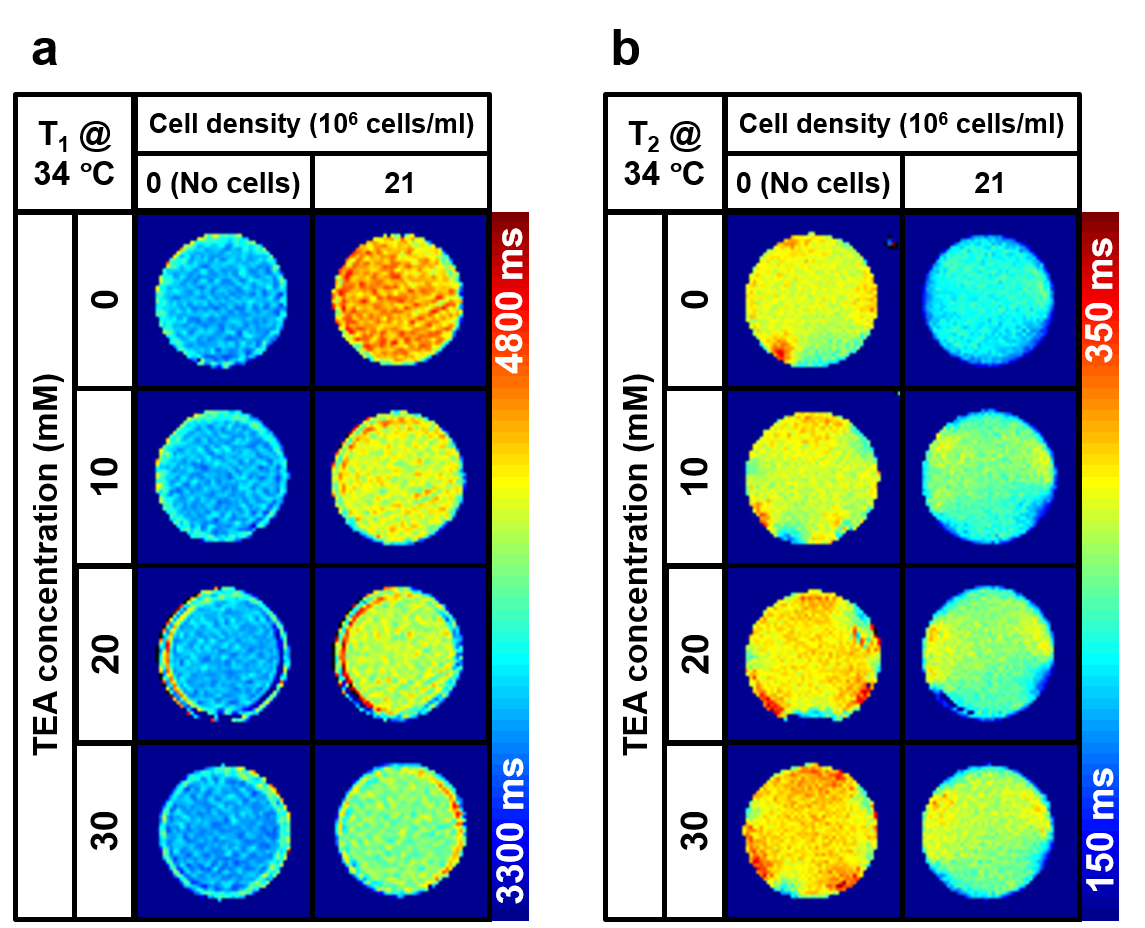
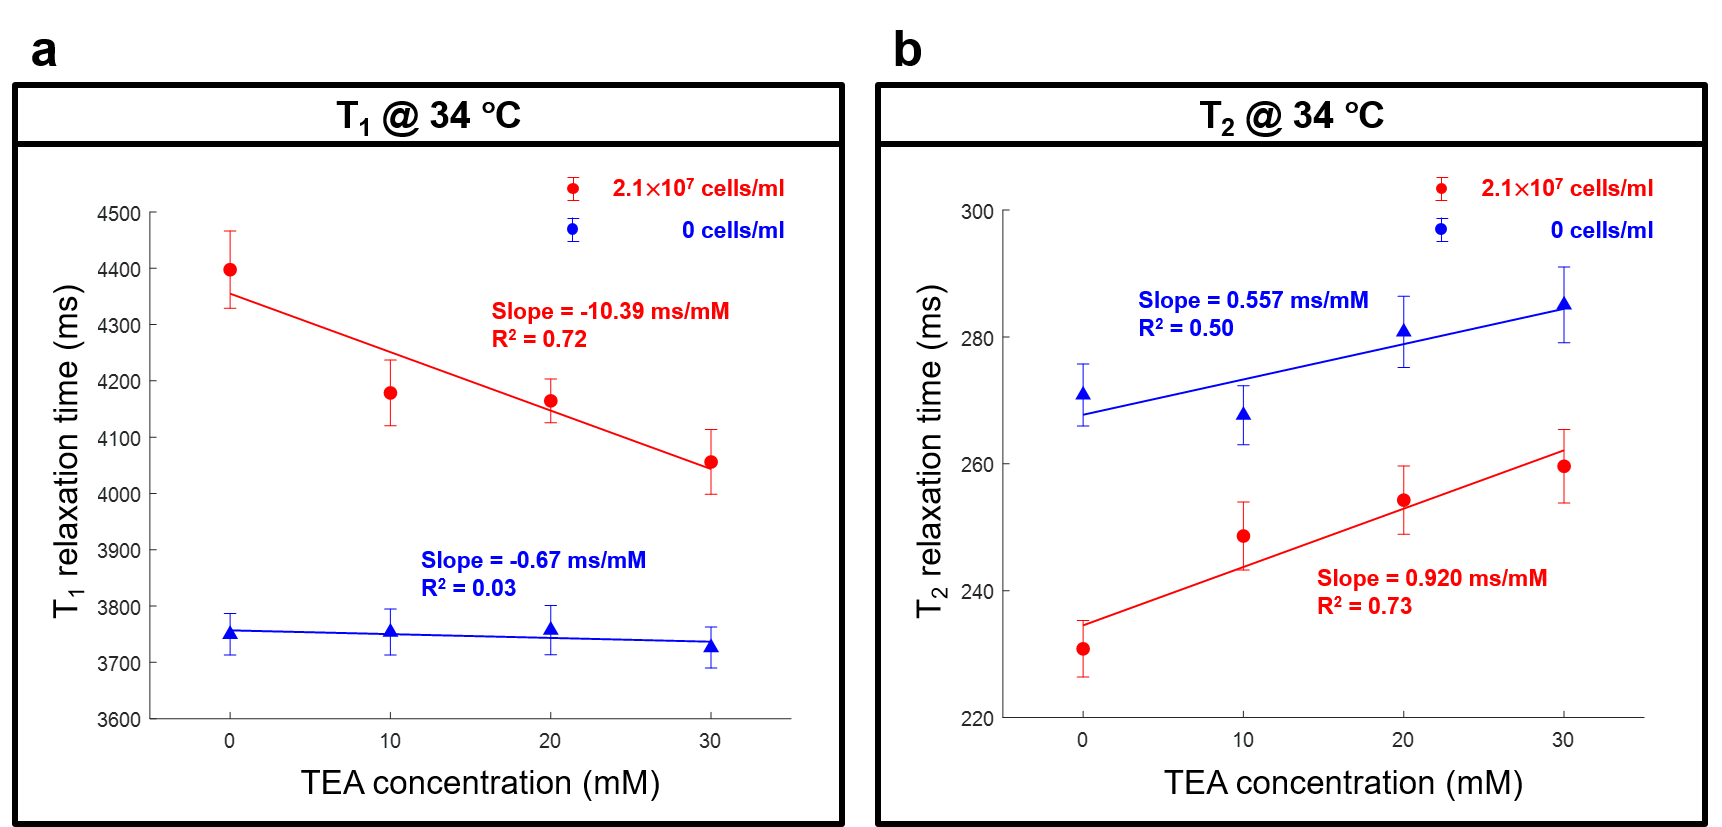
T1 and T2 maps at varying TEA concentrations from 0 to 30 mM were displayed in Figs. 2a and b. Their averages and standard deviations in the ROIs were presented in Figs. 3a and b. As shown in Fig. 3, T1 showed a negative linear correlation with TEA concentration (red line, R2 = 0.72, slope = -10.39 ms/mM), whereas T2 showed a positive linear correlation (red line, R2 = 0.73, slope = 0.920 ms/mM). In the case of the RPMI medium itself (blue lines), no significant change in T1 but a slight increase of T2 was observed (R2 = 0.50, slope = 0.557 ms/mM). The difference in the slopes of T2 versus TEA concentration was 0.363 ms/mM.Discussion
Relaxation times of the Jurkat cell suspension without TEA. The Jurkat cell suspension with no TEA had longer T1 and shorter T2 than the RPMI medium, implying that the addition of the Jurkat cells into the RPMI medium increased T1 but decreased T2. The increased T1 was somewhat counter-intuitive as the presence of cells might decrease T1 due to the interaction. This observation may indicate that the intracellular water of the Jurkat cells has longer T1 and shorter T2 than those of the RPMI medium.Interpretation of the TEA effects on the relaxation times. Our hypothesis for the results is that the depolarization of the membrane potential could result in decreased T1 and increased T2. According to the recent work by Tarun et al.7, a change in the membrane potential can induce a change in the amount of the membrane water molecules, which are anisotropically oriented by the membrane potential. If such a change of membrane water is measurable in MRI, it could be measured in terms of the relaxation times. Another possibility is osmosis, which would act to cause the net efflux of the intracellular water to the extracellular medium, resulting in decreased T1 and increased T2.
Conclusion
The motivation of this study was to examine the effects of the cell membrane potential on the relaxation times. According to our study, a significant change in T1 and T2 of the Jurkat cell suspension was observed when TEA was applied to the cell suspension. A further study is warranted for elucidating the underlying mechanism of the relaxation-time change due to the depolarization of the membrane. It is expected that the new contrast mechanism introduced here, which seems to be related to the membrane potential, might open up a new opportunity for functional MRI that allows direct detection of the neuronal activity with a high spatial and temporal resolution.Acknowledgements
This research was supported by the Brain Research Program through the National Research Foundation of Korea (NRF) funded by the Ministry of Science, ICT & Future Planning (NRF-2019M3C7A1031993, NRF-2019M3C7A1031994).
This work was supported by the Brain Korea 21 Plus Project in 2019.
References
1. Petridou, N., Plenz, D., Silva, A. C., Loew, M., Bodurka, J., & Bandettini, P. A. (2006). Direct magnetic resonance detection of neuronal electrical activity. Proceedings of the National Academy of Sciences, 103(43), 16015-16020.
2. Luo, Q., Lu, H., Lu, H., Senseman, D., Worsley, K., Yang, Y., & Gao, J. H. (2009). Physiologically evoked neuronal current MRI in a bloodless turtle brain: detectable or not?. Neuroimage, 47(4), 1268-1276.
3. Sundaram, P., Nummenmaa, A., Wells, W., Orbach, D., Orringer, D., Mulkern, R., & Okada, Y. (2016). Direct neural current imaging in an intact cerebellum with magnetic resonance imaging. Neuroimage, 132, 477-490.
4. Lee, J.-T., Lee, S.-K. & Park, J.-Y. (2018). A Novel Method for Direct Detection and Spatial Mapping of Neuronal Activity. Proceedings of the International Society for Magnetic Resonance in Medicine, 26, 0703.
5. Toi, P. T., Lee, H., Lee, J.-T., Lee, S.-K. & Park, J.-Y. (2019). Progress towards direct in-vivo detection and mapping of neuronal activity. Proceedings of the International Society for Magnetic Resonance in Medicine, 27, 2991.
6. McPhee, K. C., & Wilman, A. H. (2017). Transverse relaxation and flip angle mapping: evaluation of simultaneous and independent methods using multiple spin echoes. Magnetic resonance in medicine, 77(5), 2057-2065.
7. Tarun, O. B., Hannesschläger, C., Pohl, P., & Roke, S. (2018). Label-free and charge-sensitive dynamic imaging of lipid membrane hydration on millisecond time scales. Proceedings of the National Academy of Sciences, 115(16), 4081-4086.
Figures