0166
Evolution of tumour mechanical properties under static preload as potential biomarker of solid stress1Laboratory of Biomarkers in Imaging, Center of Research on Inflammation, UMR 1149 Inserm-Université de Paris, Paris, France, 2Sanofi R&D, Vitry-sur-Seine, France, 3Department of Radiology, Beaujon University Hospital Paris Nord, Clichy, France
Synopsis
The purpose of this study was to assess in two different human liver tumours the correlation between tumour solid stress and changes of mechanical properties under preload. MR elastography acquisitions were performed at different pressure levels by externally compressing the tumour with an inflatable balloon. Reference values for tumour fluid pressure and solid stress were acquired with a catheterized pressure transducer. The results, obtained in two liver tumour types with largely different basal mechanical properties, show that the evolution of tumour elasticity under preload is correlated with the tumour solid stress and could be a potential biomarker of tumour pressure.
Introduction
High tumour pressure is associated with tumour aggressiveness and reduces the efficacy of chemotherapeutics agents and immunotherapy1-3. Total tumour pressure (TTP) is the sum of two components: the solid stress and the interstitial fluid pressure (IFP), each of which hinders drug delivery in different ways4, 5. Knowledge of pressure components could help improving treatment strategy, but can only be obtained by invasive methods. Recently, it has been observed that tumour mechanical properties increase when applying a pressure on the tumour6, reminiscent of the increase in solid stress encountered in spheroids undergoing external compression7. In this study, we aim to correlate in two different liver tumour types the solid stress and the changes of mechanical properties under static preload.Methods
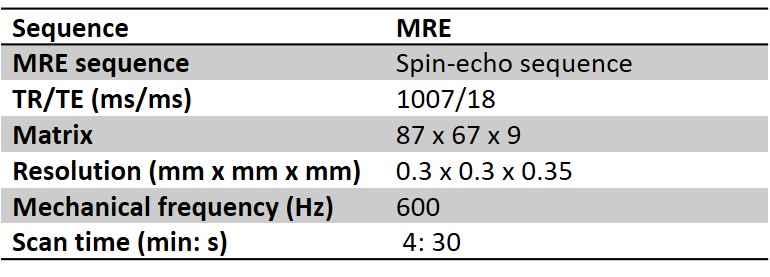
Acquisition: MRI examinations were performed in SCID mice with patient-derived hepatocellular carcinomas (HCC, n=19) or cholangiocarcinomas (CCA, n=10), which were implanted subcutaneously in the right flank. A 7T MRI scanner (Pharmascan, Bruker, Germany) with a volume resonator and 2 mm diameter receiver coil was used. Mechanical vibrations were generated with an uniaxial acoustic shaker and transmitted to the tumours via a rigid carbon fibre rod linked to a 3D-printed plastic insert. MRE acquisitions (Fig 1) were performed at basal level and under increasing pressure levels. A sensor placed in the balloon chamber allowed to measure the exerted pressures. The sensor was connected to a pressure transducer (MPXC7007GP, NXP, Eindhoven, The Netherlands) interfaced to an Arduino system (Arduino UNO R2, Ivrea, Italy). MRE acquisitions were performed at 600Hz in three spatial directions, with 4 times steps and with isotropic spatial resolution of 300 µm.MRI analysis: Maps of elasticity (G’) and viscosity (G’’) were obtained by inversion of the Helmholtz wave equation. The spatial-averaged mechanical properties were measured at each preload and compared to the pressure exerted by the balloon on the tumour. Then, the slope of the linear regression of the mechanical properties increase relative to the applied pressure was calculated for each mouse.
Tumour pressure measurements: Once the MR acquisitions were performed, the mice were placed outside the MR system and TTP was measured in the tumour centre using a catheter-mounted piezoelectric pressure transducer (SPR-1000 Mikro-Tip, Millar Instruments, Houston, USA). The IFP was also measured by covering the pressure catheter with a perforated 24-gauge rigid polytetrafluoroethylene sheath (Cole-Parmer, Vernon Hills, IL) to isolate the probe from the solid stress8. The solid stress was calculated by subtracting IFP from TTP.
Histology: Immediately after resection, the tumours were fixed in formalin for 24 hours and paraffin-embedded. Tissue sections of 5 µm were stained with DAPI to assess cellular density and with picrosirius red to assess collagen type I and III.
Statistical analysis: GraphPad Prism (GraphPad, La Jolla, CA) was used to perform statistical analysis, Mann-Whitney tests and Pearson correlations were used to compare different parameters and p < 0.05 was considered significant.
Results
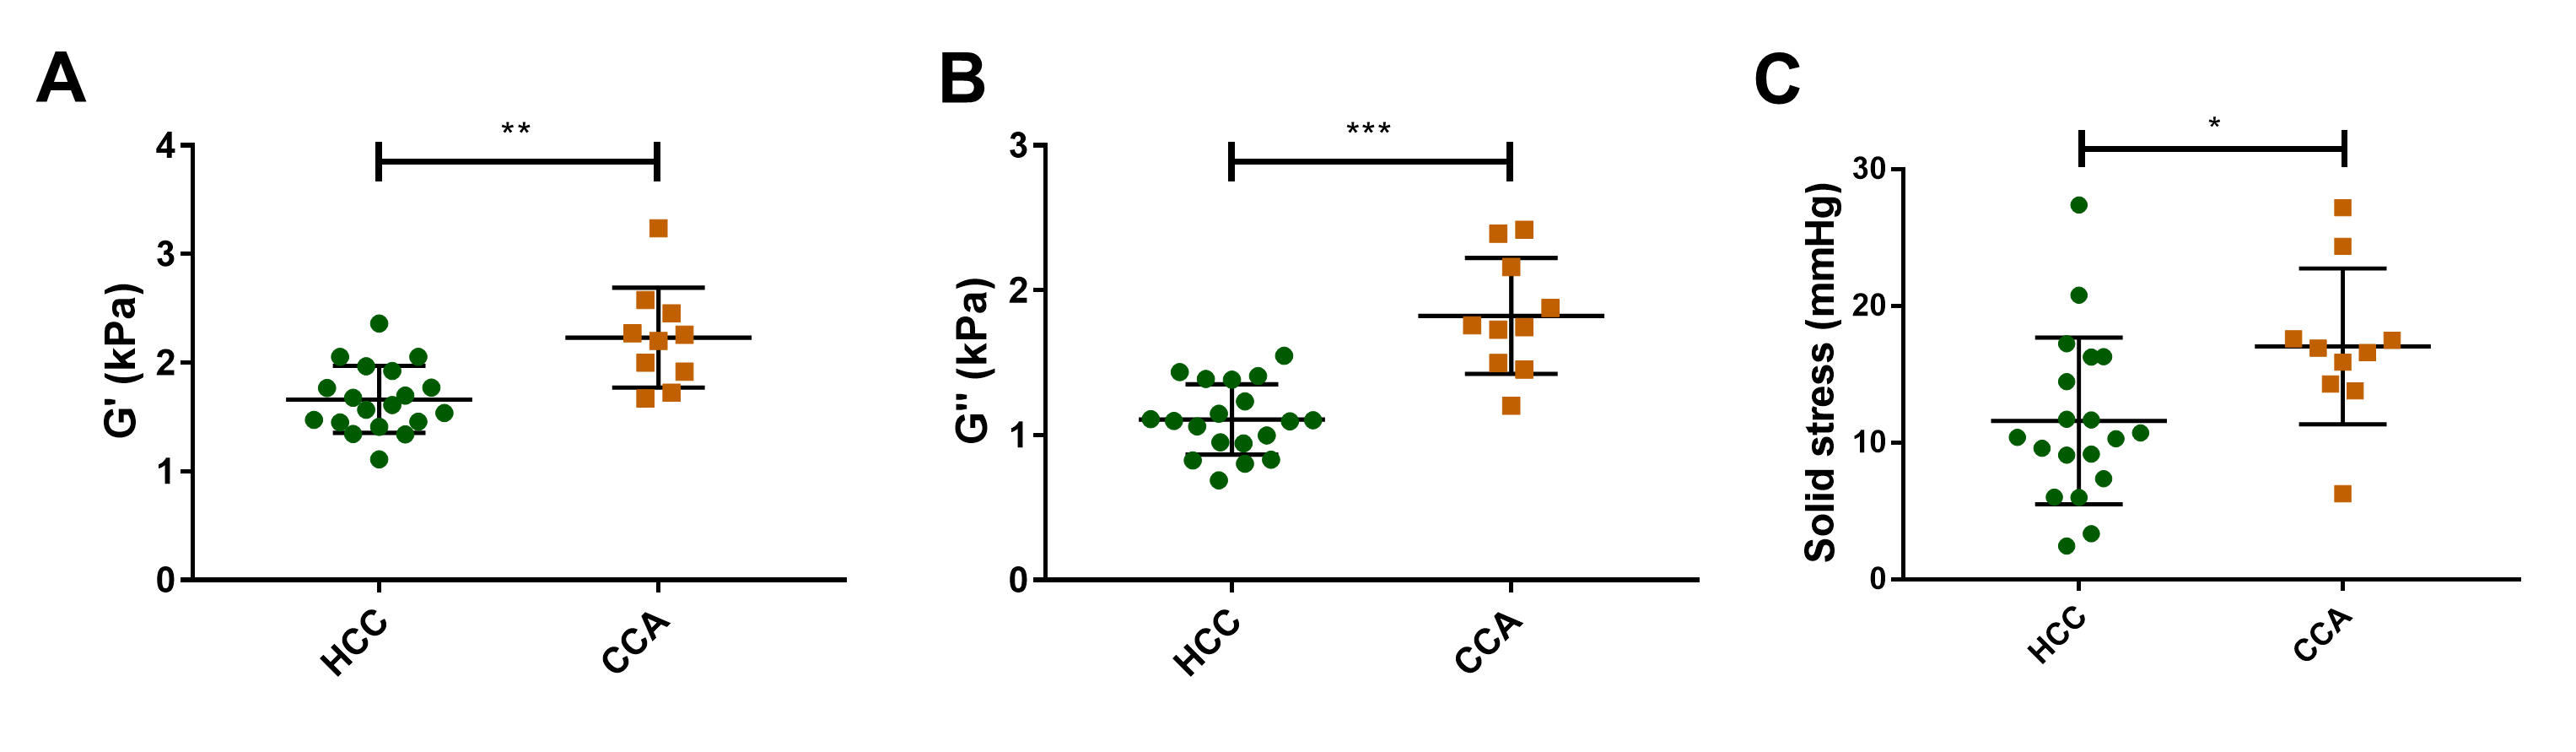
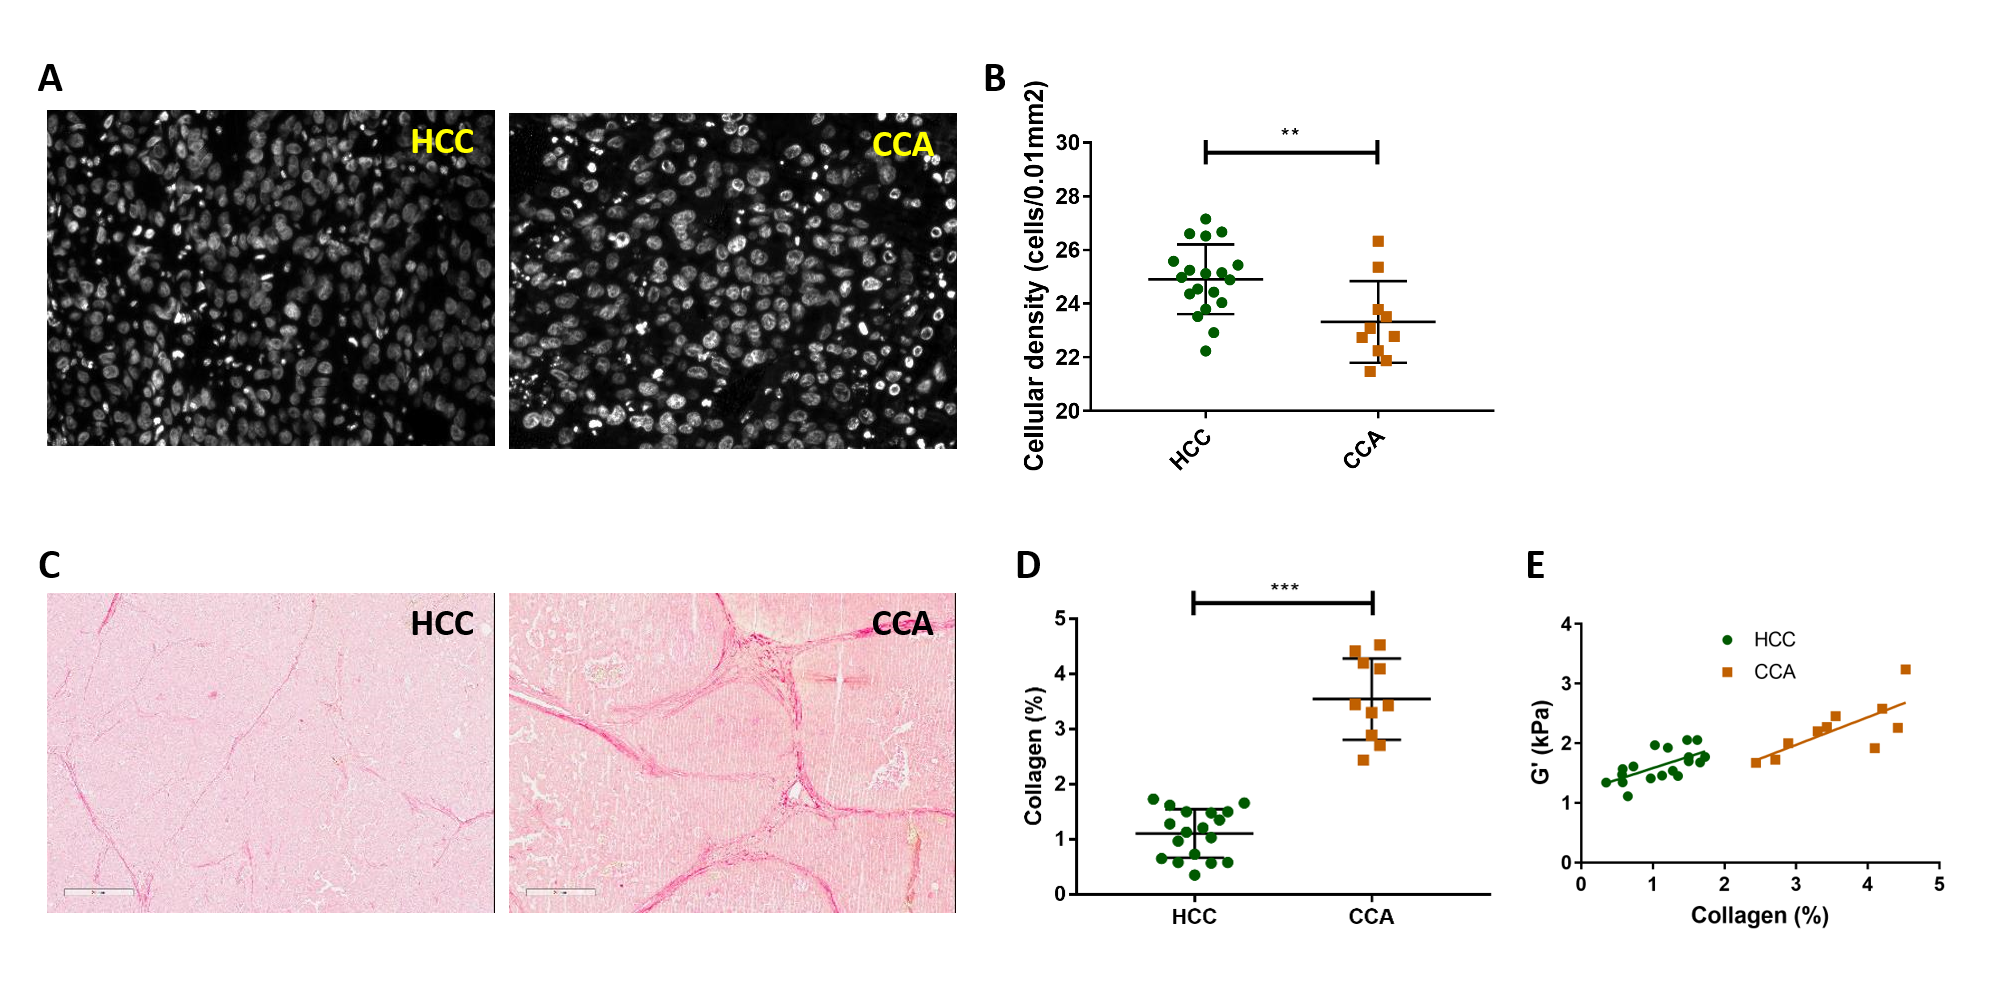
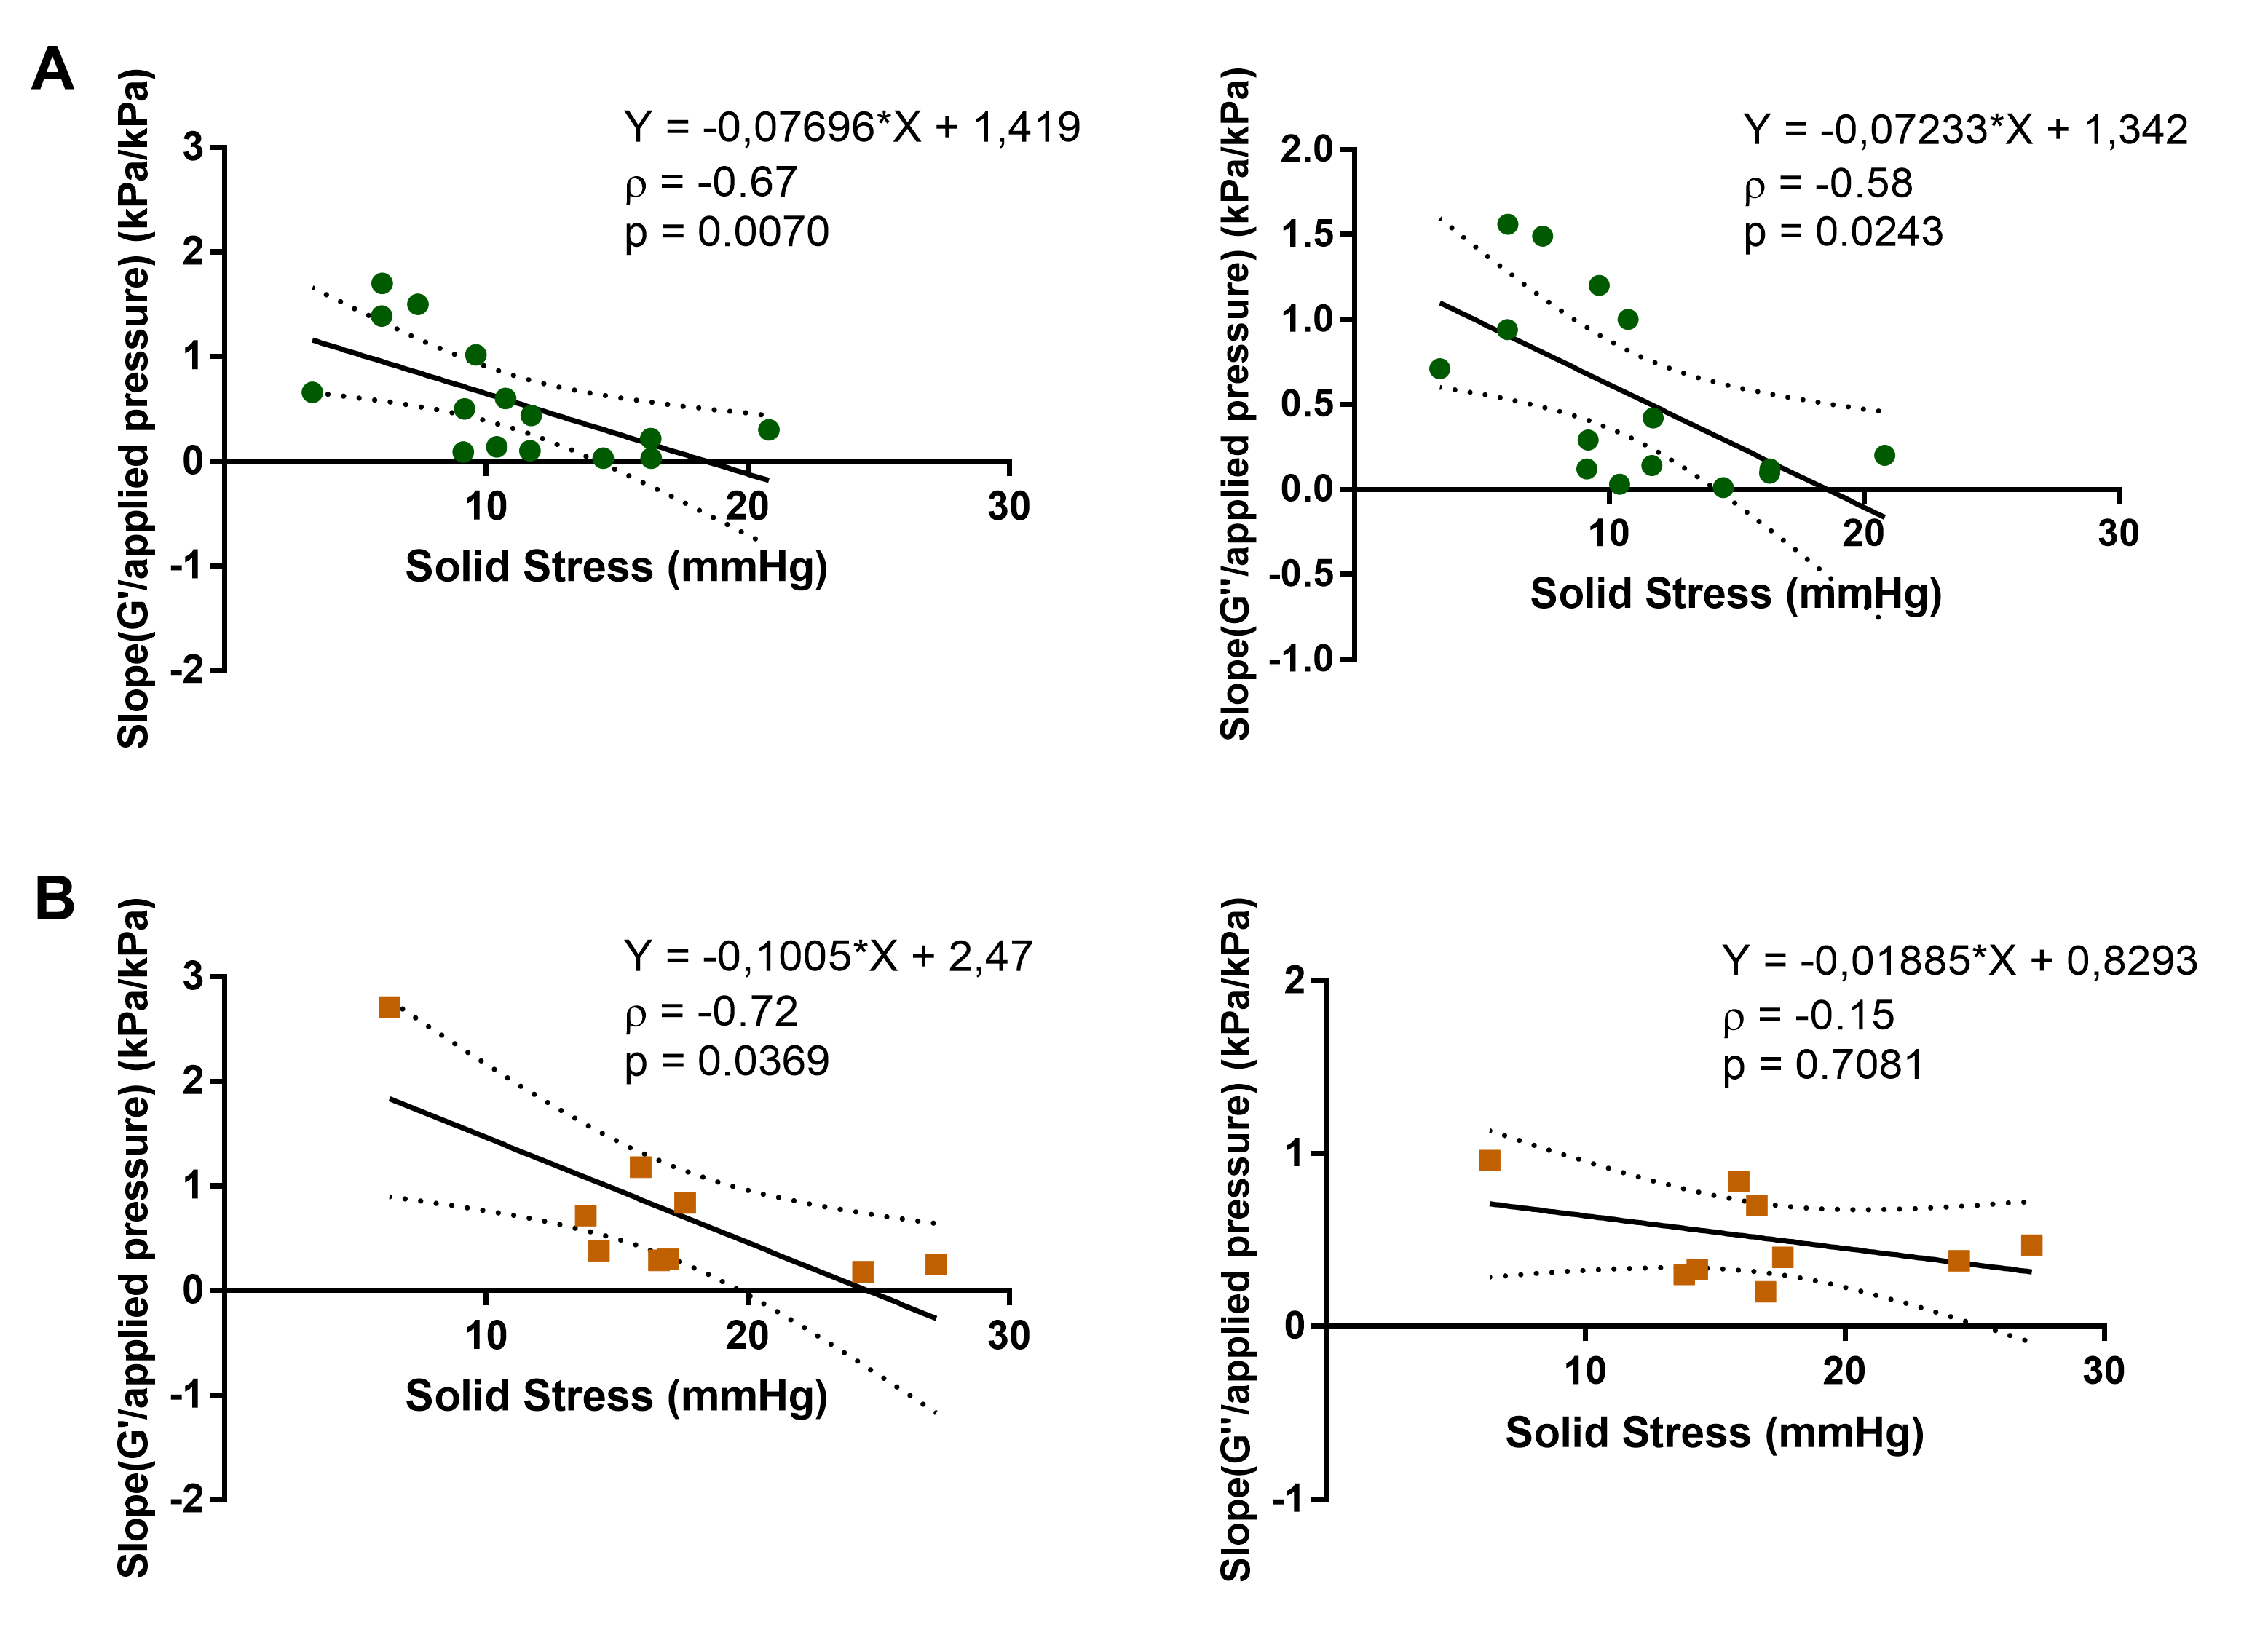
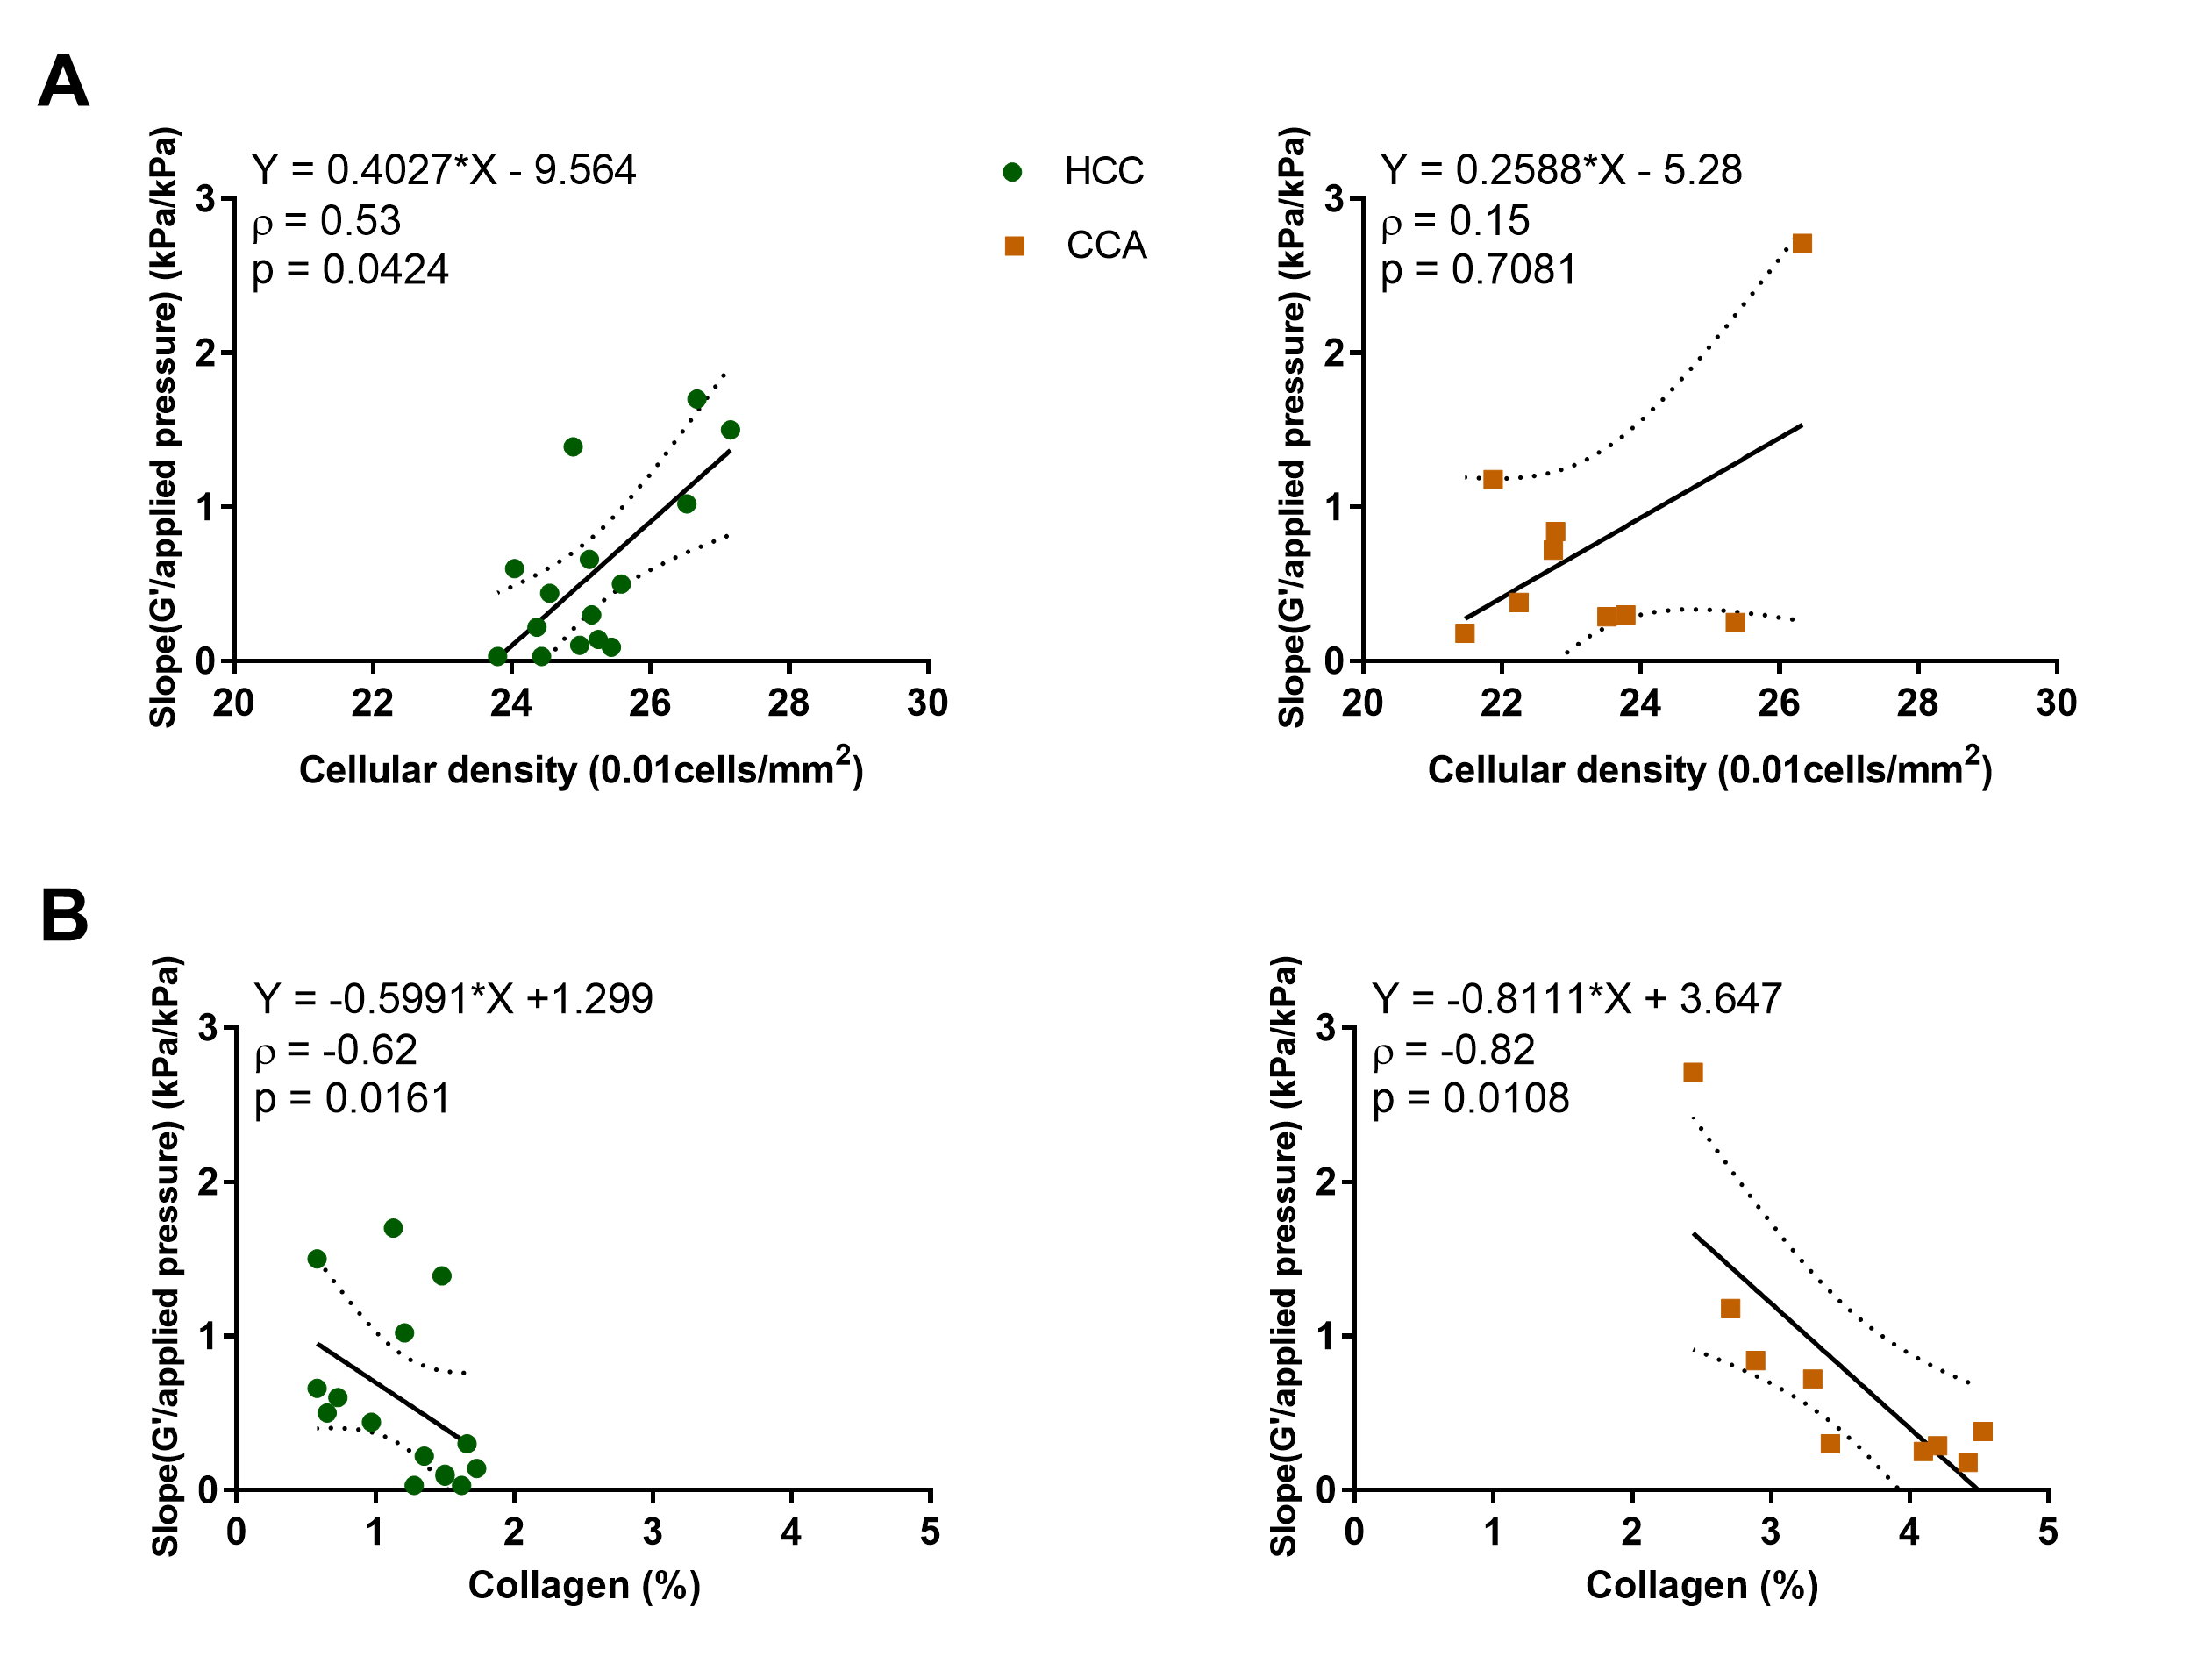
The tumour volume of HCC and CCA was similar (HCC: 772 ± 296 mm3, CCA: 832 ± 210 mm3, p = 0.5125). The mechanical properties were significantly higher in CCA than in HCC (G’: p = 0.0011, Fig 2.A; G’’: p < 0.0001, Fig 2.B). Similarly, the solid stress was significantly higher in CCA than in HCC (p = 0.0185, Fig 2.C). At histopathology, significant differences of cellular density (p = 0.0078, Fig 3.B) and collagen fraction (p < 0.0001, Fig 3.D) were observed between the tumour models. Moreover, tumour elasticity was correlated with collagen fraction across both tumour types. The slope of the linear regression between G’ and applied pressure was correlated with the solid stress measured at basal level in both tumours types, whereas the slope of G’’/applied pressure was only correlated with solid stress in the HCC tumour type (Fig 4). Regarding the histological parameters, the slope of G’/applied pressure was positively correlated with cellular density in HCC (Fig 5.A), while the slope of G’/applied pressure was negatively correlated with the collagen fraction in both tumour types (Fig 5.B).Discussion
Our results confirm that HCC and CCA present distinct mechanical properties9. The higher elasticity in CCA can be explained by its higher collagen fraction10. At basal level, tumour mechanical properties and solid stress are two distinct biomechanical properties11, hence assessment of mechanical parameters alone cannot be used as a proxy for solid stress. However, our results suggest that assessing the evolution of elasticity under static preload can provide information on tumour solid stress. Moreover, we observed that the inverse correlation between solid stress and increase of elasticity under pressure was similar in two tumours models despite their differing biomechanical properties at rest. This correlation can be explained by collagen content and cellular density which are related with solid stress4, 12 and influence the ability of G’ to increase under preload13.Conclusion
In conclusion, the results of our study suggest that in two liver tumour models presenting different mechanical properties and solid stress, assessing the changes in mechanical properties under static preload is a potential biomarker of tumour solid stress.Acknowledgements
This project has received funding from the European Union’s Horizon 2020 research and Innovation programme under grant agreement No 668039.
This work was performed by a laboratory member of France Life Imaging network (grant ANR-11-INBS-0006).
References
1. Mitchell MJ, Jain RK, Langer R. Engineering and physical sciences in oncology: challenges and opportunities. Nature Reviews Cancer 2017;17:659-675.
2. Padera TP, Stoll BR, Tooredman JB, et al. Pathology: cancer cells compress intratumour vessels. Nature 2004;427:695.
3. Jain RK. Normalizing tumor microenvironment to treat cancer: bench to bedside to biomarkers. Journal of Clinical Oncology: Official Journal of the American Society of Clinical Oncology 2013;31:2205-2218.
4. Chauhan VP, Martin JD, Liu H, et al. Angiotensin inhibition enhances drug delivery and potentiates chemotherapy by decompressing tumour blood vessels. Nat Commun 2013;4:2516.
5. DelGiorno KE, Carlson M, Osgood R, et al. Interstitial pressure and vascular collapse in pancreas cancer: fluids and solids, measurement and meaning. Cancer cell 2014;26:16-17.
6. Page G, Tardieu M, Besret L, et al. Assessing Tumor Mechanics by MR Elastography at Different Strain Levels. J Magn Reson Imaging 2019.
7. Dolega ME, Delarue M, Ingremeau F, et al. Cell-like pressure sensors reveal increase of mechanical stress towards the core of multicellular spheroids under compression. Nat Commun 2017;8:14056.
8. Nieskoski MD, Marra K, Gunn JR, et al. Separation of Solid Stress From Interstitial Fluid Pressure in Pancreas Cancer Correlates With Collagen Area Fraction. Journal of Biomechanical Engineering 2017;139.
9. Venkatesh SK, Yin M, Glockner JF, et al. MR elastography of liver tumors: preliminary results. AJR Am J Roentgenol 2008;190:1534-40.
10. Li J, Zormpas-Petridis K, Boult JKR, et al. Investigating the Contribution of Collagen to the Tumor Biomechanical Phenotype with Noninvasive Magnetic Resonance Elastography. Cancer Res 2019.
11. Nia HT, Liu H, Seano G, et al. Solid stress and elastic energy as measures of tumour mechanopathology. Nature Biomedical Engineering 2017;1:0004.
12. Cheng G, Tse J, Jain RK, et al. Micro-environmental mechanical stress controls tumor spheroid size and morphology by suppressing proliferation and inducing apoptosis in cancer cells. PLoS One 2009;4:e4632.
13. Perepelyuk M, Chin L, Cao X, et al. Normal and Fibrotic Rat Livers Demonstrate Shear Strain Softening and Compression Stiffening: A Model for Soft Tissue Mechanics. PLOS ONE 2016;11:e0146588.
Figures