0165
Preliminary application of Three-Dimensional Multifrequency MR Elastography for Chronic Kidney Disease1Department of Radiology, the Third Affiliated Hospital, Sun Yat-sen University, Guang Zhou, China, 2Department of Radiology, Mayo Clinic, Rochester, Micronesia, 3Department of Nephrology, the Third Affiliated Hospital, Sun Yat-sen University, Guang Zhou, China
Synopsis
Chronic kidney disease (CKD) is increasing in incidence and prevalence worldwide and early detection of CKD is a major challenge. MR elastography (MRE) is a noninvasive technique capable of quantifying the mechanical properties of tissue that has shown potential for assessing kidney diseases. MRE using 60-Hz and 90-Hz vibration frequencies can provide potential quantitative biomarkers for evaluating kidney function and biopsy score in CKD patients.
Introduction
Chronic kidney disease (CKD) related to hypoxia and fibrosis is increasing in incidence and prevalence worldwide. Early detection of CKD is a major challenge and having noninvasive medical imaging modalities sensitive to changes in renal function and anatomical fibrosis would benefit the clinical practice. MR elastography (MRE) has gained attention as a promising method to assess patients with diabetic nephropathy, kidney transplants, lupus nephritis and renal tumors(1-4), and these studies showed that the renal shear modulus depends on blood perfusion state and fibrosis of the kidney. The aim of this study is to assess the diagnostic performance of 3D multifrequency MRE for the evaluation of CKD.Methods
Following ethics committee approval with a waived informed consent requirement, 38 patients with CKD underwent renal MRI and 3D multifrequency MRE exams using a 3.0T MR system (Discovery MR750, GE Healthcare) before a renal biopsy procedure. The MRE passive pelvic-wall drivers were developed by Mayo Clinic, and multifrequency coronal MRE acquisitions with 60-Hz and 90-Hz vibration frequencies were performed. 10 patients were excluded due to the MRE scan being performed after the renal biopsy (n=2) and unsatisfactory MRE quality (n=8). Thus, 28 patients with CKD were enrolled in this study. Histology analysis in the 23 of 28 remaining patients was based on a uniform, semiquantitative approach to assessing change (including glomerulosclerosis, tubular atrophy, interstitial fibrosis, and arteriosclerosis) followed by biopsy grading between 1 and 4(5). The criteria for scoring and grading the chronic changes in renal tissue are described in more detail in Sethi et al(5). Renal function was determined using the estimated glomerular filtration rate (eGFR), which was calculated from blood creatinine levels using the Chronic Kidney Disease Epidemiology Collaboration equation(5). The total imaging time for MRE was about 64 seconds, performed in six 11-second breathe-holds and at the end of expiration. The acquisition parameters for MRE were as follows: single-shot, flow-compensated, spin-echo, echo-planar imaging pulse sequence; TR/TE = 1300/55.8ms; FOV = 36×36 cm; acquisition matrix = 96×96; number of excitations = 1; bandwidth = 250 kHz; number of slices = 32; slice thickness = 3.5 mm with 0.5-mm gap. Stiffness maps were obtained using a previously described direct inversion algorithm(6, 7) . The success of MRE was defined as the presence of visually detectable wave propagation in the kidneys. Renal regions of interest (ROIs) were drawn in the parenchyma of three consecutive slices centered on the hilum of the kidney. The diagnostic performance for the differentiation of CKD stage was assessed with the area under the receiver operating characteristic curve (AUROC). The relationship between the stiffness and kidney volume, CKD stage and biopsy scores were analyzed by Pearson correlations. Statistical significance was defined as P<0.05.Results
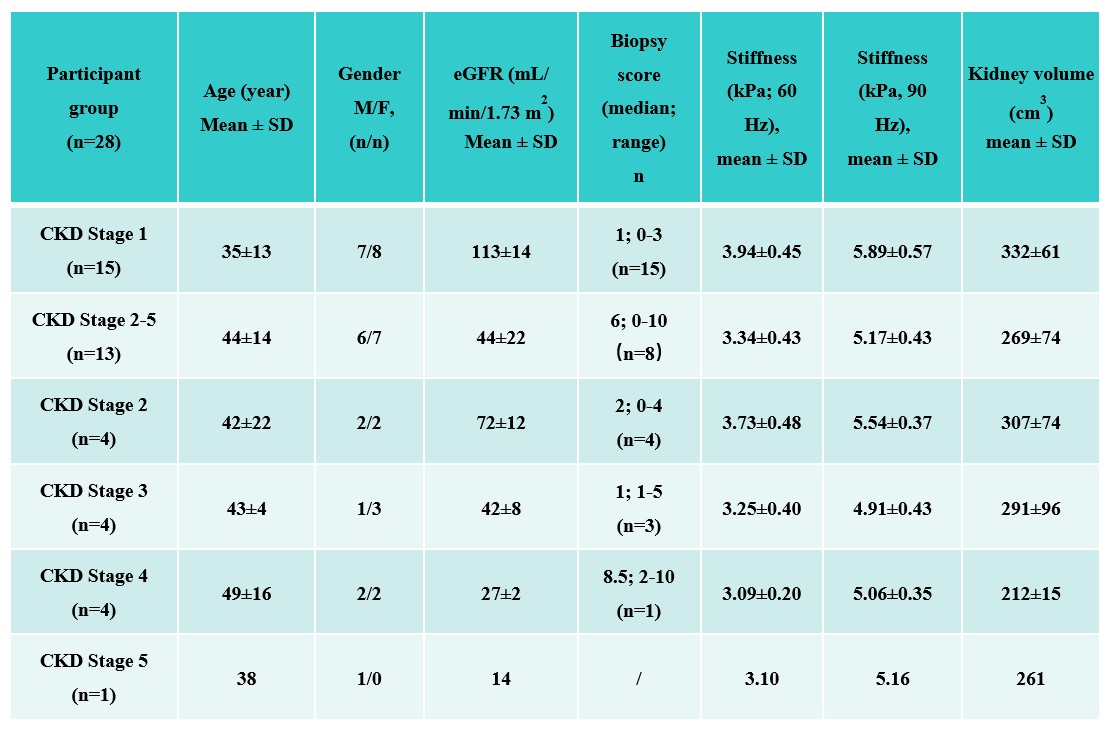
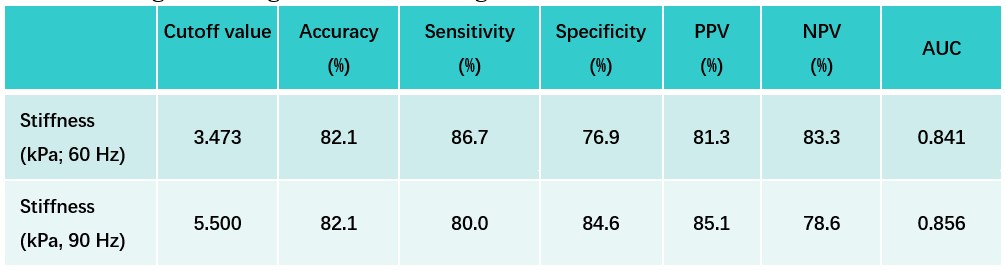
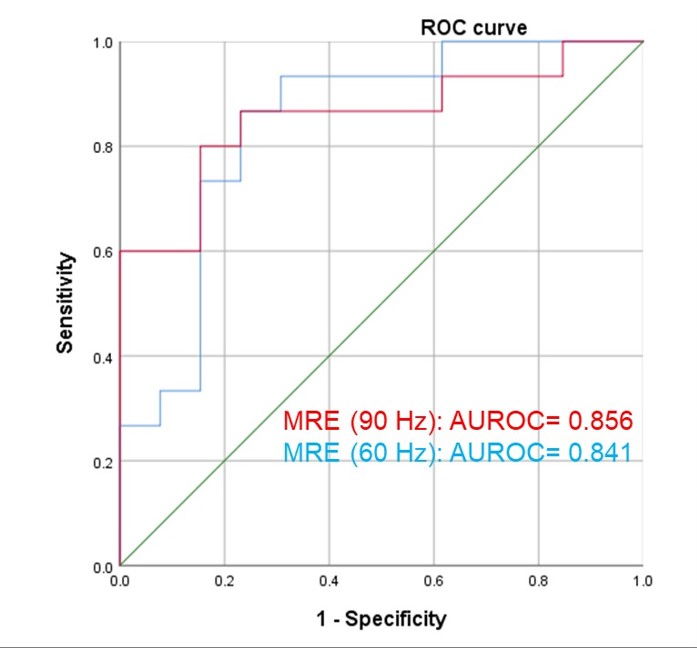
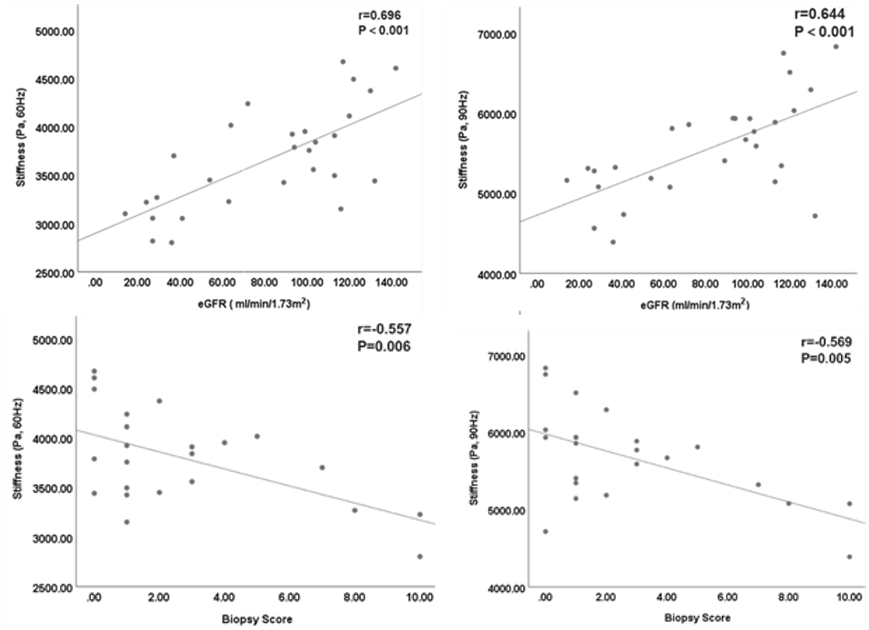
Baseline variables, including age, sex, eGFR, biopsy score, stiffness and kidney volume in the 28 CKD patients are shown in Table 1. The 60- and 90-Hz stiffness diagnostic values are shown in Table 2. The stiffness cutoff value at 60 Hz and 90 Hz for discriminating CKD stage 1 from CKD stages 2-5 was 3.473 kPa and 5.500 kPa with 82.1% and 82.1% accuracy, 86.7% and 80% sensitivity and 76.9% and 84.6% specificity, giving an AUROC of 0.841 and 0.856 (Figure 2). There was no significant difference between the diagnostic efficacy at 90 Hz and 60 Hz (P=0.83). MRE shear stiffness was positively correlated with eGFR levels (60 Hz, r=0.696, P<0.001; 90 Hz, r=0.644, P<0.001) (Figure 3), and was negatively correlated with biopsy score (60 Hz, r =-0.557, P =0.006; 90 Hz, r=-0.569, P=0.005) (Figure 3).Discussion
In this study, it was shown that kidney stiffness using 60-Hz and 90-Hz vibration frequencies can be used to evaluate kidney function at different CKD stages, and the stiffness was significantly correlated with eGFR and biopsy score in patients with CKD. The stiffness also decreased along with the progression of CKD. Possible explanations for these observations are that the stiffness reflects the lower perfusion and fibrosis in the renal tissue, and that the decreasing renal perfusion factor has more of a contribution to the observed renal stiffness than renal fibrosis in advanced-stage CKD. Further research is warranted to investigate the results.Conclusion
The results of our study showed that 3D MRE is a promising and useful technique for predicting kidney function and biopsy score.Acknowledgements
No acknowledgement found.References
1. Brown RS, Sun MRM, Stillman IE, et al. The utility of magnetic resonance imaging for noninvasive evaluation of diabetic nephropathy. Nephrol Dial Transplant 2019
2. Marticorena Garcia SR, Fischer T, Durr M, et al. Multifrequency Magnetic Resonance Elastography for the Assessment of Renal Allograft Function. Invest Radiol 2016;51(9):591-595
3. Marticorena Garcia SR, Grossmann M, Bruns A, et al. Tomoelastography Paired With T2* Magnetic Resonance Imaging Detects Lupus Nephritis With Normal Renal Function. Invest Radiol 2019;54(2):89-97
4. Prezzi D, Neji R, Kelly-Morland C, et al. Characterization of Small Renal Tumors With Magnetic Resonance Elastography: A Feasibility Study. Invest Radiol 2018;53(6):344-351
5. Sethi S, D'Agati VD, Nast CC, et al. A proposal for standardized grading of chronic changes in native kidney biopsy specimens. Kidney Int 2017;91(4):787-789
6. Shi Y, Glaser KJ, Venkatesh SK, et al. Feasibility of using 3D MR elastography to determine pancreatic stiffness in healthy volunteers. J Magn Reson Imaging 2015;41(2):369-375
7. Wang J, Shan Q, Liu Y, et al. 3D MR Elastography of Hepatocellular Carcinomas as a Potential Biomarker for Predicting Tumor Recurrence. J Magn Reson Imaging 2018
Figures