0161
Real-time MR elastography of the human brain reveals short-term cerebral autoregulation in response to the Valsalva maneuver.1Department of Radiology, Charité Universitätsmedizin Berlin, Berlin, Germany, 2Bernstein Center for Computational Neuroscience, Berlin, Germany, 3Institute of Medical Informatics, Berlin, Germany
Synopsis
Real-time MR elastography (rt-MRE) with 4.9Hz-frame rate was developed for in-vivo brain stiffness quantification during short-term tissue mechanical adaptation due to cerebral autoregulation. Six healthy participants performed a 15s-Valsalva maneuver with 50s recovery period following 10s resting period and 5s deep inspiration during continuous rt-MRE. 387 maps of tissue stiffness and fluidity were generated depicting a significant increase of stiffness due to Valsalva and an overshoot of stiffness by 3.4% fading out within 7s after the maneuver. rt-MRE is potentially sensitive to several diseases associated with cerebral autoregulation and reveals new insights into brain viscoelasticity changes on short time scales.
Introduction
Brain mechanical properties define the biophysical environment in which neurons grow and function. Recent research has revealed the tight link between blood flow and brain mechanical parameters including shear stiffness, viscosity and intracranial pressure1,2. However, the non-invasive quantification of cerebral viscoelastic properties by MR elastography (MRE) is time consuming and therefore limited in capturing short-term processes such as autoregulatory functions of the brain3. Real-time MRE (rt-MRE)4 was recently introduced for direct measurement of skeletal muscle function. We here adapt rt-MRE for viscoelasticity quantification of in-vivo human brain during cerebral autoregulation associated with the Valsalva maneuver (VM), where a voluntary abdominal force is applied during breath hold at inspiration5. This might provide a quantitative imaging marker of impaired cerebral autoregulation in a wide range of clinical applications.Methods
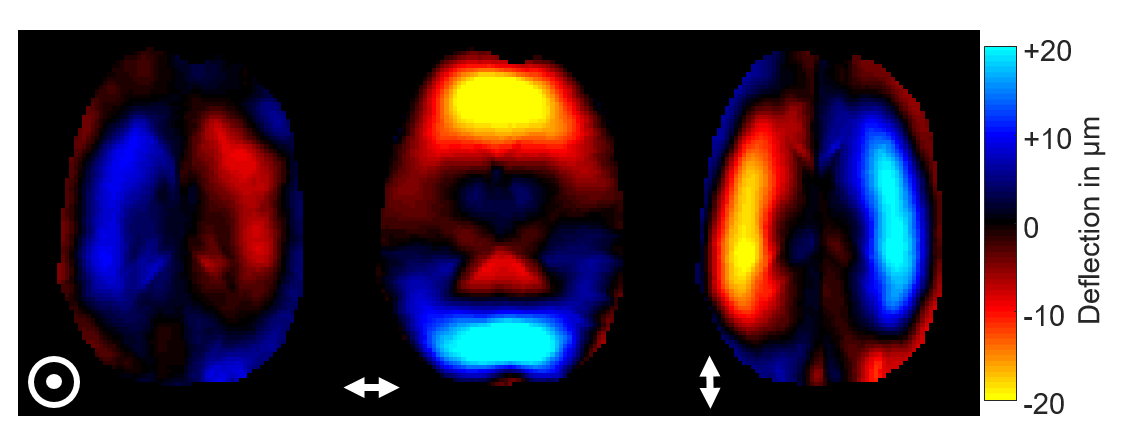
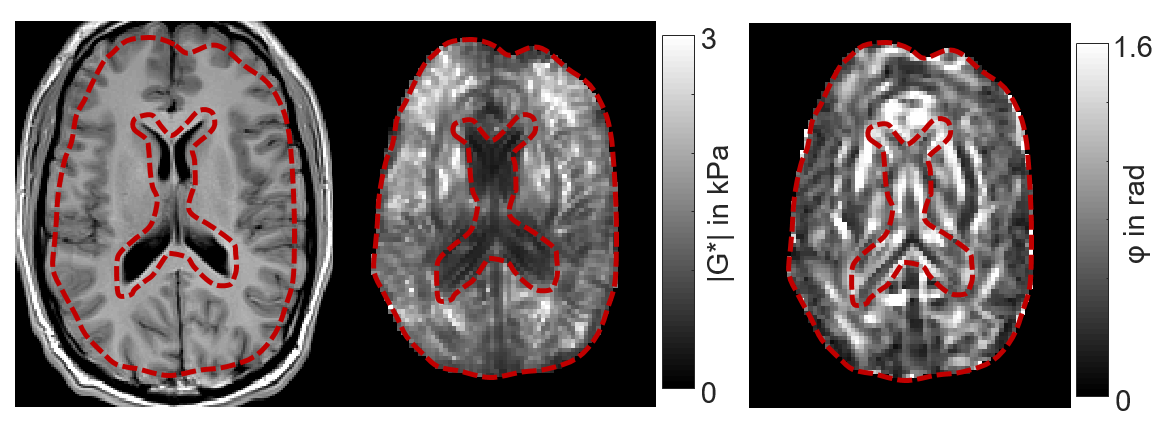
The brains of six healthy volunteers were investigated by rt-MRE in a 3.0T MRI scanner (Siemens Magnetom Prisma, Erlangen). Vibrations at 31.25Hz frequency were continuously induced and encoded into the MRI phase over 80s measure time using a single-shot steady-state gradient-echo MRE-sequence with spiral readout and stroboscopic undersampling6. 1161 wave images were acquired (TR=68ms) depicting three orthogonal wave components in an interleaved manner4. Complex-valued wave images were computed from the Hilbert-transformed phase images using a Gaussian bandpass (σ=0.15Hz) centered at the excitation frequency6. 387 consecutive maps of stiffness (|G*|) and loss angle (φ) were computed using MDEV-inversion at 4.9-Hz frame rate7. A sequence diagram is shown in figure 1. Figure 2 shows representative wave fields and figure 3 stiffness parameter maps. Regions of interest are based on anatomical T1-images. The physiological experiments was as follows: i) 10s baseline phase: no exercise, normal breathing, ii) 5s inhalation with breath hold, iii) 15s Valsalva maneuver, iv) 50s normal breathing and recovery. Group statistics were calculated using two-sample t-tests to investigate changes between the phases with significance level of 5%.Results
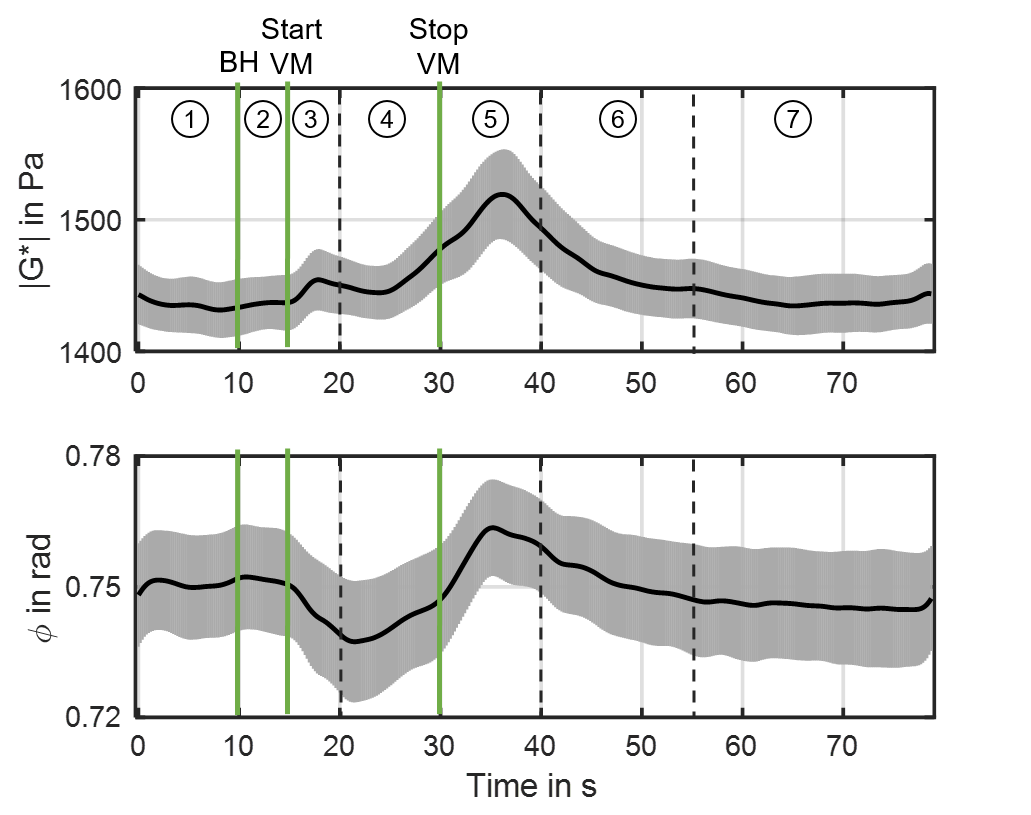
Figure 4 shows group mean stiffness parameter |G*| (top) and φ (bottom) over the course of the experiment with standard error indicated. The onset of breath hold, the start and end of VM are indicated by green vertical lines. Furthermore, the experiments revealed seven distinct phases: Baseline (P1), breath hold (P2), initial-VM (P3), established-VM (P4), post-VM (P5), recovery (P6) and post-VM baseline (P7). Group values and significance levels are displayed in figure 5. |G*| increased in initial response to VM by 1.5%(P<.01) while φ initially decreased in response to VM by 1.7%(P<.05). During established VM (P4) |G*| showed a slight decrease followed by an increase yielding values of 3.4%(P<.01) above baseline. At the end of VM, φ increased to baseline values. Immediately after VM (P5), |G*| and φ further increased to maximum values of 5.7%(P<.01) and 1.9%(P<.05) above baseline at approximately 37s. Both parameters recovered to post-VM baseline values after approximately 55s. No differences were observed between baseline phase (P1), breath hold (P2) and post-VM baseline (P7).Discussion
This study presents rt-MRE in the human brain revealing for the first time that VM is reflected by viscoelastic parameter changes across distinct phases of cerebral autoregulation. Mean viscoelastic parameters quantified by rt-MRE are in good agreement with those reported previously8 on a much longer time scale. Our effect sizes were below the values reported previously for the temporal lobe in literature2. In contrast to this previous work, we were able to temporally resolve the viscoelastic response of the brain to VM by distinct phases. The increase in cerebral stiffness supports previous assumptions, that viscoelastic parameters of brain tissue are sensitive to cerebrovascular reactivity1,2. In the initial VM phase, the intrathoracic pressure is increased leading to reduced venous return and higher cardiac output9,10. Both effects result in a transient increase of ICP which is presumably reflected by the observed transient increase in |G*| during P3. Due to the Bayliss effect (maintaining constant blood flow with changing blood pressure4), the brain regulates the amount of inflowing blood by vasoconstriction leading to the observed reduction in |G*| during P4. However, the Bayliss effect cannot fully compensate the VM-induced outflow restriction causing an accumulation of blood inside the cranial cavity during VM. Consequently, ICP and |G*| are increased in the further course of VM (late P4). Intriguingly, our data show that viscoelasticity reaches peak values within approximately 5s after end of VM pointing towards a dominating arterial inflow above venous drainage and delayed autoregulatory response in P5. A similar behavior is reflected by φ, however, probably with higher sensitivity to intravascular pressure, which controls the overall rigidity of the vascular tree. Higher fluid pressure values might induce tensed vessel walls (water hose effect) which transmit shear waves less damped through the vasculature (low φ values). The reason why both φ and |G*| increase after VM requires further investigation.Conclusion
In this work, we used rt-MRE to study short-term cerebral autoregulation in response to VM based on viscoelastic parameters. Despite small effect sizes, we were able to observe similar responses of brain mechanical property changes to the VM across different subjects suggesting that the cerebral autoregulation is reflected in brain mechanic parameters, which are potentially sensitive to dysfunction of the autoregulation.Acknowledgements
Funding from the German Research Foundation (GRK 2260 BIOQIC, SFB1340 Matrix in Vision) and from the European Union’s Horizon 2020 Program (ID 668039, EU FORCE – Imaging the Force of Cancer) is gratefully acknowledged.References
1. Arani A, Min HK, Fattahi N, Wetjen NM et al. Acute pressure changes in the brain are correlated with MR elastography stiffness measurements: initial feasibility in an in vivo large animal model. Magn Reson Med 2018;79(2):1043-1051.
2. Tzschatzsch H, Kreft B, Schrank F et al. In vivo time-harmonic ultrasound elastography of the human brain detects acute cerebral stiffness changes induced by intracranial pressure variations. Sci Rep 2018;8(1):17888.
3. Schmidt RF, Lang F, Heckmann M. Physiologie des Menschen. Berlin, Heidelberg: Springer-Verlag Berlin Heidelberg; 2011. 979 p.
4. Schrank F, Warmuth C, Görner S et al. Real-time magnetic resonance elastography for viscoelasticity quantification in skeletal muscle during dynamic exercises. Magn Reson Med, currently in print 5. Ipek-Ugay S, Tzschaetzsch H, Fischer T et al. Physiological reduction of hepatic venous blood flow by Valsalva maneuver decreases liver stiffness. Journal of Ultrasound in Medicine 2017;36(7):1305-1311.
6. Schrank F, Warmuth C, Tzschatzsch H et al. Cardiac-gated steady-state multifrequency magnetic resonance elastography of the brain: Effect of cerebral arterial pulsation on brain viscoelasticity. J Cereb Blood Flow Metab 2019:271678X19850936.
7. Papazoglou S, Hirsch S, Braun J et al. Multifrequency inversion in magnetic resonance elastography. Phys Med Biol 2012;57(8):2329-2346.
8. Dittmann F, Hirsch S, Tzschatzsch H et al. In Vivo Wideband Multifrequency MR Elastography of the Human Brain and Liver. Magnetic Resonance in Medicine 2016;76(4):1116-1126.
9. Prabhakar H, Bithal PK, Suri A et al. Intracranial pressure changes during Valsalva manoeuvre in patients undergoing a neuroendoscopic procedure. Minim Invasive Neurosurg 2007;50(2):98-101.
10. Wallasch TM, Kropp P. Cerebrovascular response to valsalva maneuver: methodology, normal values, and retest reliability. J Clin Ultrasound 2012;40(9):540-546.
Figures