0160
Magnetic properties of dopaminergic neurons in human substantia nigra quantified with MR microscopy1Department of Neurophysics, Max Planck Institute for Human Cognitive and Brain Sciences, Leipzig, Germany, 2Faculty of Physics and Earth Sciences, Leipzig University, Leipzig, Germany, 3Center for Cognitive Neuroscience Berlin, Freie Universität Berlin, Berlin, Germany, 4Medical Physics Group, University Hospital Jena, Jena, Germany, 5Paul Flechsig Institute of Brain Research, Leipzig, Germany, 6Microanalytical Center, Department for Low and Medium Energy Physics, Jožef Stefan Institute, Ljubljana, Slovenia, 7Department of Radiology, University Hospital Halle, Halle, Germany
Synopsis
MRI-based quantification of dopaminergic neurons (DN) and their neuromelanin (NM) in substantia nigra (SN) has great potential to serve as a specific biomarker for neurodegeneration in movement disorders. We used 22-µm-resolution post mortem MR microscopy combined with ion beam microscopy to characterize the magnetic properties of DN. MR microscopy visualized individual DN and provided 3D cellular maps of the entire SN. Static dephasing was determined as main effective transverse relaxation mechanism of DN. We characterized the susceptibility of iron in DN and estimated that the contribution of DN to R2* and QSM may also be detected with in vivo MRI.
Introduction
NM-rich DN located in the nigrosomes of SN1 play a pivotal role in the human brain. They are a source of cortical dopamine and involved in motor control, attention regulation, and reward. DN can potentially be visualized and quantified using magnetic resonance imaging (MRI).2–4 Paramagnetic iron accumulated in the DN's NM impacts several MRI parameters, including longitudinal (R1) and effective transverse relaxation rates (R2*), magnetic susceptibility (ᵡ) and magnetization transfer rates. MRI-based visualization and quantification of NM-rich DN in the nigrosomes of SN holds a great promise as a highly needed specific biomarker for neurodegeneration in SN.5However, in vivo MRI visualization and quantification of nigrosomes poses major challenges. A submillimeter resolution is required to visualize these millimeter-sized structures with complex arrangement and diffuse boundaries. Limited knowledge about the nigrosome anatomy and its inter-subject variability makes the interpretation of in vivo SN imaging difficult.2 Moreover, the contrast mechanisms induced by NM are not fully understood. Particularly, the magnetic properties of NM-bound iron deposits are unknown, complicating the development of quantitative contrast models. Susceptibility values provided by Mössbauer spectroscopy, SQUID magnetometry and EPR were obtained either on synthetic NM or dry tissue extracts pooled across several post mortem brains, not reflecting the properties of NM in tissue.6
We used ultra-high field/resolution MR microscopy on post mortem brain tissue in combination with Proton-Induced X-ray Emission (PIXE) to characterize the nigrosome’s anatomy and study MRI contrast mechanisms. We demonstrate that MR microscopy can resolve single NM-rich DN and provide 3D cellular maps of the entire SN. We identified static dephasing as main effective transverse relaxation mechanism of DN. We characterized the magnetic properties of individual neurons and estimated DN-induced R2* and susceptibility values in the nigrosomes at spatial resolutions achievable by in vivo MRI.
Methods
Para-formaldehyde-fixed tissue blocks (3x13x15mm3,5x15x11mm3, post mortem interval<24h) containing SN from two post mortem human brains (age of death 86, 61 years) were studied. Quantitative MRI measurements were performed at 9.4T (BioSpec 94/20 AV3HD, Bruker, Ettlingen) using a helium-cooled 2-channel quadrature mouse coil. 3D muti-echo gradient echo images with isotropic resolution of 22µm were obtained at echo times TE1...4=5,...,21.3ms (TR=110ms, matrix 672x608x320, flip angle 23°, bandwidth 297Hz/pixel, no partial Fourier, total acquisition time 42h46min). Larmor frequency maps were estimated from the temporal phase evolution.Tissue blocks were paraffin-embedded, cut into 10µm thick slices, and processed for histology and PIXE following Reinert et al.7 Precise co-registration between MR microscopy and histology was achieved by matching patterns of NM pigment in histology and dot-like hypointensities in MR images (Fig.2A,C). The pigmented DN were segmented on unstained histological sections using a deep-learning algorithm.8 The total iron content of several DN was measured with PIXE. The magnetic moments of DN were determined by modeling experimental Larmor frequency maps around DN with simulated frequency maps around a magnetic sphere located at the DN's position (Fig.3).9,10 These magnetic moments were used to estimate the contrast between nigrosomes and surrounding tissue in R2* and susceptibility maps in in vivo MRI scans at a currently achievable resolution of 400µm at 7T.11,12 R2* induced by DN was estimated using static dephasing theory, predicting R2*=1.21γµ0ρDNmDN/3, where ρDN is the density of DN and mDN the average magnetic moment of DN.13 The susceptibility contribution of DN was estimated using Δᵡ=µ0ρDNmDN/B0.
Results
DN were visible as dot-like structures on T2*-weighted (T2*w) magnitude images and dipole-like perturbations on Larmor frequency maps (Fig.1,2). Individual DN were identified and characterized using MR microscopy and PIXE (Fig.2). A dipolar Larmor frequency shift pattern extending over several voxels was seen at the location of DN (Fig.1C,D;Fig. 2A,B). It is induced by an increased concentration of paramagnetic iron, as seen on PIXE quantitative iron maps (Fig.2D). The Larmor frequency shift pattern visible at all echo times in high resolution images indicates that DN cause static dephasing in larger voxels (Fig.2B). The average magnetic moment of DN was mDN=91±22mAµm2 and was correlated with neuronal iron load (Fig.4). A linear regression of the magnetic moment of DN and their iron content resulted in a susceptibility of NM-bound iron of 1.1±2.2ppb/ppm iron (wet tissue weight). The simulated maps of R2* and susceptibility corresponding to 7T and ultra-high in vivo MRI resolution showed pronounced R2* and susceptibility changes in NM-rich nigrosomes (Fig.5B,C). The predicted difference in R2* and susceptibility between nigrosomes and surrounding tissue (28±7s-1 and 37±11ppb, respectively, Fig.5B,C) were larger than standard deviations of these parameters (18s-1 for R2* and 21ppb for susceptibility) in R2* and susceptibility maps obtained in vivo with 400µm resolution at 7T.11,12Discussion and Conclusion
We demonstrated that MR microscopy can visualize individual DN in SN. This is a promising tool for 3D histology of nigral anatomy without using contrast agents or tissue clearing. We characterized the magnetic properties of DN and estimated the magnetic susceptibility of NM-bound iron in tissue, which was in the range of the reported susceptibility of ferritin-bound iron (1.3ppb/ppm14) and the susceptibility of the mono-atomic iron binding site in NM (3.3ppb/ppm6). We demostrated the feasibility of nigrosome detection and characterization by state of the art in vivo MRI. Our results are an important step toward in vivo nigrosome visualization and quantification of DN for diagnostics.Acknowledgements
We acknowledge the former Brain Banking Centre Leipzig of the German Brain-Net, operated by the Paul Flechsig Institute of Brain Research, Medical Faculty, University of Leipzig and the Department of Neuropathology, University Hospital Leipzig for providing post mortem brain samples.
The research leading to these results has received funding from the European Research Council under the European Union's Seventh Framework Program (FP7/2007-2013) / ERC grant agreement n° 616905. This project has also received funding from the BMBF (01EW1711A & B) in the framework of ERA-NET NEURON.
M. Brammerloh has received funding from the International Max Planck Research School on Neuroscience of Communication: Function, Structure, and Plasticity.
References
1. Damier P, Hirsch EC, Agid Y, Graybiel AM. The substantia nigra of the human brain. I. Nigrosomes and the nigral matrix, a compartmental organization based on calbindin D(28K) immunohistochemistry. Brain J Neurol. 1999;122 ( Pt 8):1421-1436. doi:10.1093/brain/122.8.1421
2. Blazejewska AI, Schwarz ST, Pitiot A, et al. Visualization of nigrosome 1 and its loss in PD Pathoanatomical correlation and in vivo 7 T MRI. Neurology. 2013;81(6):534-540. doi:10.1212/WNL.0b013e31829e6fd2
3. Betts MJ, Kirilina E, Otaduy MCG, et al. Locus coeruleus imaging as a biomarker for noradrenergic dysfunction in neurodegenerative diseases. Brain. 2019;142(9):2558-2571. doi:10.1093/brain/awz193
4. Lee H, Baek S-Y, Chun SY, Lee J-H, Cho H. Specific visualization of neuromelanin-iron complex and ferric iron in the human post-mortem substantia nigra using MR relaxometry at 7T. NeuroImage. 2018;172:874-885. doi:10.1016/j.neuroimage.2017.11.035
5. Sulzer D, Cassidy C, Horga G, et al. Neuromelanin detection by magnetic resonance imaging (MRI) and its promise as a biomarker for Parkinson’s disease. NPJ Park Dis. 2018;4. doi:10.1038/s41531-018-0047-3
6. Zecca L, Stroppolo A, Gatti A, et al. The role of iron and copper molecules in the neuronal vulnerability of locus coeruleus and substantia nigra during aging. Proc Natl Acad Sci U S A. 2004;101(26):9843-9848. doi:10.1073/pnas.0403495101
7. Reinert T, Spemann D, Morawski M, Arendt T. Quantitative trace element analysis with sub-micron lateral resolution. Nucl Instrum Methods Phys Res Sect B Beam Interact Mater At. 2006;249(1):734-737. doi:10.1016/j.nimb.2006.03.129
8. Berg S, Kutra D, Kroeger T, et al. ilastik: interactive machine learning for (bio)image analysis. Nat Methods. September 2019:1-7. doi:10.1038/s41592-019-0582-9
9. Sedlacik J, Rauscher A, Reichenbach JR. Obtaining blood oxygenation levels from MR signal behavior in the presence of single venous vessels. Magn Reson Med. 2007;58(5):1035-1044. doi:10.1002/mrm.21283
10. Marques J p., Bowtell R. Application of a Fourier-based method for rapid calculation of field inhomogeneity due to spatial variation of magnetic susceptibility. Concepts Magn Reson Part B Magn Reson Eng. 2005;25B(1):65-78. doi:10.1002/cmr.b.20034
11. Trampel R, Bazin P-L, Pine K, Weiskopf N. In-vivo magnetic resonance imaging (MRI) of laminae in the human cortex. NeuroImage. 2019;197:707-715. doi:10.1016/j.neuroimage.2017.09.037
12. Pine KJ, Edwards LJ, Callaghan MF, Bazin P-L, Weiskopf N. Ultra-high resolution in vivo multi-parameter mapping of the human brain. Proc Int Soc Magn Reson Med. 2017;26(1168). http://archive.ismrm.org/2017/1168.html.
13. Yablonskiy DA, Haacke EM. Theory of NMR signal behavior in magnetically inhomogeneous tissues: The static dephasing regime. Magn Reson Med. 1994;32(6):749-763. doi:10.1002/mrm.1910320610
14. Schenck JF. Health and Physiological Effects of Human Exposure to Whole-Body Four-Tesla Magnetic Fields during MRI. Ann N Y Acad Sci. 1992;649(1):285-301. doi:10.1111/j.1749-6632.1992.tb49617.x
15. Brammerloh MD, Weigelt I, Arendt T, et al. A Biophysical Model of Iron-Induced Relaxation in Human Substantia Nigra for Early Stage Parkinson Diagnostic. Proc Int Soc Magn Reson Med. 2019;27(1912). https://cds.ismrm.org/protected/18MPresentations/abstracts/0188.html.
Figures
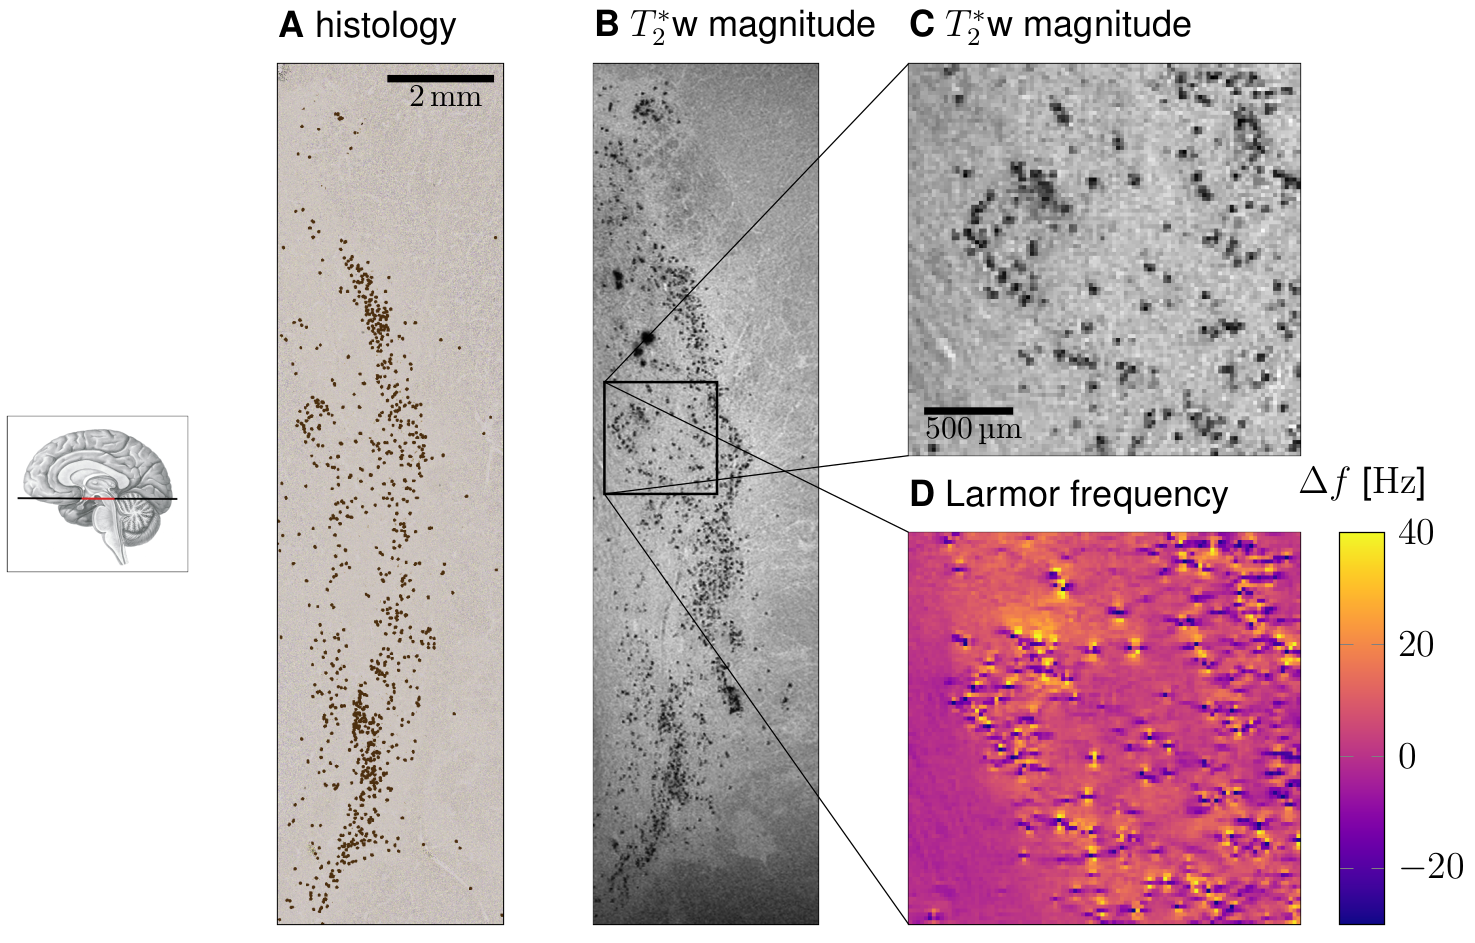
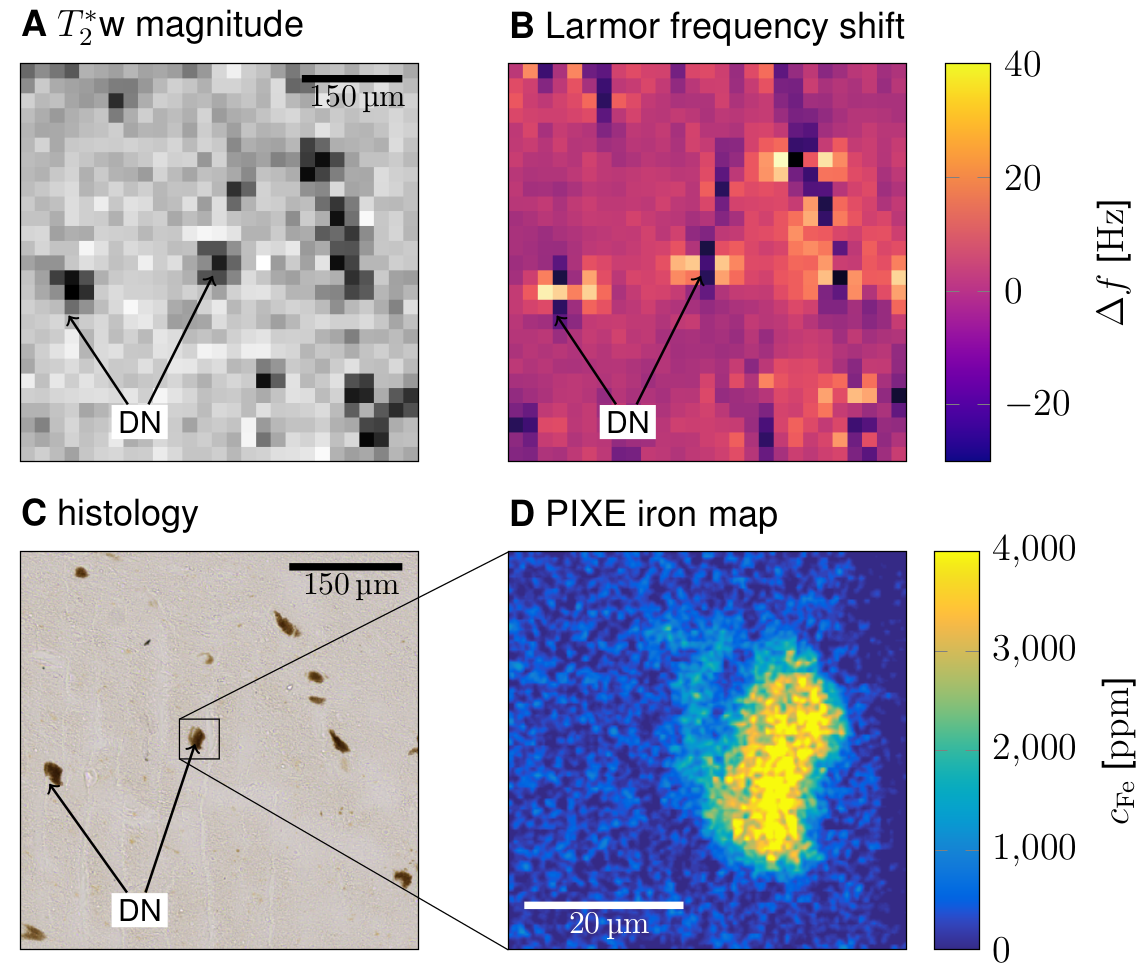
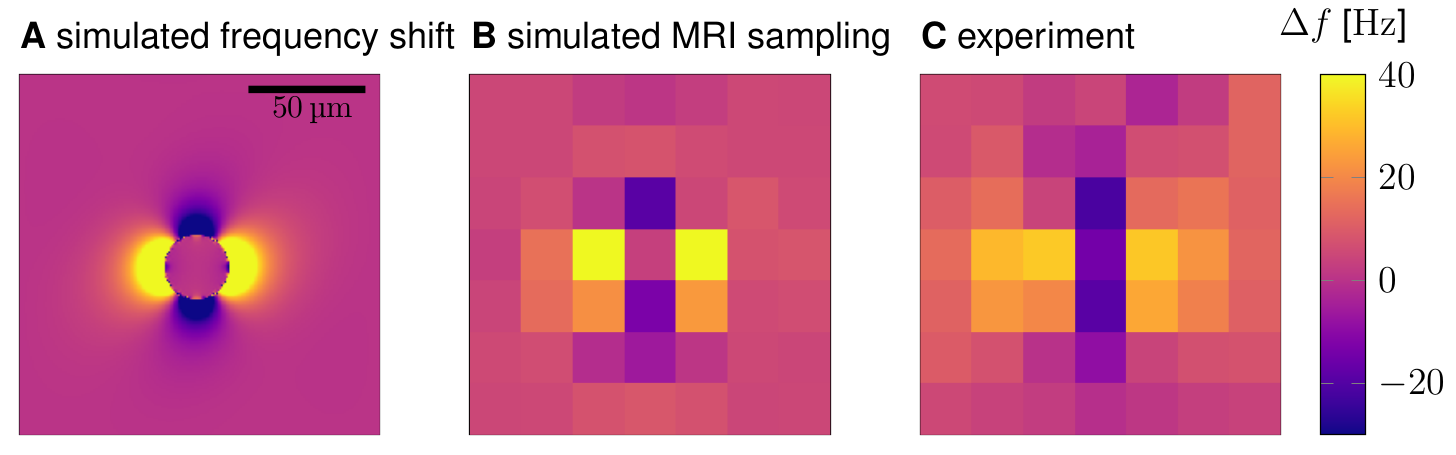
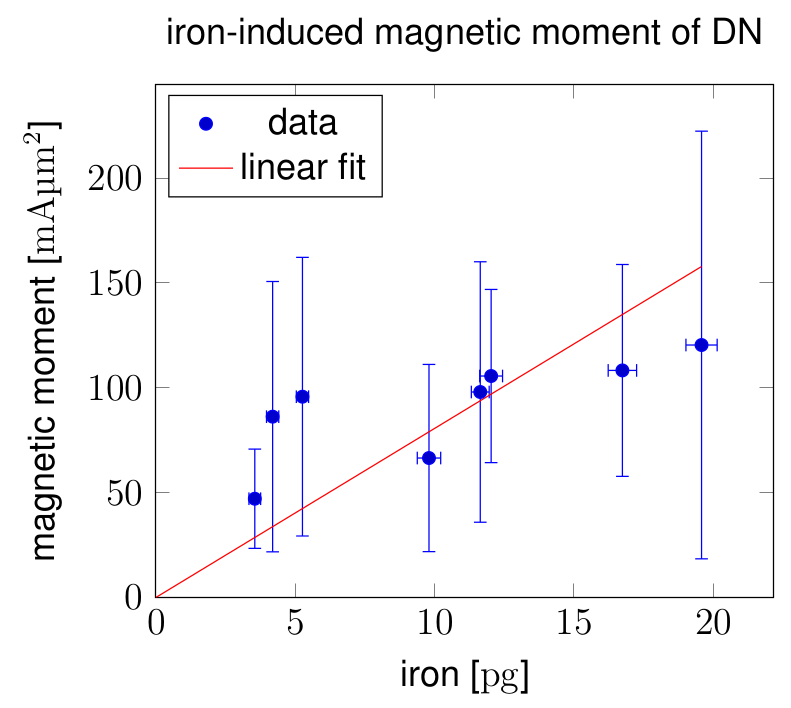
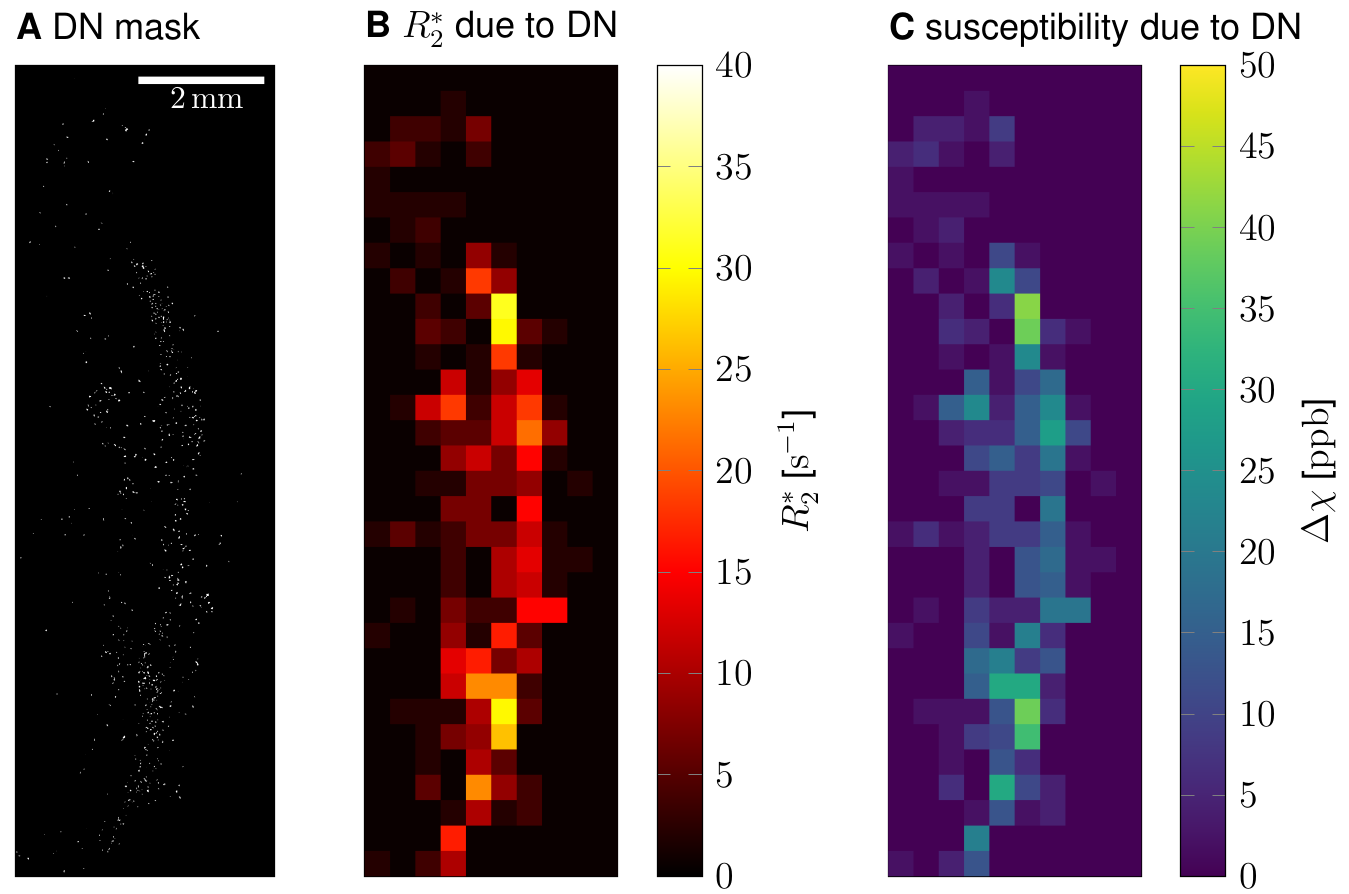
Fig. 5: Prediction of the effective transverse relaxation rate R2* and susceptibility Δᵡ induced by DN in SN in in vivo MRI at 7T. A: The DN density ρDN was derived from this segmentation of NM in unstained sections. B,C: At 400µm resolution, which can be achieved in vivo,11,12 the predicted contribution of DN to R2* was up to 30s-1 and to susceptibility up to 40ppb in NM-rich nigrosomes in SN.