0159
High-Resolution QSM for Simultaneous QSM/MRSI1Department of Electrical and Computer Engineering, University of Illinois at Urbana-Champaign, Urbana, IL, United States, 2Beckman Institute for Advanced Science and Technology, University of Illinois at Urbana-Champaign, Urbana, IL, United States, 3Radiology Department, The Fifth People's Hospital of Shanghai, Shanghai, China, 4School of Biomedical Engineering, Shanghai Jiao Tong University, Shanghai, China, 5Med-X Research Institute, Shanghai Jiao Tong University, Shanghai, China, 6Department of Bioengineering, University of Illinois at Urbana-Champaign, Urbana, IL, United States
Synopsis
In this work, we present a new method to achieve high-resolution QSM for simultaneous QSM/MRSI experiments. This work extends SPICE with a novel data acquisition scheme that provides larger k-space coverage for the unsuppressed water signals. A union-of-subspaces model incorporating sensitivity encodings (parallel imaging) and pre-determined spatiospectral features is used to solve the underlying image reconstruction problem. High-resolution capability (on the order of 1.0 × 1.0 × 1.2 mm3) for QSM has been demonstrated in 3D in vivo simultaneous QSM/MRSI experiments.
Introduction
QSM and MRSI provide complementary information of brain tissues 1,2 and recently the simultaneous QSM/MRSI acquisitions have been successfully demonstrated using SPICE (SPectroscopic Imaging by exploiting spatiospectral CorrElation).3-5 However, in the basic SPICE technique, the QSM resolution was limited to the same resolution of the MRSI signals, which was around 2.1 × 3.0 × 3.0 mm3. This relatively low resolution made it difficult to capture microstructures like veins in the brain, thus limiting its practical utility. In this work, we propose a new method to obtain high-resolution QSM (1.0 × 1.0 × 1.2 mm3) from the SPICE MRSI data. In vivo experiments have been carried out to demonstrate this high-resolution QSM capability in 3D simultaneous QSM/MRSI experiments with 7-minute scan time.Methods
Signal Model: We use the union-of-subspaces model to represent the spectroscopic signals of water, lipid, and metabolites using low-dimensional linear subspaces 3,4:$$\rho_{\mathrm{MRSI}}(\mathbf{r},t) = \sum_{l_w=1}^{L_w}U_{l_w}(\mathbf{r})V_{l_w}(t) + \sum_{l_f=1}^{L_f}U_{l_f}(\mathbf{r})V_{l_f}(t) + \sum_{l_m=1}^{L_m}U_{l_m}(\mathbf{r})V_{l_m}(t)$$
This model significantly reduces the number of degrees-of-freedom and thus enables high-quality image reconstruction from highly sparse or noisy measurements. Since the unsuppressed water signals (from which QSM is obtained) have high SNR, we use an aggressive sampling strategy to cover the extended k-space for the water signals while keeping the central k-space fully sampled for metabolite signals.
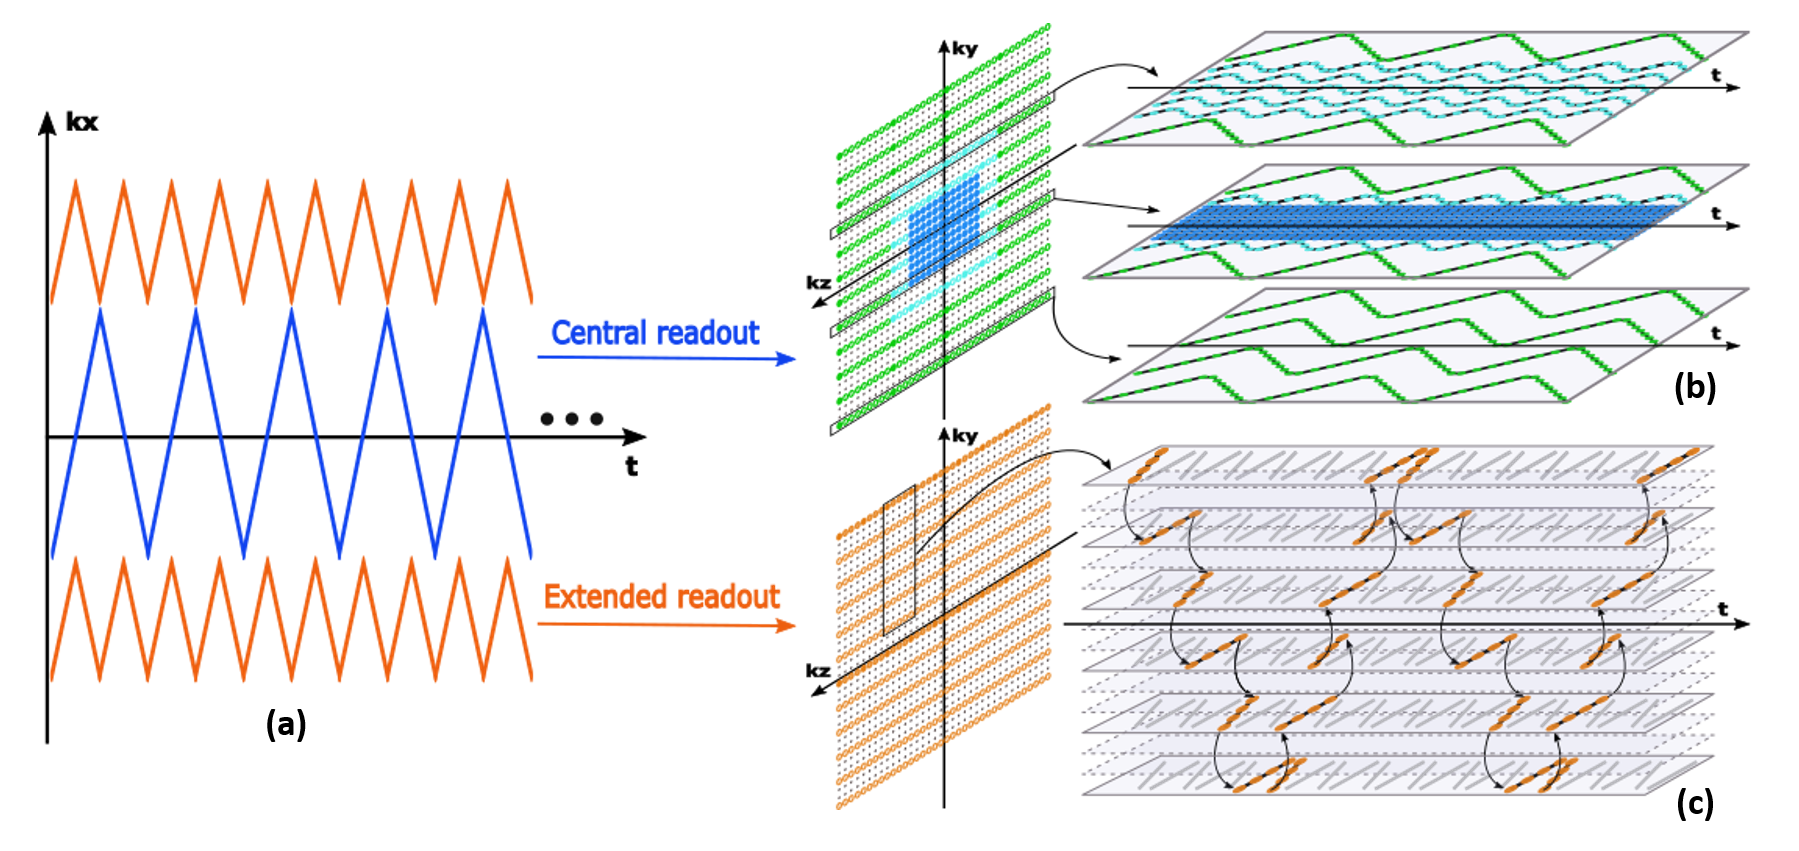
Data Acquisition: The proposed data acquisition scheme is shown in Fig. 1, which gains k-space coverage for the unsuppressed water signals using sparse sampling and blipped phase encodings. More specifically, (1) in the frequency encoding direction (kx), the readout is extended using segmented k-space sampling (Fig. 1a), (2) in the phase encoding directions (ky and kz), large k-space coverage is achieved using sparse and variable density sampling (Fig. 1(b-c)). As compared to the central k-space which is fully sampled for metabolic imaging, the peripheral k-space is undersampled by a factor of 3 in ky plus factors between 3-32 along time (which is acceptable for the water signals in the union-of-subspaces model). The proposed sequence keeps the essential features of SPICE for simultaneous QSM and MRSI 4,5: (1) elimination of water and lipid suppression, (2) rapid acquisition of spatiospectral encodings in EPSI-based trajectories, and (3) FID-based acquisition with ultra-short TE (1.6 ms) and short TR (160 ms). For the unsuppressed water signals, the proposed acquisition scheme enhances the spatial resolution of the basic SPICE sequence by a factor of 14 (from 2.1 × 3.0 × 3.0 mm3 to 1.0 × 1.0 × 1.2 mm3). The total acquisition time was 7 minutes for a typical 3D brain scan (FOV = 240 × 240 × 72 mm3) using the proposed sequence.
Image Reconstruction: We use the union-of-subspaces model to solve the underlying image reconstruction problem incorporating the pre-determined water/lipid basis and sensitivity encodings. More specifically, we solve the following constrained reconstruction:
$$\left \{ \mathbf{U}_i \right \} = \arg\min_{\left \{ \mathbf{U}_i \right \}}||d-\Omega_k \mathcal{F}(B\odot S\odot (\sum_{i=1}^{I}M_i\odot (\mathbf{U}_i\mathbf{V}_i))) ||^2_2+\lambda||\sum_{i=1}^{I}(W\triangledown \mathbf{U}_i)||_2^2 $$
where $$$\Omega_k,\mathcal{F},B,S,W,M_i,\mathbf{V}_i,\mathbf{U}_i$$$ denote sampling in (k, t)-space, Fourier encoding, field map, sensitivity map, edge weights, spatial boundaries, temporal basis, and corresponding spatial coefficients, respectively. After the reconstruction, the tissue susceptibility can be extracted from the water spectroscopic signals by solving the dipole-inversion model incorporating the kernel-based representation of spatial priors.6 Metabolite maps are reconstructed from the MRSI data using existing subspace-based methods.4-8
Results
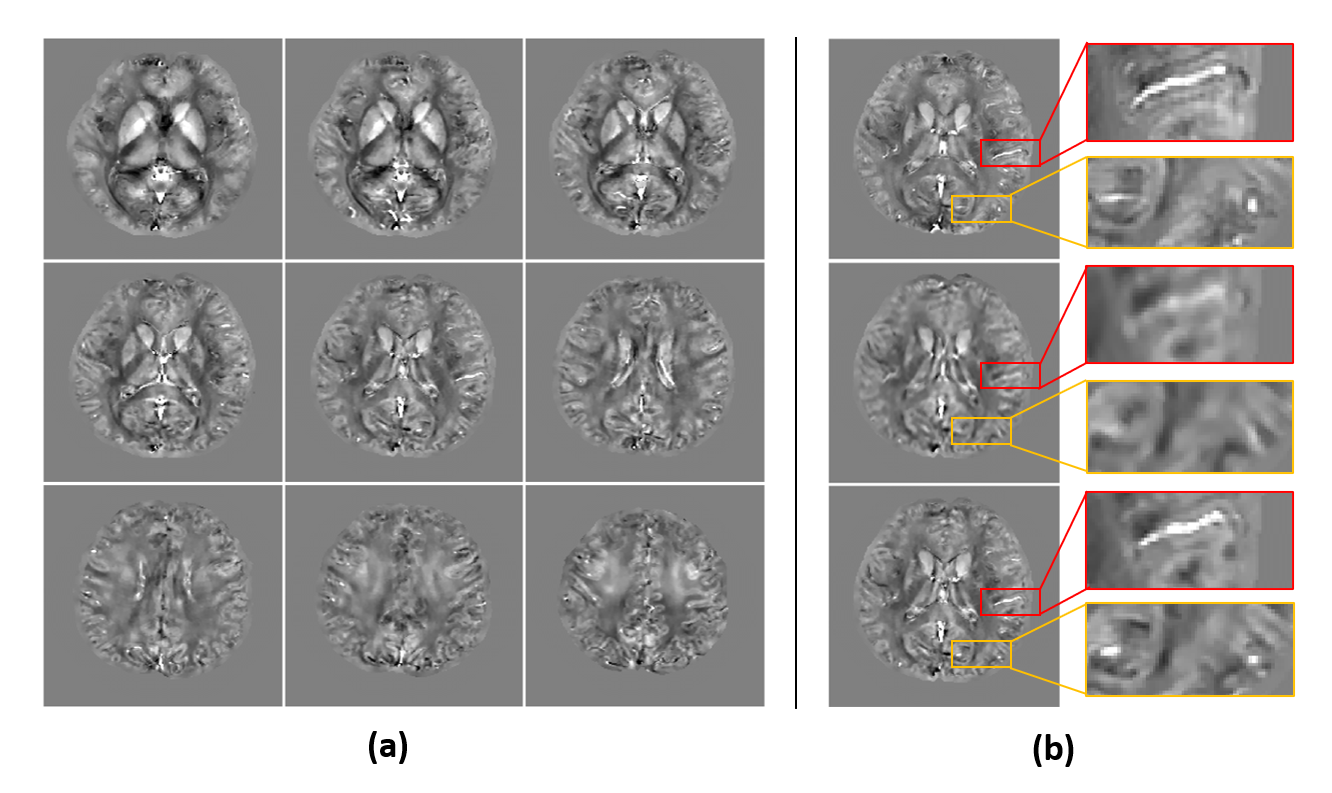
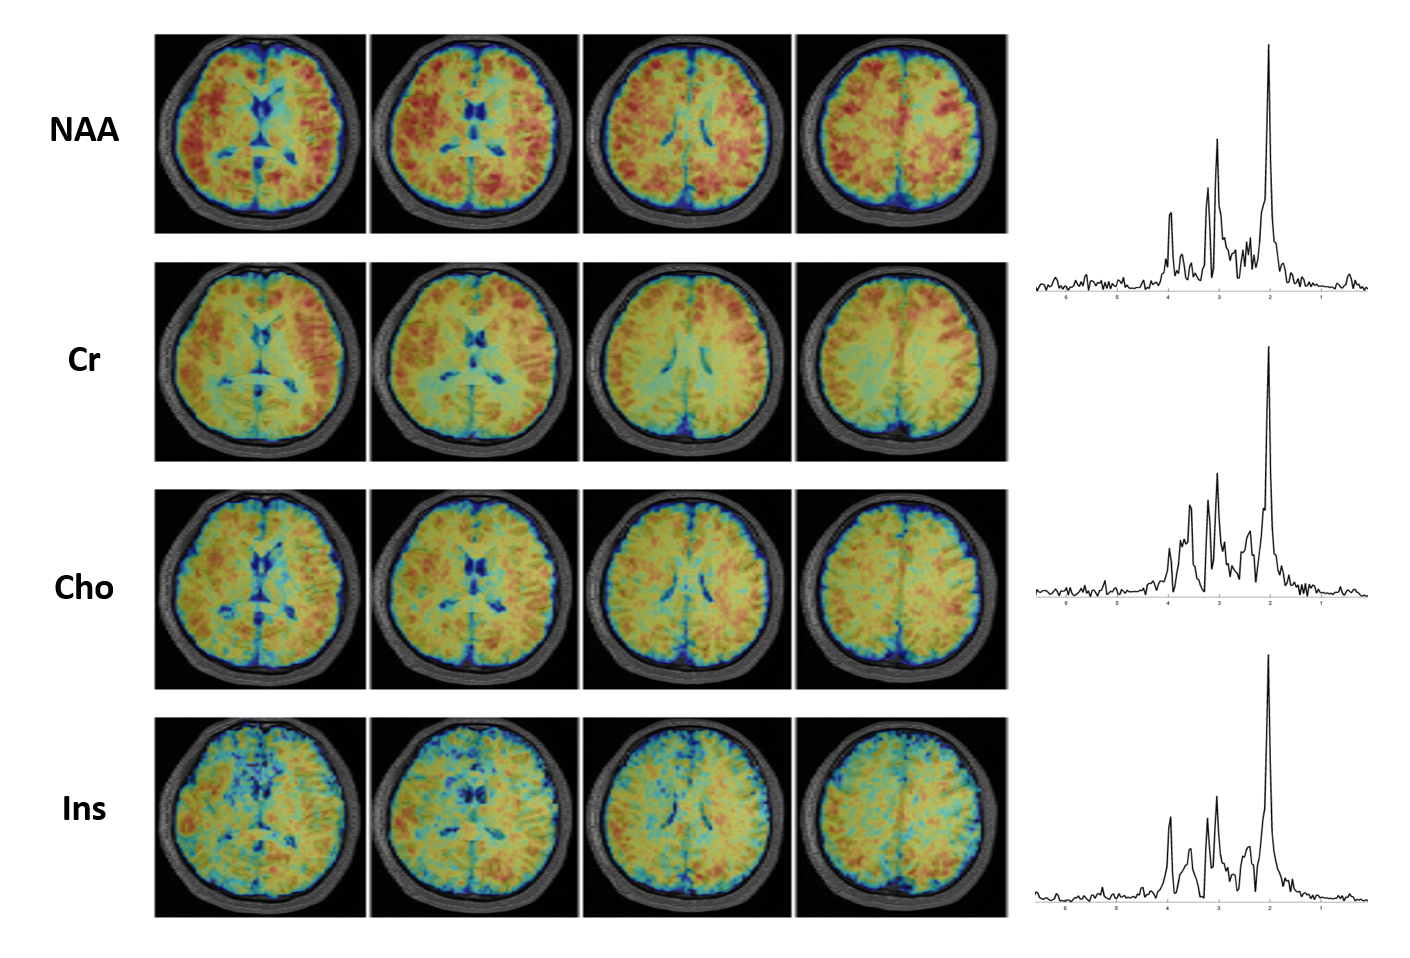
In vivo experiments were performed on 3T SIEMENS scanners using the proposed sequence, which were approved by the Institutional Review Board. The SPICE data from human subjects were acquired with FOV = 240 × 240 × 72 mm3, matrix size = 218 × 218 × 60, TR/TE = 160/1.6 ms, 74 echo pairs with 1.76 ms echo space. Figure 2 shows a set of representative QSM results from the proposed method in comparison with the QSM results obtained from the central k-space MRSI data (2.1 × 3.0 × 3.0 mm3) and from a high-resolution GRE scan (1.0 × 1.0 × 1.8 mm3, 8 min). The resolution improvement of our proposed method is noticeable and its quality is comparable to that of the typical QSM results obtained from the independent GRE scan. The simultaneously acquired metabolite maps (with nominal spatial resolution of 2.1 × 3.0 × 3.0 mm3) are shown in Fig. 3. These experimental results confirm the feasibility of our proposed aggressive sampling scheme in obtaining high-resolution QSM for simultaneous QSM/MRSI experiments. A set of representative results from a tumor patient is shown in Fig. 4, which include the QSM, NAA map, Cr map, and Cho map. Note that the changes in tissue susceptibility (caused by blood deposition), the reduction in NAA and the increase in Cho have been clearly captured by the proposed method.Conclusion
We propose a new method to achieve high-resolution QSM for simultaneous QSM/MRSI. Experimental results demonstrated that the proposed method can achieve simultaneous QSM in 1.0 × 1.0 × 1.2 mm3 nominal resolution and metabolite maps in 2.1 × 3.0 × 3.0 mm3 nominal resolution from a single 7-minute scan. The proposed method will enhance the practical utility of SPICE in clinical applications as well as in scientific research on brain metabolism and tissue properties.Acknowledgements
This work reported in this paper was supported, in part, by the National Institutes of Health (NIH-R21-EB023413, NIH-U01-EB026978)References
1. Wang Y, Tian L. Quantitative susceptibility mapping (QSM): Decoding MRI data for a tissue magnetic biomarker. Magn Reson Med. 2015;73(1):82-101.
2. Posse S, Otazo R, Dager S, et al. MR spectroscopic imaging: principles and recent advances. J Magn Reson Imaging. 2013;37(6):1301-1325.
3. Liang ZP. Spatiotemporal imaging with partially separable functions. Proc IEEE Int Symp Biomed Imaging. 2007:988–991.
4. Lam F, Liang ZP. A subspace approach to high‐resolution spectroscopic imaging. Magn Reson Med. 2014;71(4):1349-1357.
5. Peng X, Lam F, Li Y, et al. Simultaneous QSM and metabolic imaging of the brain using SPICE. Magn Reson Med. 2018;79(4):13-21.
6. Li Y, Liang ZP. Constrained image reconstruction using a kernel+sparse model. Proc Intl Soc Magn Reson Med. 2018:657.
7. Ma C, Lam F, Johnson CL, et al. Removal of nuisance signals from limited and sparse 1H MRSI data using a union‐of‐subspaces model. Magn Reson Med. 2016;75(2):488-497.
8. Li Y, Lam F, Cliiford B, et al. A subspace approach to spectral quantification for MR spectroscopic imaging. IEEE Trans Biomed Eng. 2017;64(10):2486-2489
Figures