0158
Multimodal quantitative arterial-venous segmentation of the human brain at 7T: structure, susceptibility and flow1Athinoula A. Martinos Center for Biomedical Imaging, Massachusetts General Hospital, Charlestown, MA, United States, 2Radiology, Harvard Medical School, Boston, MA, United States, 3Engineering, Boston University, Boston, MA, United States, 45Division of Health Sciences and Technology, Massachusetts Institute of Technology, Cambridge, MA, United States
Synopsis
Vascular imaging acquisition techniques to extract veins and arteries are not impervious to flaws: venography by susceptibility weighted imaging is prone to blooming effects and false-negatives, and angiography from time-of-flight imaging is affected by veins detection and false-negatives. They also fail to provide quantitative measures of vascular physiology such as flow and susceptibility important for understanding the origin of vascular-based biases. Thus, we aimed to employ multi-orientation quantitative susceptibility mapping, multi-echo time-of-flight and quantitative phase-contrast to more accurately detect and quantify the susceptibility and flow along the vascular tree, paving the way for a joint anatomical/physiological vascular atlas at 7T.
INTRODUCTION
Accurate imaging and segmentation of the human cerebral vasculature in vivo is challenging because any imaging modality exhibits distinct forms of detection bias, artifacts and inter-subject variabilities that complicate the characterization of the geometric and topological features of the vasculature. While our previous work successfully created an atlas build from angiography data across a large set of subjects [1], these data were acquired at moderate resolution at 3T and lacked useful, quantitative measures such as blood flow and oxygenation. Also, this prior work identified veins from standard Susceptibility-Weighted-Imaging (SWI) data, which artificially enlarges the apparent diameters of veins [2] and is subject to orientation-related false-negative detection biases [3]. Moreover, arteries were identified from standard Time-of-Flight (ToF) data, sensitive to veins [4] and subject to false-negative detection biases because any vessel that is entirely contained within the imaging volume does not exhibit inflow contrast [5]. Quantitative-Susceptibility-Mapping (QSM) can help remove this orientation-related detection bias for veins, and provides an estimate of the underlying susceptibility of the blood [6], from which blood oxygenation can be calculated [7]. Similarly, quantitative Phase-Contrast (qPC) acquisition [8] to estimate the blood velocity can help avoid the detection bias for arteries in ToF while providing quantitative flow values for the vasculature. Thus our main objectives were to (1) detect and distinguish veins and arteries using multiple vascular imaging techniques as an inter-modality validation and to (2) quantify the susceptibility and flow along the vascular tree. We hypothesized that this will provide both a more accurate depiction of vascular anatomy and quantitative measures of vascular physiology across a set of subjects to form the basis for a joint anatomical/physiological vascular atlasMETHODS
8 healthy volunteers (25±5 y.o., 3M/5F) were scanned on a whole-body 7T scanner (MAGNETOM, Siemens Healthineers) using a custom-built head-only receive coil array. To provide an anatomical reference for all vascular data, we acquired T1-weighted MEMPRAGE acquisition (TR/TI/TE1/TE2=2530/1100/1.76/3.7ms, voxel=0.8mm³) as described previously [9], followed by a qPC acquisition (‘X-Y-Z’ acquisitions, TR/TE=55/10, flip=18°, GRAPPA=4×1, voxel=0.9 mm³ ) depicting blood flow measurements. For QSM processing, we collected three 3D MEGRE volumes (TR/TE1/TE2=26/9.60/19.20ms, flip=15°, GRAPPA=2×2, voxel=0.5mm³) at different head angles (neutral, tilted-left, tilted-“chin up”), which were reconstructed with the aspire phase-sensitive coil combination [10]. These data were processed using the Calculation-Of-Susceptibility-through-Multi-Orientation-Sampling (COSMOS) method paired with a Nonlinear-Dipole-Inversion (NDI) regularization [11], and indirectly allowed us to reconstruct SWIs [12] at the three angles to ensure a complete venous vessels reconstruction. We then acquired a 4-slabs of multi-echo ToF data [13] (TR/TE1/TE2=20/6.76/13.40ms, flip=18°, GRAPPA=4×1, voxel=0.5mm³), which provides both artery/tissue contrast (short TE) and, although with lesser extent than the QSM images, a vein/tissue contrast (long TE). All images were preprocessed as in [1] while the vascular extraction was done with the updated Braincharter segmentation tool [1], limited to a range between 0.5-3.0mm, which generated a "vesselness" score that was thresholded at >95% to obtain a fine vessel tree. After aligning all images to the T1 anatomical reference using ANTs, the registration was refined using an iterative registration refinement [1] with the ME-ToF and its venous/arterial segmentations in T1-space as a reference in order to improve the multi-modal alignment.RESULTS
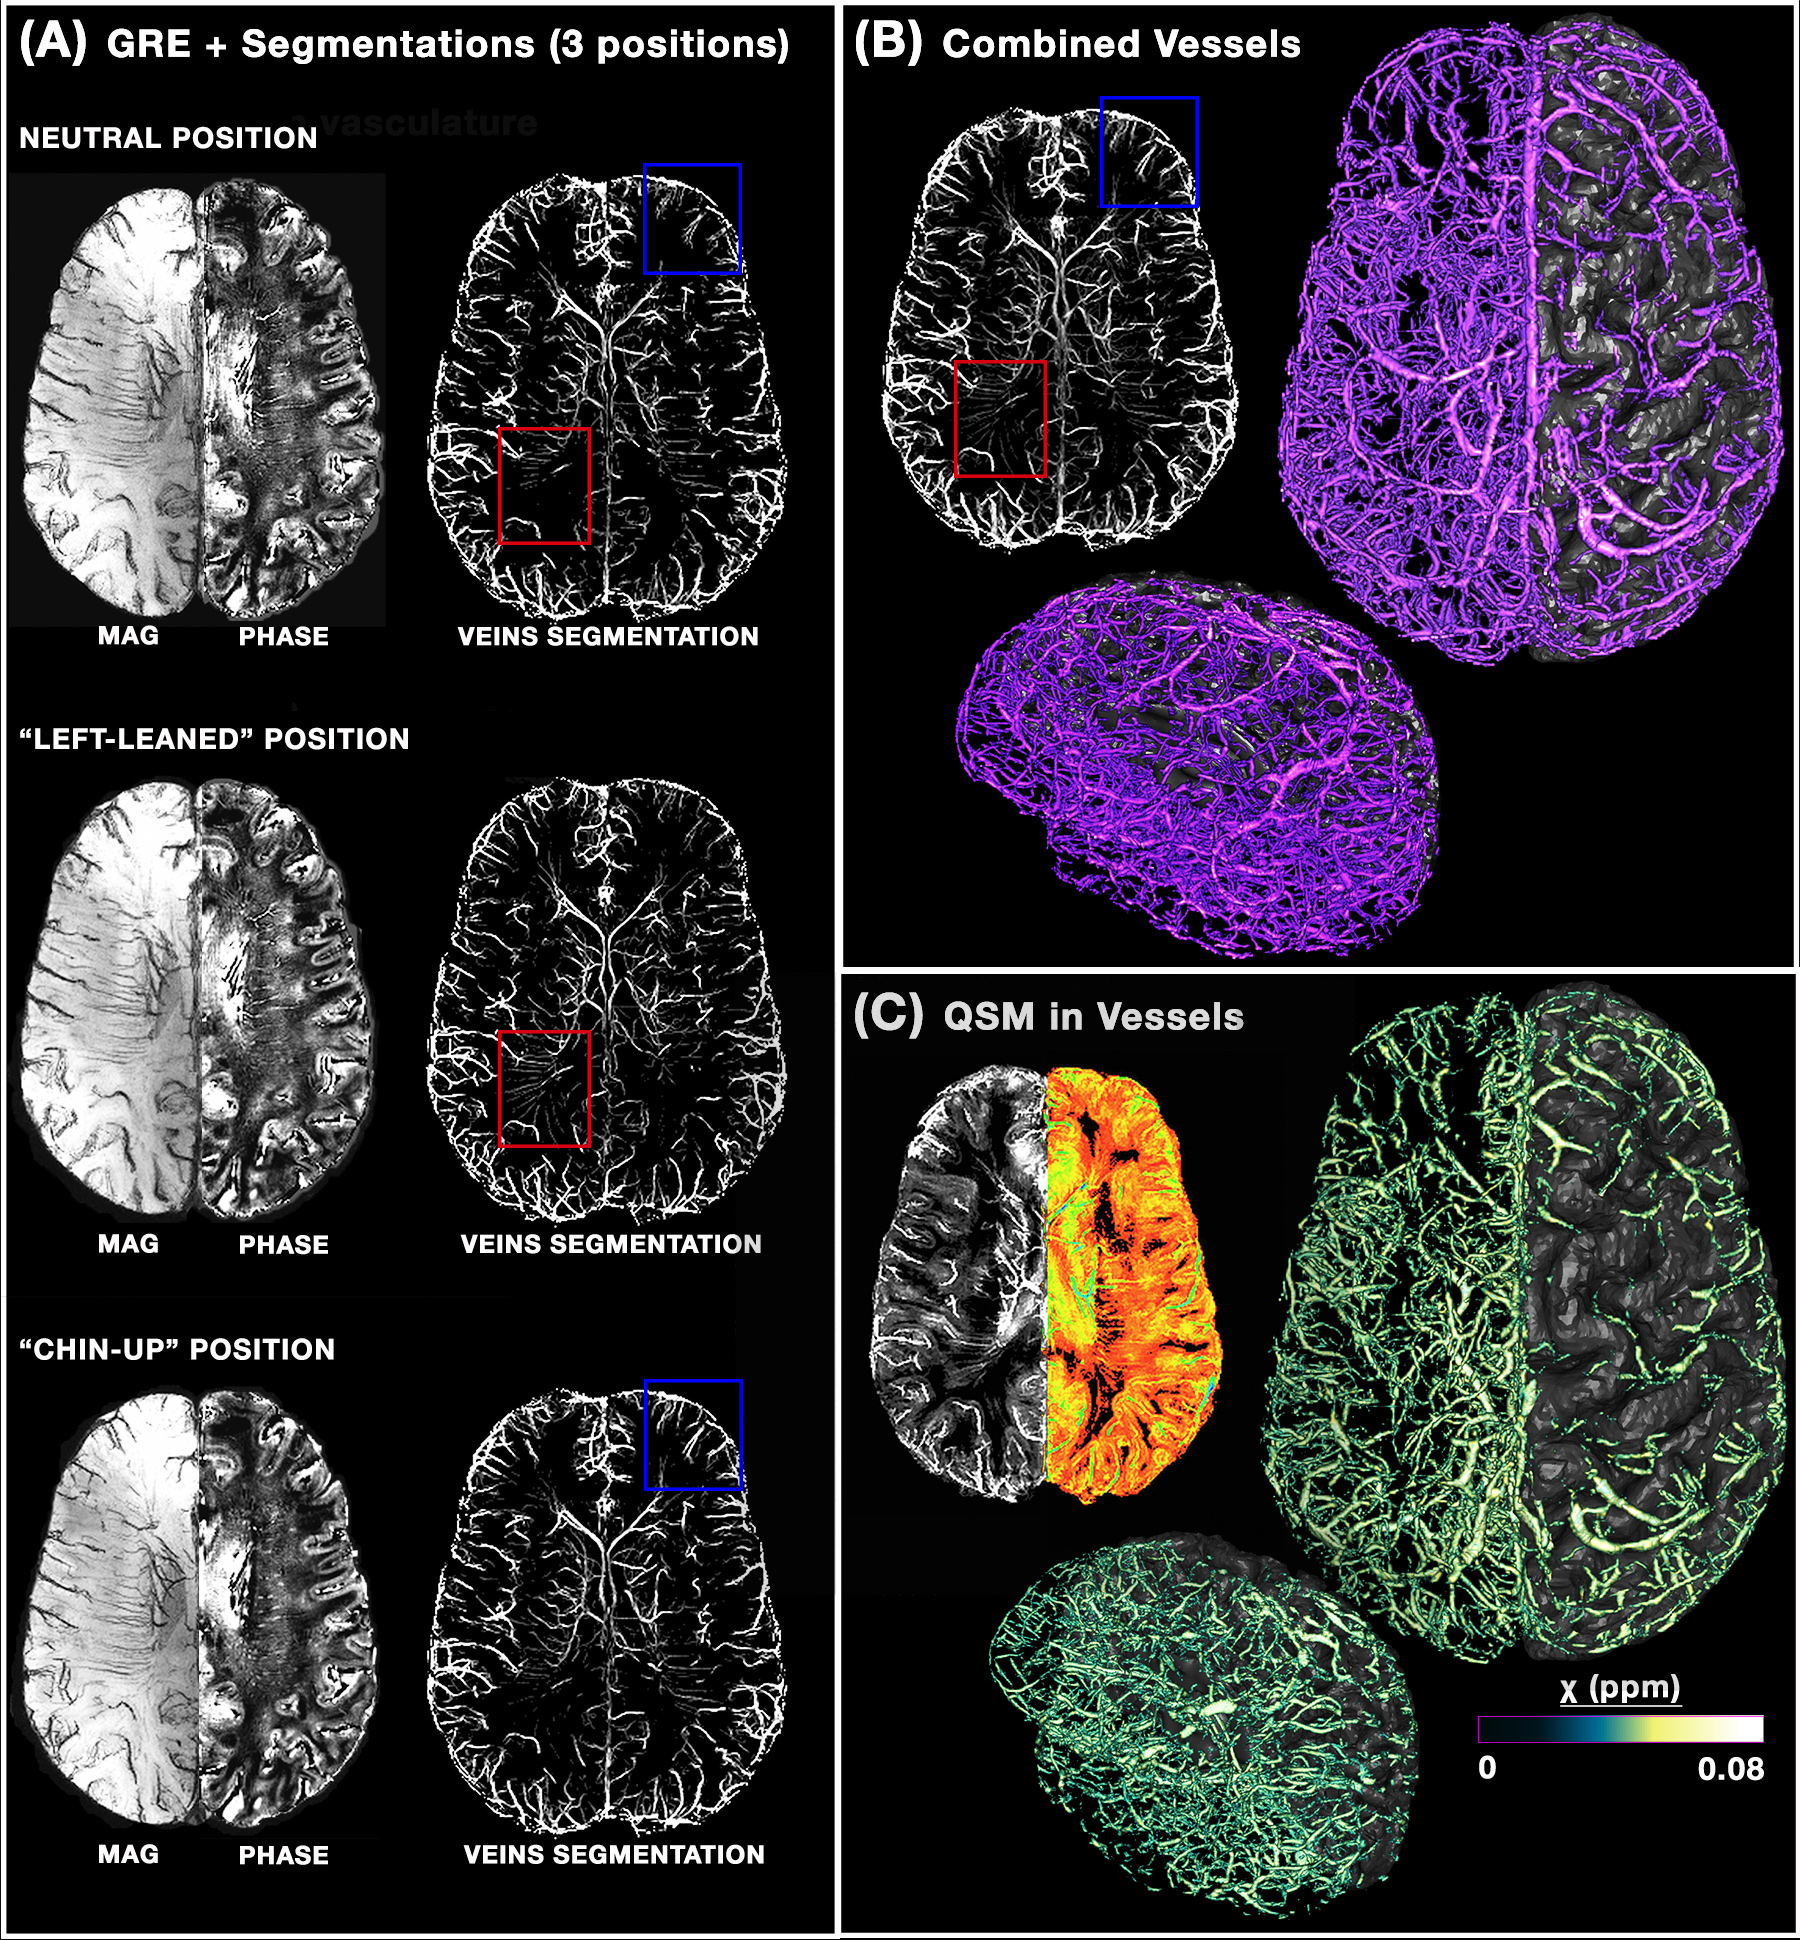
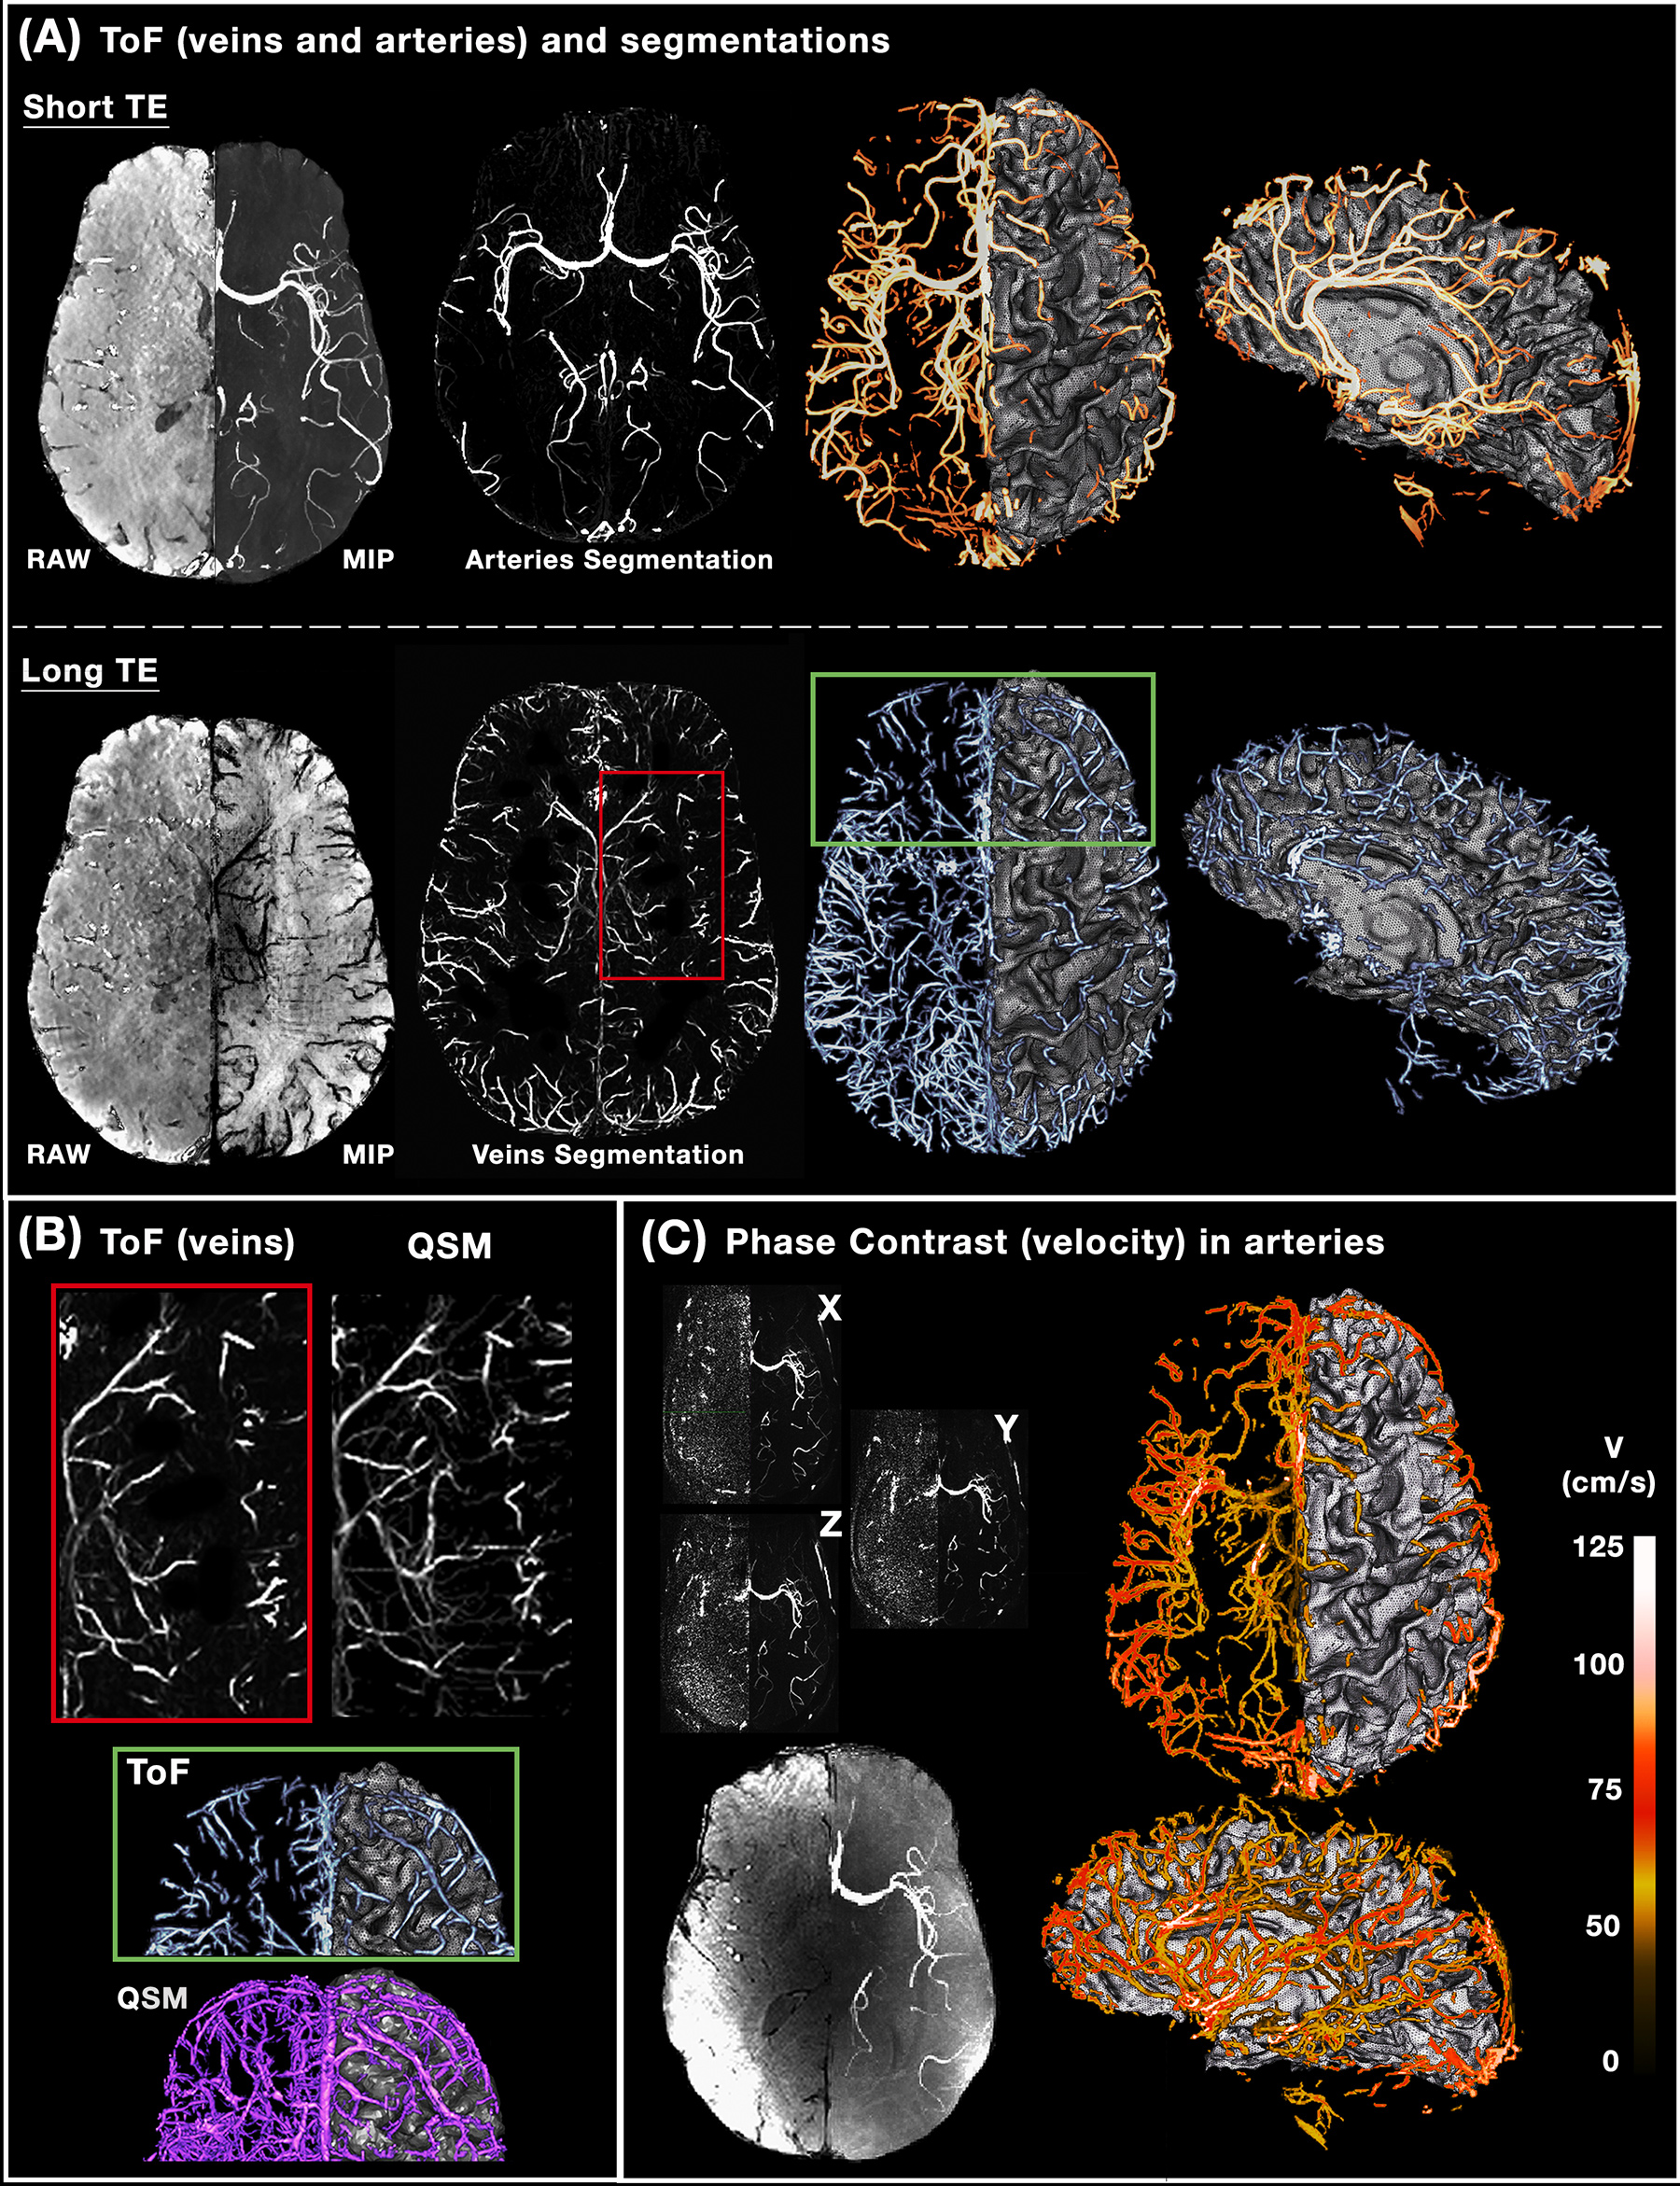
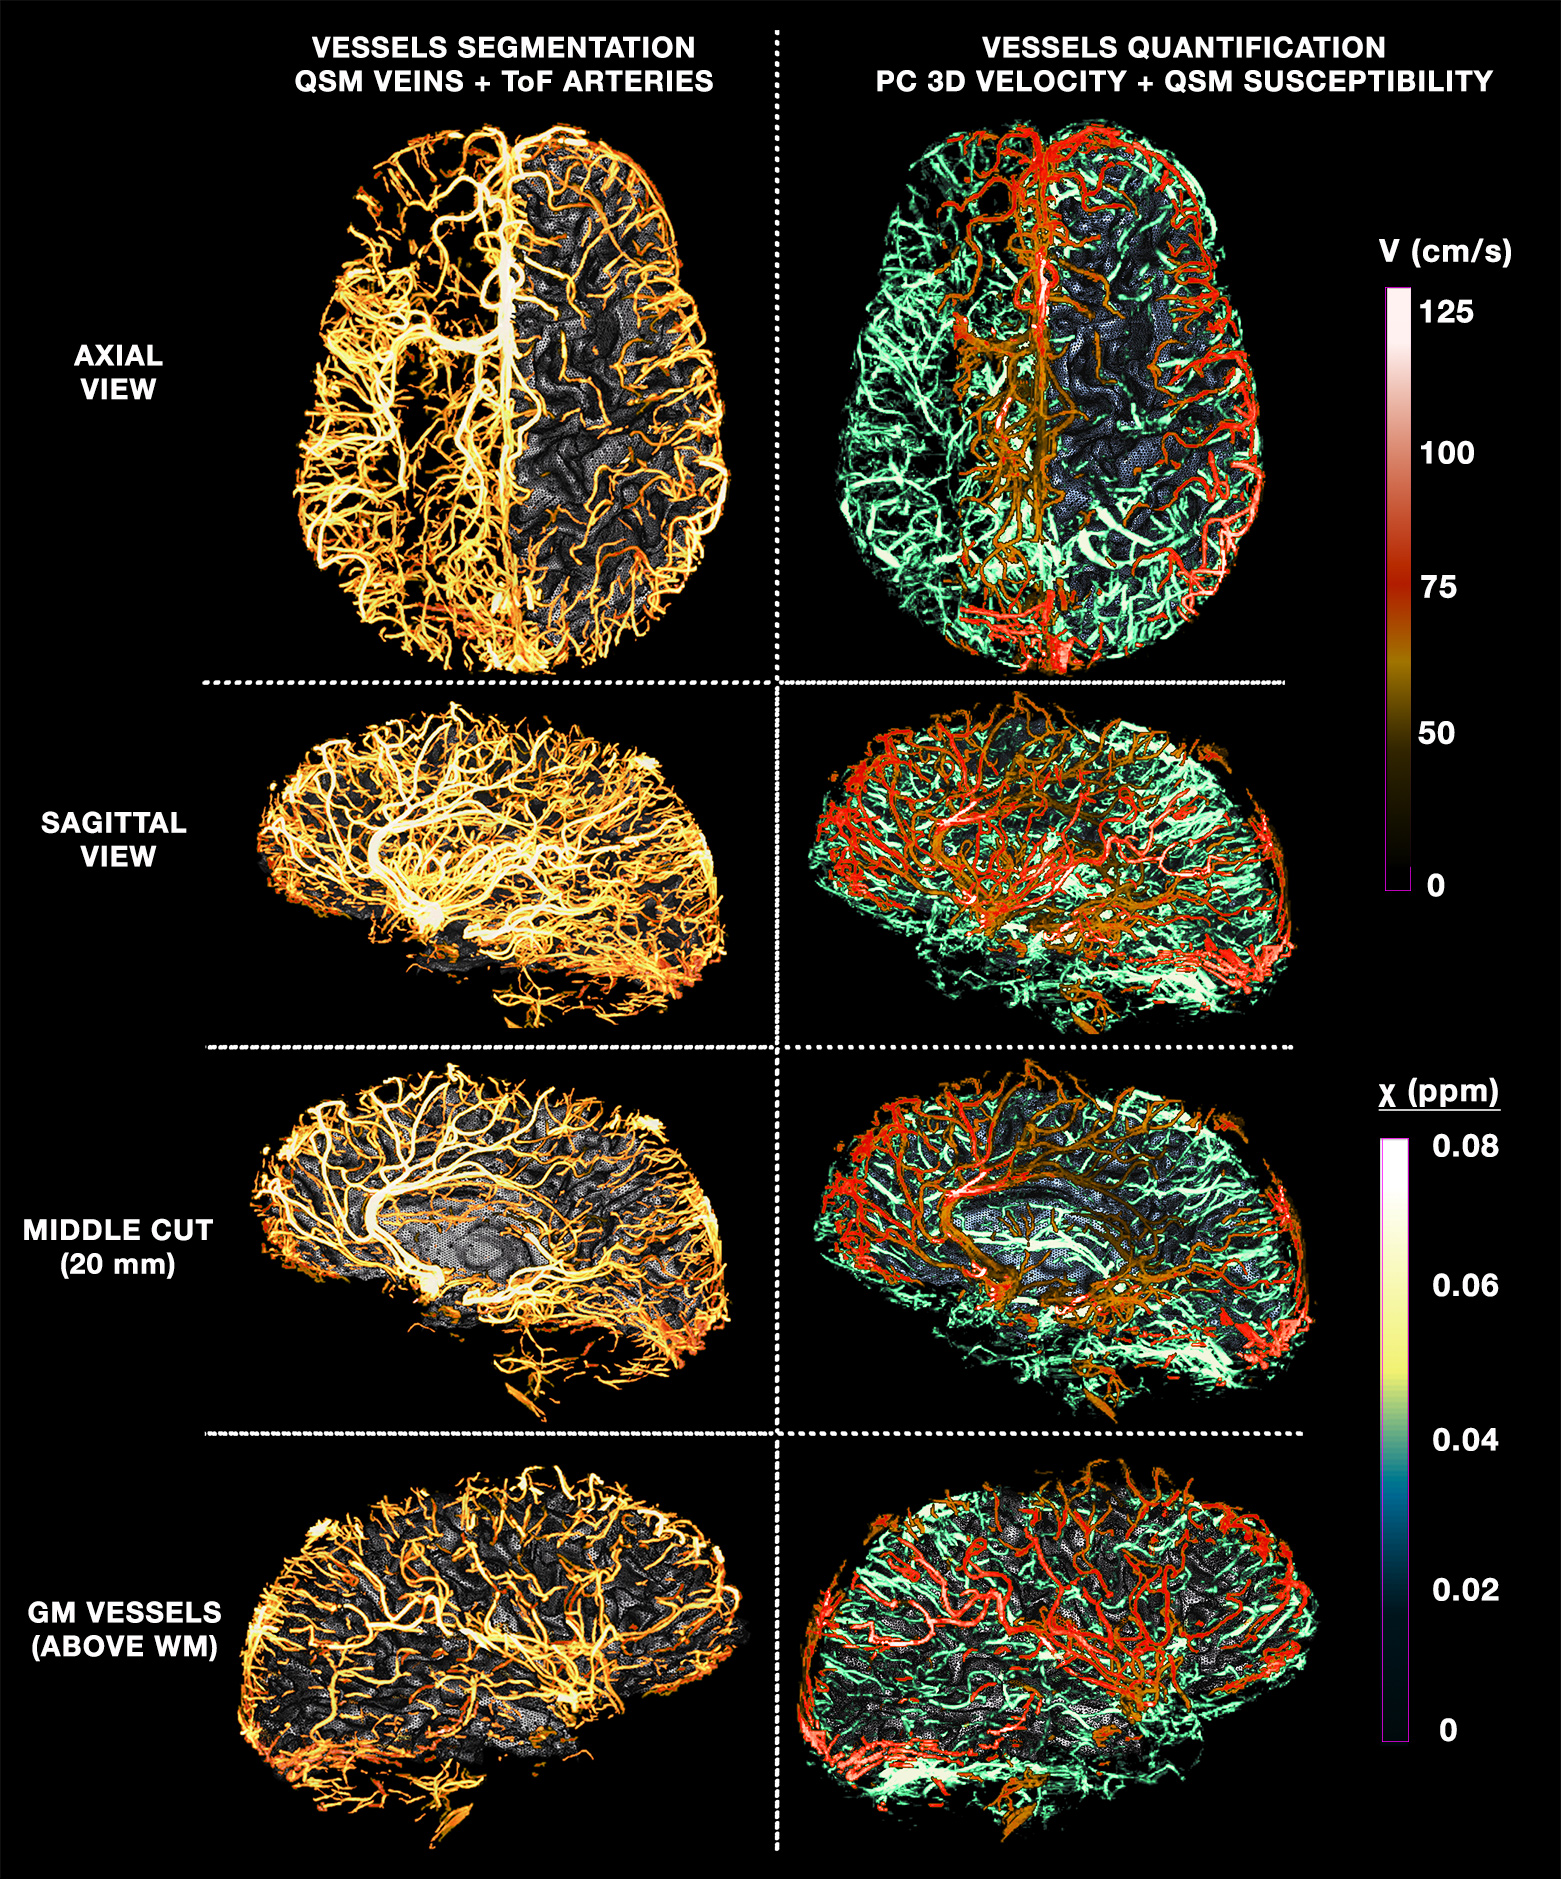
Figure 1 illustrates the benefits of multi-orientation QSM over one direction SWI for generating consistent depiction of venous structures without the B0 orientation effect; along with the QSM map, segmentations for each individual head orientation as well as their combination are shown. Figure 2 illustrates the venous/arterial components extracted from the ME-ToF data, as well as the velocity maps derived from the qPC data applied to the arterial tree segmentation for visualization. Figure 3 shows a combined arterial/venous tree with quantitative velocity and susceptibility values for a single subject.DISCUSSION & CONCLUSION
MR vascular acquisitions all have individual drawbacks: in QSM, magic angle and blooming effects; in ToF, low sensitivity to veins and potential false positives for vessels entirely within the imaging slab; for PC, long acquisition time due to the multiple velocity encodes, inability to detect small vessels, and low CNR. Regardless, by combining multiple sources, we obtained a more complete depiction of the cortical veins and arteries, allowing us to be the first to also quantify the susceptibility and flow along all the vascular tree as opposed to previous efforts [14]–[16]. Compared to other QSM/SWI atlases [17]-[18], we employed multiple directions which allowed us to uncover hidden veins lost due to orientation dependent-effects, and utilized a new QSM regularization methodology that yields improved image quality [11]. Accurate registration across subjects is critical for building a probabilistic atlas, but challenging due to the natural, meaningful variations of the human cerebrovascular system as well as subject-specific artefacts, and thus obtaining the veins and arteries in the same ToF acquisitions allowed us to properly align the QSM veins with the ToF veins and consequently their arteries. Tthis quantitative imaging protocol and analysis pipeline represents a marked improvement over our previous efforts [1] to obtain a more accurate segmentation of the vessels and a more complete reconstruction of the mesoscopic vasculature. Although volunteer scanning is still underway, this will allow us to construct an updated and quantitative version of an in-vivo human brain vascular atlas from high-resolution 7T data.Acknowledgements
This work was supported in part by the NIH NIBIB (grants P41-EB015896 and R01-EB019437), NINDS (grant R21-NS106706), by the BRAIN Initiative (NIH NIMH grant R01-MH111419), and by the MGH/HST Athinoula A. Martinos Center for Biomedical Imaging; and was made possible by the resources provided by NIH Shared Instrumentation Grants S10-RR023043 and S10-RR019371.References
[1] M. Bernier, S. C. Cunnane, and K. Whittingstall, “The morphology of the human cerebrovascular system,” Hum. Brain Mapp., vol. 39, no. 12, pp. 4962–4975, Dec. 2018. [2] M.-C. Hsieh, C.-Y. Tsai, M.-C. Liao, J.-L. Yang, C.-H. Su, and J.-H. Chen, “Quantitative Susceptibility Mapping-Based Microscopy of Magnetic Resonance Venography (QSM-mMRV) for In Vivo Morphologically and Functionally Assessing Cerebromicrovasculature in Rat Stroke Model,” PLoS One, vol. 11, no. 3, p. e0149602, Mar. 2016. [3] W. Chang et al., “Velocity measurements in the middle cerebral arteries of healthy volunteers using 3D radial phase-contrast HYPRFlow: comparison with transcranial Doppler sonography and 2D phase-contrast MR imaging.,” AJNR. Am. J. Neuroradiol., vol. 32, no. 1, pp. 54–9, Jan. 2011. [4] A. A. Harteveld et al., “High-resolution postcontrast time-of-flight MR angiography of intracranial perforators at 7.0 Tesla.,” PLoS One, vol. 10, no. 3, p. e0121051, 2015. [5] A. H. Kuo, P. Nagpal, B. B. Ghoshhajra, and S. S. Hedgire, “Vascular magnetic resonance angiography techniques.,” Cardiovasc. Diagn. Ther., vol. 9, no. Suppl 1, pp. S28–S36, Aug. 2019. [6] H. J. Kuijf et al., “Quantification of deep medullary veins at 7 T brain MRI,” Eur. Radiol., vol. 26, no. 10, pp. 3412–3418, Oct. 2016. [7] P. G. D. Ward et al., “Improved Quantification of Cerebral Vein Oxygenation Using Partial Volume Correction,” Front. Neurosci., vol. 11, p. 89, Feb. 2017. [8] A. F. Stalder, M. F. Russe, A. Frydrychowicz, J. Bock, J. Hennig, and M. Markl, “Quantitative 2D and 3D phase contrast MRI: Optimized analysis of blood flow and vessel wall parameters,” Magn. Reson. Med., vol. 60, no. 5, pp. 1218–1231, Nov. 2008. [9] N. Zaretskaya, B. Fischl, M. Reuter, V. Renvall, and J. R. Polimeni, “Advantages of cortical surface reconstruction using submillimeter 7 T MEMPRAGE,” Neuroimage, vol. 165, pp. 11–26, Jan. 2018. [10] K. Eckstein et al., “Computationally Efficient Combination of Multi-channel Phase Data From Multi-echo Acquisitions (ASPIRE),” Magn. Reson. Med., vol. 79, no. 6, pp. 2996–3006, Jun. 2018. [11] D. Polak et al., “Nonlinear Dipole Inversion (NDI) enables Quantitative Susceptibility Mapping (QSM) without parameter tuning,” Sep. 2019. [12] E. M. Haacke, Y. Xu, Y.-C. N. Cheng, and J. R. Reichenbach, “Susceptibility weighted imaging (SWI),” Magn. Reson. Med., vol. 52, no. 3, pp. 612–618, Sep. 2004. [13] Y. P. Du, Z. Jin, Y. Hu, and J. Tanabe, “Multi-echo acquisition of MR angiography and venography of the brain at 3 Tesla,” J. Magn. Reson. Imaging, vol. 30, no. 2, pp. 449–454, Aug. 2009. [14] T. Dunas, A. Wahlin, K. Ambarki, L. Zarrinkoob, J. Malm, and A. Eklund, “A Stereotactic Probabilistic Atlas for the Major Cerebral Arteries,” Neuroinformatics, vol. 15, no. 1, pp. 101–110, Jan. 2017. [15] R. Viviani, “A Digital Atlas of Middle to Large Brain Vessels and Their Relation to Cortical and Subcortical Structures.,” Front. Neuroanat., vol. 10, p. 12, 2016. [16] N. D. Forkert, J. Fiehler, S. Suniaga, H. Wersching, S. Knecht , and A. Kemmling, “A Statistical Cerebroarterial Atlas Derived from 700 MRA Datasets,” Methods Inf. Med., vol. 52, no. 6, pp. 467–474, Nov. 2013. [17] J. Huck et al., “High resolution atlas of the venous brain vasculature from 7 T quantitative susceptibility maps,” Brain Struct. Funct., vol. 224, no. 7, pp. 2467–2485, Sep. 2019. [18] P. G. D. Ward et al., “Combining images and anatomical knowledge to improve automated vein segmentation in MRI,” Neuroimage, vol. 165, pp. 294–305, Jan. 2018.Figures