0156
7 Tesla Diffusion Tensor Imaging and Quantitative Susceptibility Mapping of Huntington’s Disease1Radiology & Biomedical Imaging, University of California, San Francisco, San Francisco, CA, United States, 2University of Wisconsin School of Medicine and Public Health, Madison, WI, United States, 3Neurology, University of California, San Francisco, San Francisco, CA, United States
Synopsis
Ultra-high-field 7 Tesla (7T) MRI was acquired to examine and compare white matter microstructure and quantitative susceptibility in patients with premanifest (PM) and early manifest (EM) Huntington’s disease (HD) and age-matched healthy control (HC) subjects. Tract-averaged and along-tract fractional anisotropy (FA) and susceptibility (PPM) were calculated to determine the spatial spread of disease along motor tracks originating from the striatum and ending in the cortex. HC and PM patients demonstrated different areas of significantly increased susceptibility compared to EM at the tract-averaged level as well as significant focal along-tract variations in FA and susceptibility which were undetected by tract-averaged analysis.
Introduction
Huntington’s Disease (HD) is an autosomal dominant neurodegenerative disorder caused by aberrant expansion of cytosine-adenine-guanine (CAG) repeats in the HTT gene (4p16.3). Individuals with enhanced genetic susceptibility to HD (CAG repeats > 40) demonstrate cognitive and psychiatric disturbances prior to extrapyramidal motor neuron symptoms, such as chorea, whereupon clinical diagnosis of HD can be made. Although neuroimaging studies have shown fronto-striatal atrophy temporally correlates with early cognitive changes and predates motor function decline in HD patients1, the identification of robust neuroimaging biomarkers for HD remains central to improving assessment of disease severity and predicting progression. The goal of this study was to evaluate the role of microstructural alterations and iron deposition in motor pathways using 7T diffusion tensor imaging (DTI) and quantitative susceptibility mapping (QSM) in patients with premanifest and early manifest HD compared to age-matched healthy controls.Methods
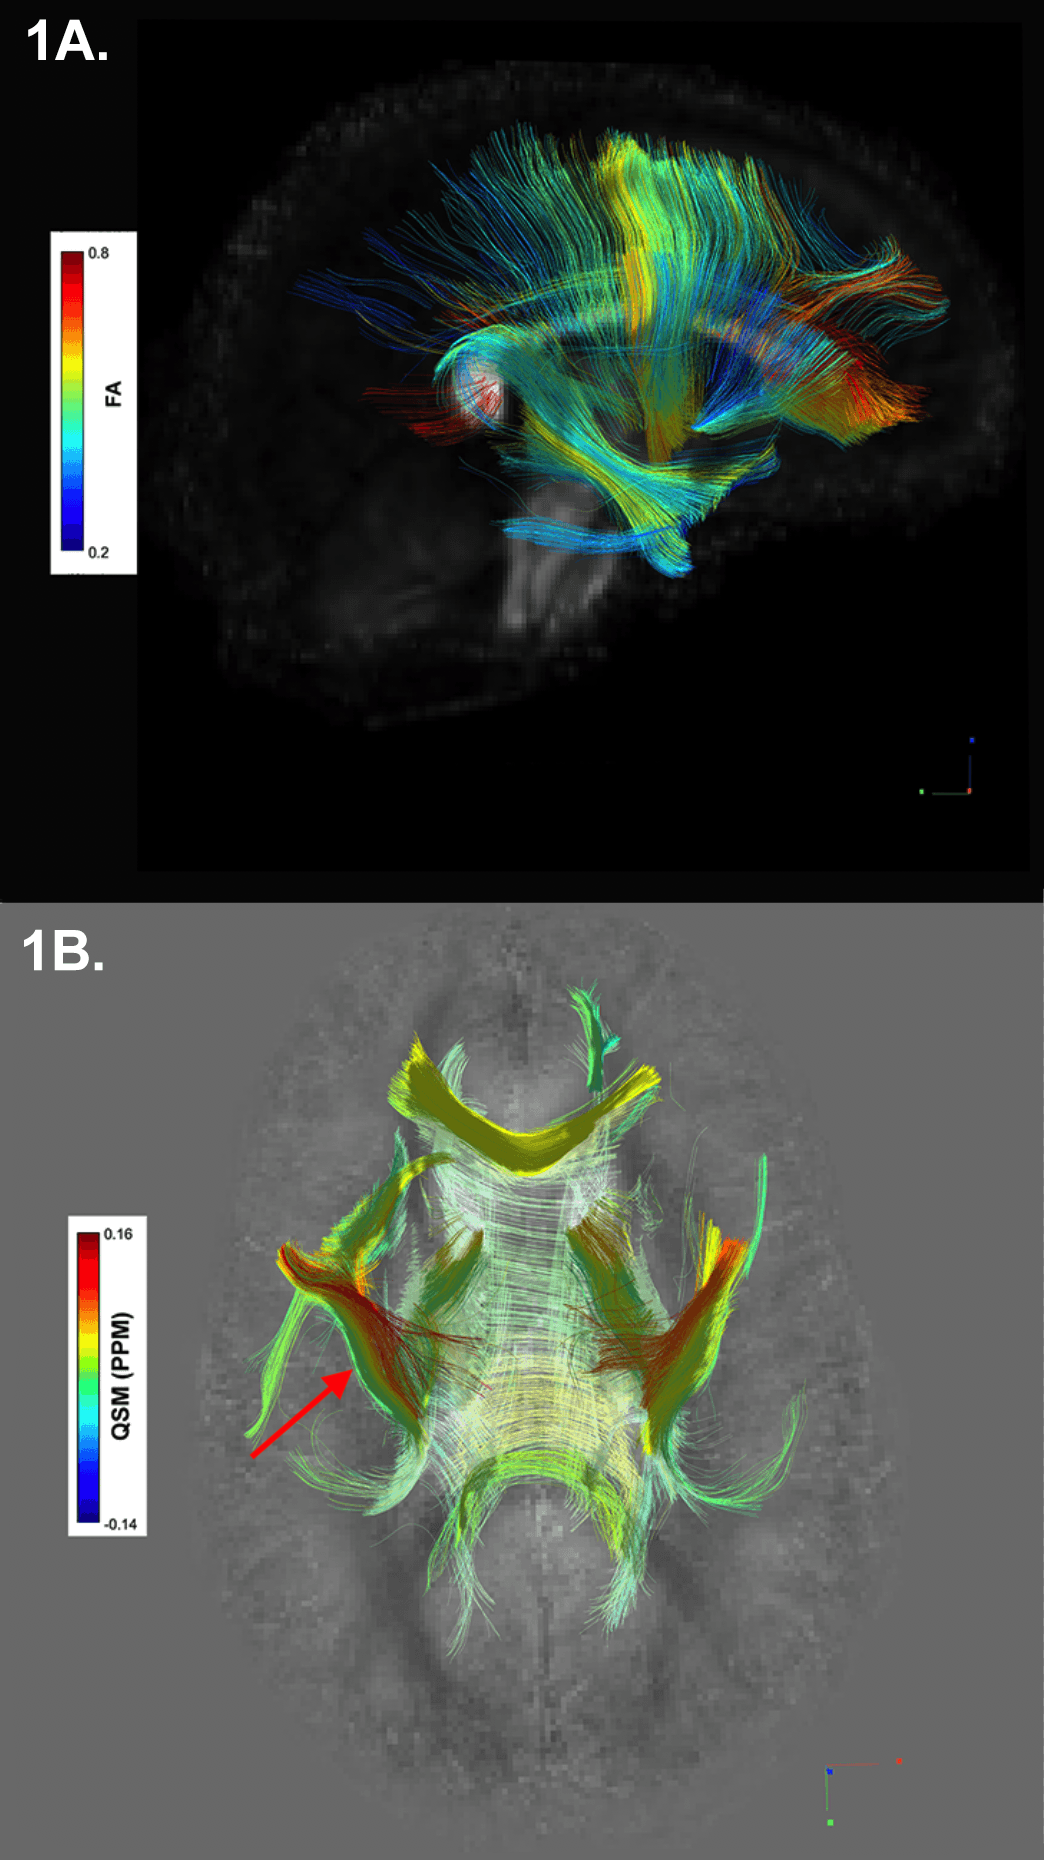
A GE MR950 7T scanner equipped with 32-channel receive coil was used to scan 27 subjects (6 PM ([28,53 years(y)], mean=38.5y), 7 EM ([29,57.5y], mean=42.5y), 14 HC ([28,53y], mean=38.5y)). DTI utilized a diffusion-weighted, single-shot EPI sequence with two-shell 90 direction diffusion acquisition (30 at b=1000s/mm2, 60 at b=2000s/mm2) with isotropic 2 mm resolution. QSM was acquired via a 3D multi-echo gradient-recalled sequence (4 echoes, TE=6/9.5/13/16.5ms, TR=50ms, FA=20°, bandwidth=50kHz, 0.8x0.8x1.2mm resolution, FOV=24x24x15cm). GRAPPA reconstruction was applied to estimate missing k-space information prior to obtaining magnitude and phase images for each coil and echo. Tissue phase was extracted from the raw phase using V-SHARP for background field removal2 and subsequently used to reconstruct the susceptibility map with iLSQR2,3. From the DTI sequence, tensor data were reconstructed for the creation of and spatial normalization to an isotropic 1 mm resolution study-wide population template. DTI-TK was used to estimate a study-specific tensor template to which all subject tensor data were spatially normalized4. Following visual confirmation of proper alignment, spatially normalized tensors from HC were averaged, and the output volume was reformatted for deterministic fiber tracking with FA threshold 0.2, angular threshold 35o, and step size 1 mm5. Seeding regions included the caudate, putamen, globus pallidus (GP), striatum, cingulum, corticospinal tract (CST), and uncinate fasciculus (UF). Diffusion and susceptibility were estimated within each generated group's track (i.e. the white matter fibers passing through the seeding region) for each subject’s left and right hemisphere (Figure 1). False tracks, as identified by DSI Studio’s topology-informed pruning tool, were removed, and remaining fibers were merged to form the final track group for each region6. Susceptibility maps for each subject were non-linearly registered to the same subject’s FA map using FNIRT7 and regional QSM estimates were normalized by within-subject ventricular susceptibility8. The along-tract-stats MATLAB toolbox was used to identify regions of significant variation in FA and QSM between groups by sampling 100 equidistant points per track group9. Group-wise analyses were considered statistically significant for p-values<0.05 after correction for multiple comparisons.Results
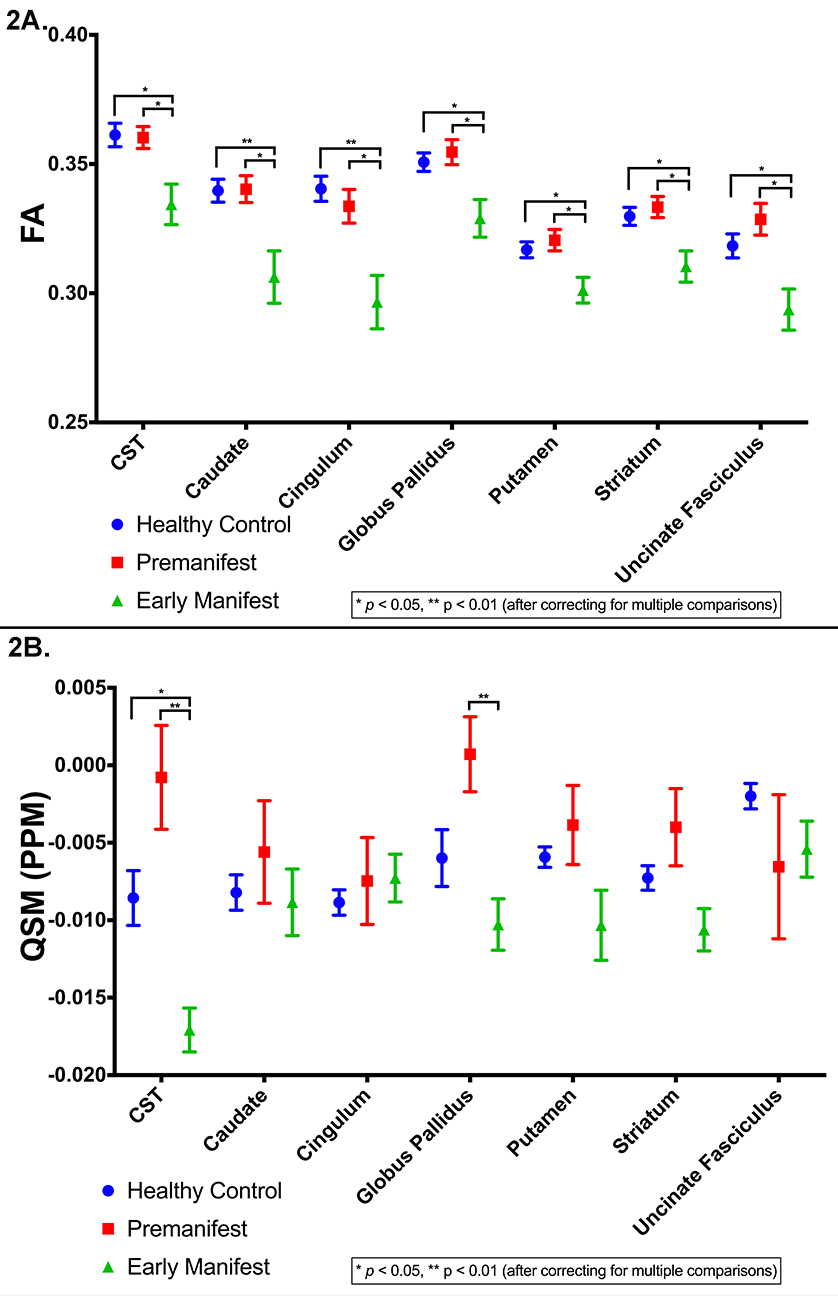
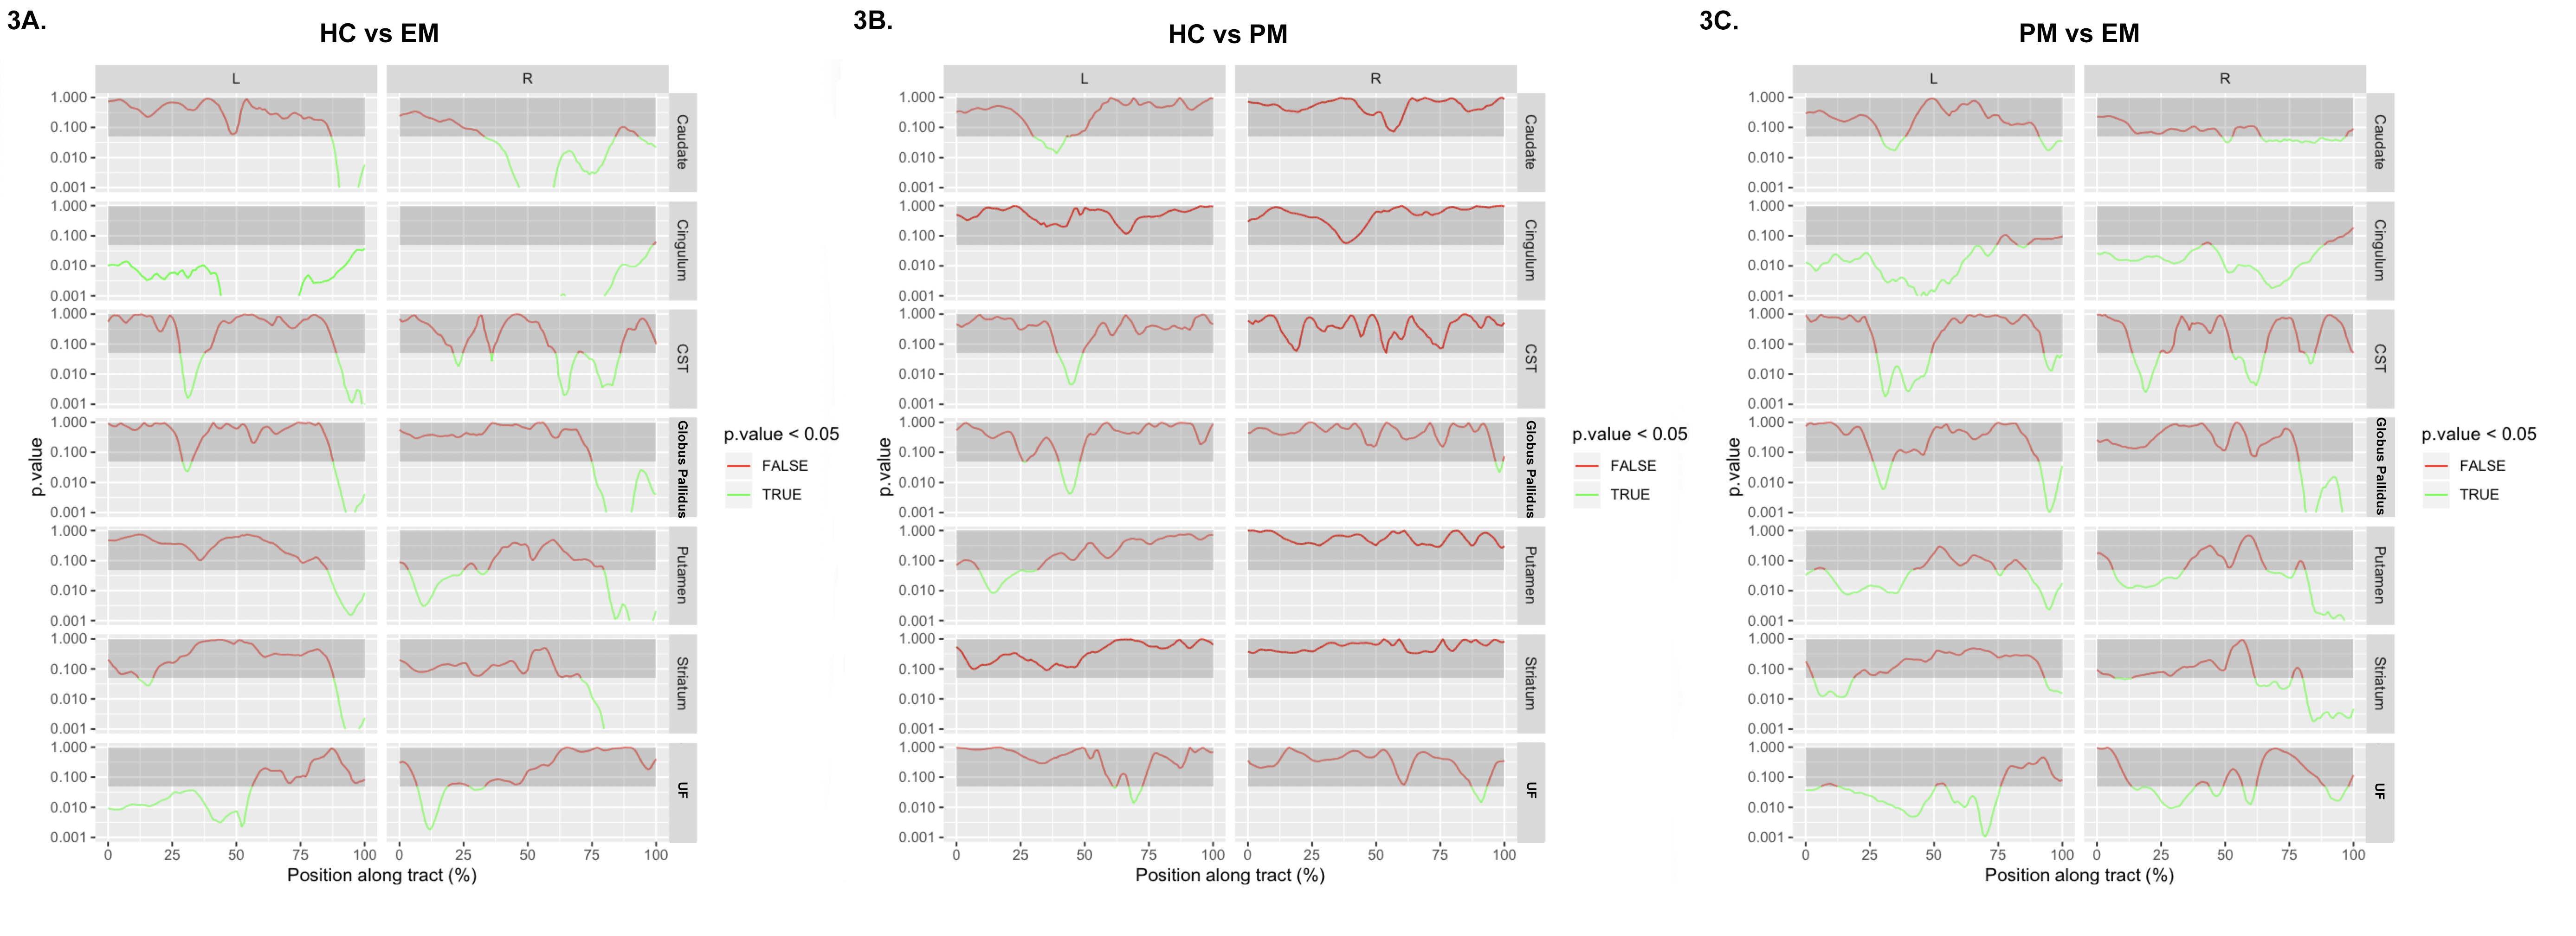
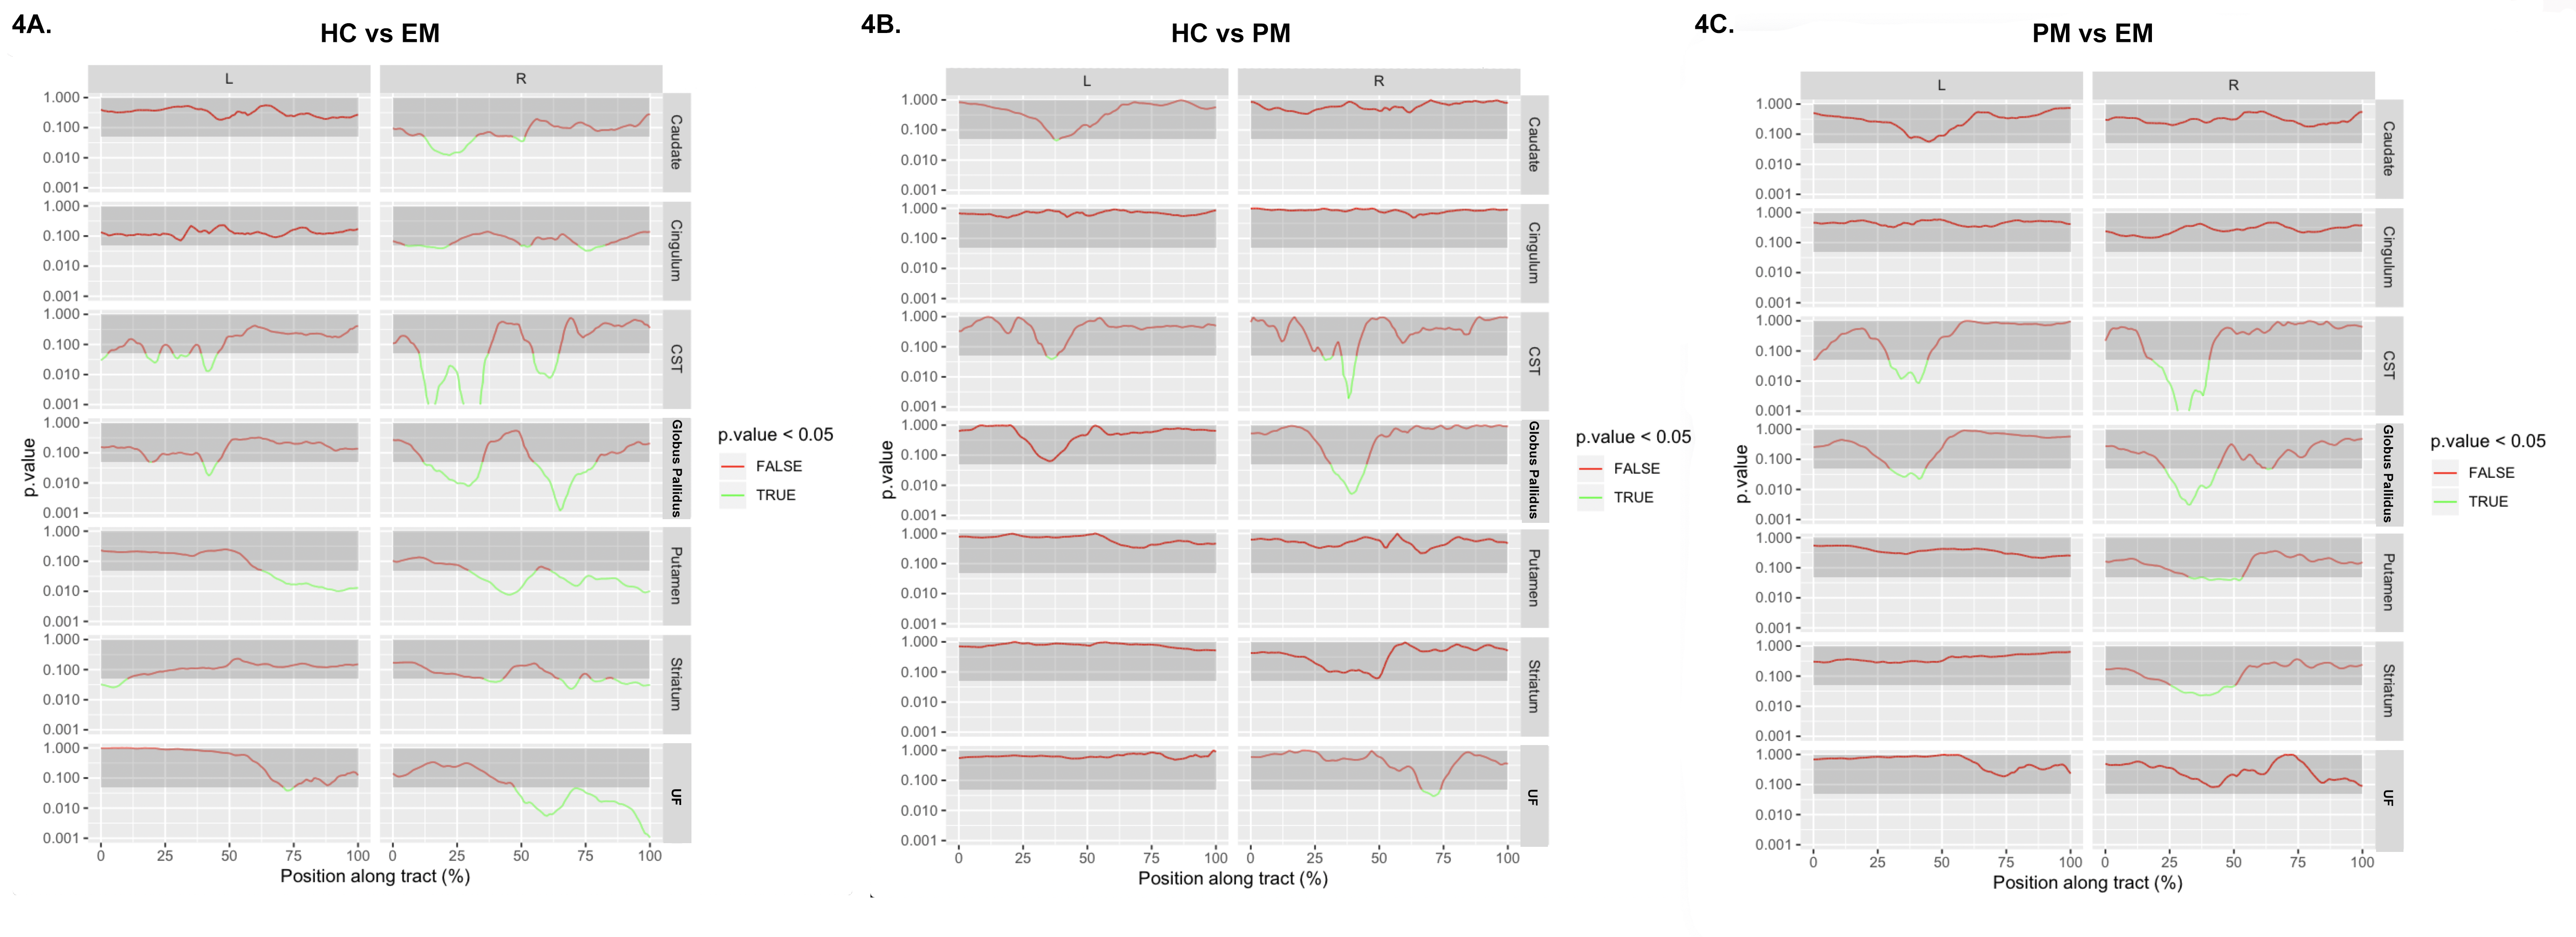
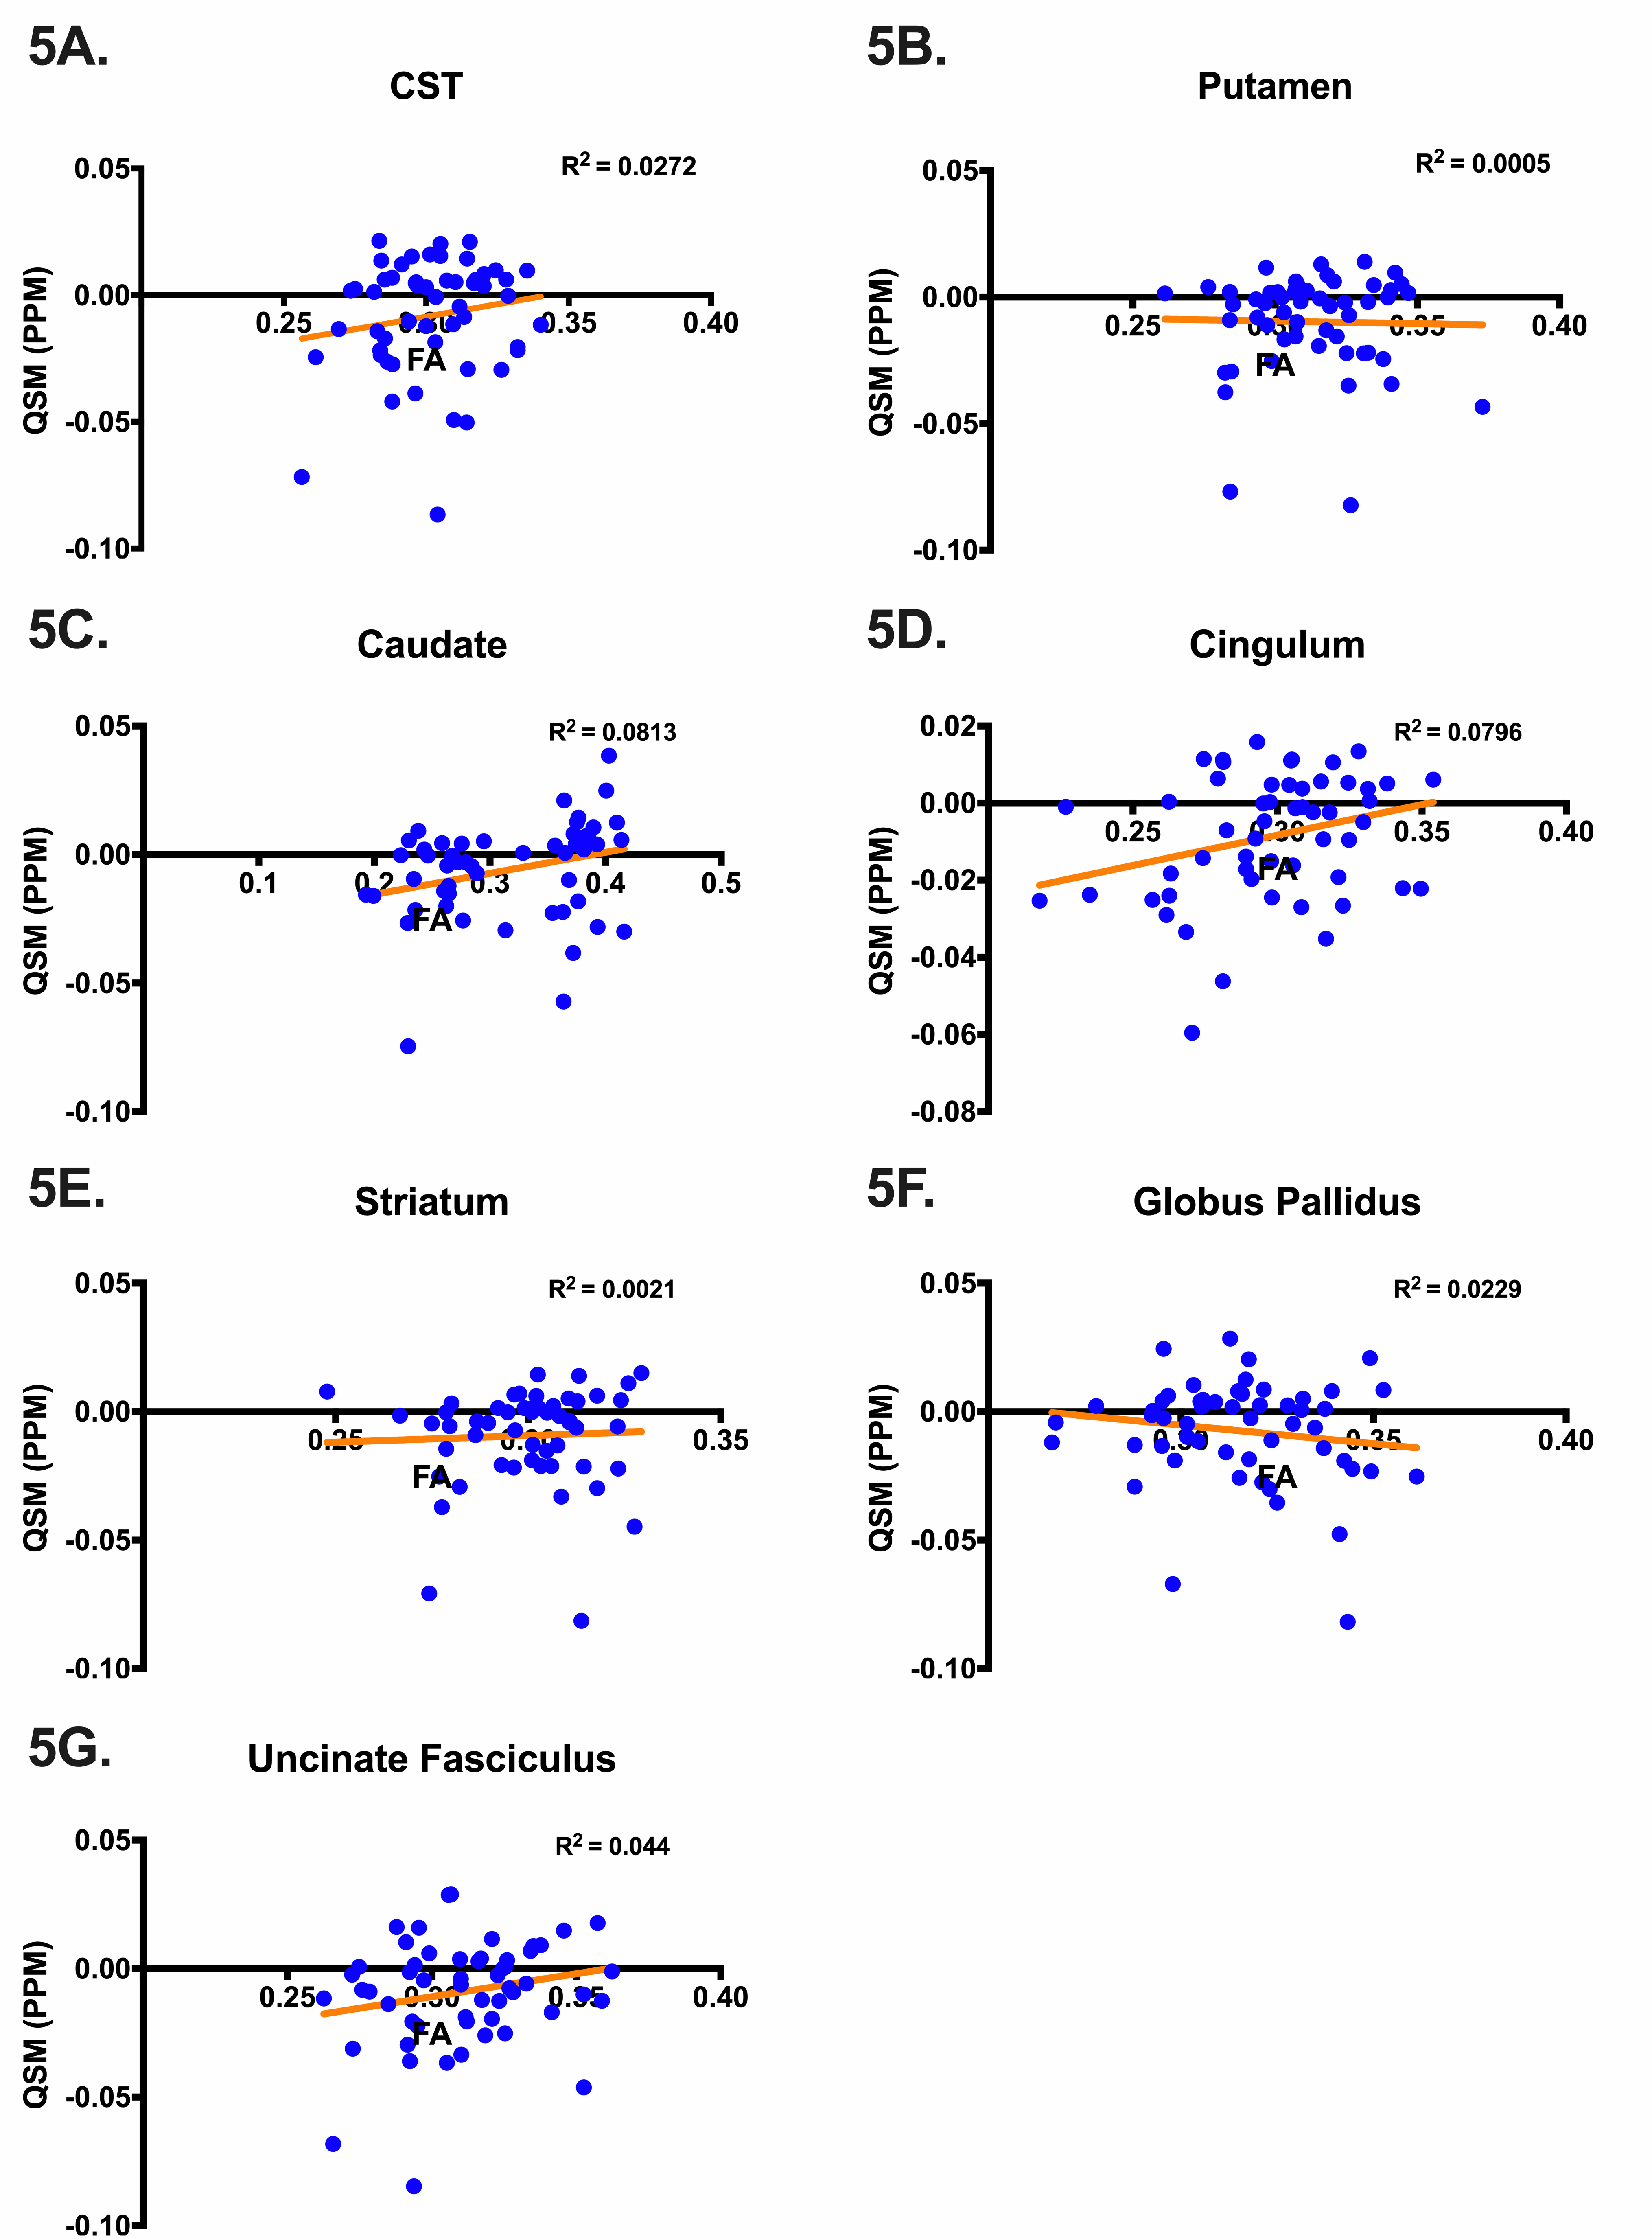
Student’s t-tests found no significant difference in age between groups. FA was significantly reduced for all track regions in EM compared to HC and PM (Figure 2A), similar to what has been observed in prior studies. Motor tracks through the GP and along the CST demonstrated significantly higher susceptibility in PM compared to HC and significantly reduced susceptibility in EM (Figure 2B). Along-tract FA was reduced in EM compared to HC in all regions (Figure 3A). When along-tract FA from PM were compared to HC, significant decreases in FA were found in tract-groups generated from the left-caudate, left-CST, bilateral-GP, left-putamen, and bilateral-UF (Figure 3B). Similar significant along-tract FA variations were identified when PM were compared to EM but were significant bilaterally in all regions (Figure 3C). By comparison, along-tract QSM analysis identified segments of significantly decreased susceptibility in right-caudate, right-cingulum, and bilaterally in the CST, GP, putamen, striatum, and UF in EM (Figure 4A), while in PM, small sections of tract-groups had significantly increased susceptibility in bilateral CST, right-GP, and right-UF (Figure 4B). Along-tract QSM for PM compared to EM found segments of significantly increased susceptibility in right-striatum, right-putamen, and bilateral-CST and GP (Figure 4C). Lastly, almost no correlation was found between FA and QSM in any regions (Figure 5).Discussion & Conclusions
This 7T MRI study focused on characterizing regional differences in diffusion and susceptibility in motor pathways of patients with premanifest and early manifest Huntington’s disease compared to age-matched healthy controls. Bolstering prior studies10,11, tract-averaged analysis found decreased FA in EM compared to both HC and PM in nearly all motor pathways. Along-tract analysis identified segments along the cortico-spinal track that had significantly different susceptibility values among groups which were undetected on the tract-averaged approach. The elevated susceptibility values in PM followed by a significant decrease in susceptibility in EM suggests that iron deposition in the corticospinal track may precede the demyelination that occurs with the onset of symptoms. A lack of correlation between FA and QSM suggests that diffusion and susceptibility imaging provide independent complementary information about neural microstructure. These findings collectively suggest along-tract analysis may enhance the sensitivity of ultra-high-field MRI to early neurodegenerative changes in Huntington’s disease that can precede the onset of symptoms.Acknowledgements
We would like to extend our gratitude to the Departments of Radiology & Biomedical Imaging and Neurology at the University of California, San Francisco, General Electric for supporting this work (R01NS099564), and the patients and volunteers whose time and effort made this study possible.References
1. Simmons JT, Pastakia B, Chase TN, et al. Magnetic resonance imaging in Huntington disease. Am J Neuroradiol 1986;7:25 LP – 28.
2. Li W, Wang N, Yu F, et al. A method for estimating and removing streaking artifacts in quantitative susceptibility mapping. Neuroimage 2015;108:111–22.
3. Fortier V, Levesque IR. Phase processing for quantitative susceptibility mapping of regions with large susceptibility and lack of signal. Magn Reson Med 2018;79:3103–13.
4. Zhang H, Yushkevich PA, Rueckert D, et al. Unbiased White Matter Atlas Construction Using Diffusion Tensor Images. In: Ayache N, Ourselin S, Maeder A, eds. Medical Image Computing and Computer-Assisted Intervention -- MICCAI 2007. Berlin, Heidelberg: Springer Berlin Heidelberg; 2007:211–8.
5. Yeh FC, Verstynen TD, Wang Y, et al. Deterministic diffusion fiber tracking improved by quantitative anisotropy. PLoS One 2013;8:1–16.
6. Yeh FC, Panesar S, Barrios J, et al. Automatic Removal of False Connections in Diffusion MRI Tractography Using Topology-Informed Pruning (TIP). Neurotherapeutics 2019;16:52–8.
7. Jenkinson M, Bannister P, Brady M, et al. Improved Optimization for the Robust and Accurate Linear Registration and Motion Correction of Brain Images. Neuroimage 2002;17:825–41.
8. Straub S, Schneider TM, Emmerich J, et al. Suitable reference tissues for quantitative susceptibility mapping of the brain. Magn Reson Med 2017;78:204–14.
9. Colby JB, Soderberg L, Lebel C, et al. Along-tract statistics allow for enhanced tractography analysis. Neuroimage 2012;59:3227–42.
10. Poudel GR, Stout JC, Domínguez D. JF, et al. Longitudinal change in white matter microstructure in Huntington’s disease: The IMAGE-HD study. Neurobiol Dis 2015;74:406–12.
11. Rosas HD, Wilkens P, Salat DH, et al. Complex spatial and temporally defined myelin and axonal degeneration in Huntington disease. NeuroImage Clin 2018;20:236–42.
Figures