0154
Eliminating chemical shift and relaxation effects in QSM using SMURF imaging
Beata Bachrata1,2,3, Bernhard Strasser1,2,4, Wolfgang Bogner1,2, Albrecht Ingo Schmid1,5, Siegfried Trattnig1,2,3, and Simon Daniel Robinson1,2,6,7
1High Field MR Centre, Medical University of Vienna, Vienna, Austria, 2Department of Biomedical Imaging and Image-guided Therapy, Medical University of Vienna, Vienna, Austria, 3Christian Doppler Laboratory for Clinical Molecular MR Imaging, Vienna, Austria, 4Athinoula A. Martinos Center for Biomedical Imaging, Department of Radiology, Massachusetts General Hospital, Harvard Medical School, Boston, MA, United States, 5Center for Medical Physics and Biomedical Engineering, Medical University of Vienna, Vienna, Austria, 6Centre for Advanced Imaging, The University of Queensland, Brisbane, Australia, 7Department of Neurology, Medical University of Graz, Graz, Austria
1High Field MR Centre, Medical University of Vienna, Vienna, Austria, 2Department of Biomedical Imaging and Image-guided Therapy, Medical University of Vienna, Vienna, Austria, 3Christian Doppler Laboratory for Clinical Molecular MR Imaging, Vienna, Austria, 4Athinoula A. Martinos Center for Biomedical Imaging, Department of Radiology, Massachusetts General Hospital, Harvard Medical School, Boston, MA, United States, 5Center for Medical Physics and Biomedical Engineering, Medical University of Vienna, Vienna, Austria, 6Centre for Advanced Imaging, The University of Queensland, Brisbane, Australia, 7Department of Neurology, Medical University of Graz, Graz, Austria
Synopsis
The accuracy of Quantitative Susceptibility Mapping in fatty regions is adversely affected by the chemical shift effects and by the relaxation rate differences between fat and water. We propose using a recently developed water-fat separation technique based on multi-band principles, Simultaneous Multiple Resonance Frequency (SMURF) imaging, to correct for these effects. SMURF achieves clean water-fat separation in the head-and-neck, allowing the generation of recombined water-fat images fully corrected for chemical shift and relaxation effects. This makes bias-free Quantitative Susceptibility Mapping possible in body regions containing significant amounts of fat, with the free selection of echo-times, receiver bandwidths and flip angles.
Introduction
The high sensitivity of Quantitative Susceptibility Mapping (QSM) to calcifications, haemorrhages, iron depositions, tissue microstructure and tissue oxygenation has lead it being increasingly applied to regions outside the brain, such as head-and-neck1, liver2, breasts3, knee4 and prostate5. The presence of fat in these regions, with a Larmor frequency shift of circa 3.5 ppm6 relative to water, results in errors in field estimates and thereby in estimated susceptibilities. These errors originate from three separate effects. Firstly, the fat image is shifted relative to water along the frequency-encoding direction by $$N_{voxels}=\frac{{\Delta}f}{rBW/pixel},$$ where rBW is the receiver bandwidth and Δf the chemical shift difference. This so-called Type 1 chemical shift (displacement) artefact leads to overlap between water and fat signals, as well as signal voids, making spatial phase-unwrapping problematic. To reduce these shifts, high receiver bandwidths are usually used, despite their detrimental effects on image SNR. Secondly, the different precession frequency of fat gives rise to echo-time dependent phase component (φ), defined as $$\phi={\Delta}f\gamma_wB_0TE,$$ which doesn’t reflect the tissue susceptibility and also causes destructive interference between water and fat signals. To reduce the errors resulting from this Type 2 chemical shift (phase discrepancy) artefact, acquisition at in-phase echo-times is commonly used1,3, although this restricts the choices of TEs. Lastly, differences in relaxation times lead the acquired water and fat signals to be weighted differently, according to the signal equation: $$S=\frac{PD(1-e^{-TR/T_1})e^{-TE/T_2^*\sin\alpha}}{1-e^{-TR/T_1}\cos\alpha},$$with PD being the proton density and α the flip angle. Since the T2* constants of fat and water in homogeneous mixtures are expected to be similar7, T2* effects can be neglected. The T1 relaxation differences, however, bias the field estimation in mixed water-fat voxels. To minimize this bias, small flip angles have to be used, resulting in poor SNR.
Recently, a single-echo water-fat separation technique based on multi-band principles has been proposed and applied to correct the chemical shift displacement artefact in conventional (magnitude-based) MR imaging8. Here, we propose to use this technique, to which we refer as Simultaneous Multiple Resonance Frequency (SMURF) imaging6, to correct for the effects of chemical shift and relaxation differences of fat in QSM. In the SMURF method, multi-band pulses9 simultaneously but separately excite fat and water and CAIPIRINHA10,11 with parallel imaging reconstruction12,13 separate the corresponding signals. The fat signal is corrected for chemical shift displacement, for phase discrepancy relative to water and for T1 relaxation difference and recombined with the water signal. This generates water-fat images free of chemical shift and T1 relaxation effects, allowing bias-free Quantitative Susceptibility Mapping in regions containing significant amounts of fat, and unrestricted choices of echo-times, receiver bandwidths and flip angles.
Methods
Coronal head-and-neck images of a healthy volunteer were acquired using 3T Siemens PRISMA scanner and 64-channel head-and-neck coil. 3D GRE SMURF images were acquired with: TE=12.2ms, TR=26ms, FA=15°, FOV=240x240mm, 240 slices, resolution=1.1x1.1x1.1mm, rBW/pixel=150Hz, phase-encoding direction right-left and with parallel imaging acceleration of R=3 and PF=6/8 resulting in TA=5min39s. A low resolution dual‑echo GRE scan was also acquired for coil combination14 and the first echo image was used for water-fat unaliasing with slice-GRAPPA11. The unaliased fat signal was shifted by 2.93 voxels (applied in k-space) to reverse the chemical shift displacement, corrected for the 0.74π phase discrepancy relative to water and corrected for the T1 relaxation-rate-related increased signal weighting relative to water by a factor of 1.87. Susceptibility maps were calculated from the recombined SMURF water-fat images using Laplacian unwrapping15, background-field removal with PDF16 and susceptibility calculation by STAR17 using the Sepia toolbox18. The susceptibility maps estimated from the water-fat images recombined without and with application of individual correction steps were compared.Results
The SMURF method generated cleanly separated fat and water images of the head-and-neck (Figure 2), allowing the elimination of chemical shift and T1 relaxation effects (Figure 3). The susceptibility maps which were corrected for both Type 1 and Type 2 chemical shift artefact (Figure 4, centre left and left) showed high correspondence between the strongly paramagnetic areas and the locations of fatty fasciae in the neck (Figure 2). Without Type 1 chemical shift correction (Figure 4, centre left), the susceptibility maps in and around fatty fasciae were more blurred, leading to differences in susceptibility values of up to 0.3 ppm in some areas, i.e. 100% (Figure 5, left). If no Type 2 chemical shift correction was applied, the susceptibility values in fatty fasciae were erroneously estimated as being negative (Figure 4, left). The correction of the T1 relaxation effects (Figure 4, right) had the smallest effect of all corrections (Figure 5, right), as not many mixed water-fat voxels were present.Discussion and Conclusion
The accuracy of Quantitative Susceptibility Mapping in fatty region is adversely affected by chemical shift artefacts of Type 1 (displacement) and Type 2 (phase discrepancy) and by the T1 relaxation differences between water and fat. We have shown that a new water-separation technique, Simultaneous Multiple Resonance Frequency (SMURF) imaging6, allows all of these effects to be corrected, making chemical shift and T1 relaxation effects bias-free Quantitative Susceptibility Mapping viable. The SMURF is expected to increase the accuracy of QSM in body regions containing significant amounts of fatty tissue, such as head-and-neck, liver and breasts.Acknowledgements
This study was funded by the Austrian Science Fund (FWF) project 31452. SR was additionally supported by the Marie Skłodowska-Curie Action MS-fMRI-QSM 794298. The financial support by the Austrian Federal Ministry for Digital and Economic Affairs and the National Foundation for Research, Technology and Development is gratefully acknowledged.References
- Karsa A. Optimising MRI Magnetic Susceptibility Mapping for Applications in Challenging Regions of the Body. 2018.
- Sharma SD, Fischer R, Schoennagel BP, et al. MRI-based quantitative susceptibility mapping (QSM) and R2* mapping of liver iron overload: Comparison with SQUID-based biomagnetic liver susceptometry: QSM and R2*: Comparison With SQUID. Magn Reson Med. 2017;78(1):264-270. doi:10.1002/mrm.26358
- Schweser F, Herrmann K-H, Deistung A, et al. Quantitative magnetic susceptibility mapping ( QSM ) in breast disease reveals additional information for MR-based characterization of carcinoma and calcification. In: Proceedings of the 19th Annual Meeting of ISMRM. Montreal, Quebec, Canada, 2011. p. 1014.
- Wei H, Dibb R, Decker K, et al. Investigating magnetic susceptibility of human knee joint at 7 tesla. Magn Reson Med. 2017.
- Straub S, Laun FB, Emmerich J, et al. Potential of quantitative susceptibility mapping for detection of prostatic calcifications. J Magn Reson Imaging JMRI. 2017;45(3):889-898. doi:10.1002/jmri.25385
- Ren J, Dimitrov I, Sherry AD, Malloy CR. Composition of adipose tissue and marrow fat in humans by 1H NMR at 7 Tesla. J Lipid Res. 2008;49(9):2055-2062. doi:10.1194/jlr.D800010-JLR200
- Yu H, McKenzie CA, Shimakawa A, et al. Multiecho reconstruction for simultaneous water-fat decomposition and T2* estimation. J Magn Reson Imaging. 2007;26(4):1153-1161. doi:10.1002/jmri.21090
- Bachrata B, Strasser B, Schmid AI, Bogner W, Trattnig S, Robinson SD. Eliminating chemical shift artefact using simultaneous, separate water and fat excitation combined with CAIPIRINHA. In: Proceedings of the 27th Annual Meeting of ISMRM. Montreal, Quebec, Canada, 2019. p. 4005.
- Müller S. Multifrequency selective rf pulses for multislice MR imaging. Magn Reson Med. 1988;6(3):364-371.
- Breuer FA, Blaimer M, Heidemann RM, Mueller MF, Griswold MA, Jakob PM. Controlled aliasing in parallel imaging results in higher acceleration (CAIPIRINHA) for multi-slice imaging. Magn Reson Med. 2005;53(3):684-691. doi:10.1002/mrm.20401
- Setsompop K, Gagoski BA, Polimeni JR, Witzel T, Wedeen VJ, Wald LL. Blipped-Controlled Aliasing in Parallel Imaging (blipped-CAIPI) for simultaneous multi-slice EPI with reduced g-factor penalty. Magn Reson Med. 2012;67(5):1210-1224. doi:10.1002/mrm.23097
- Pruessmann K, Weiger M, Scheidegger M, Boesiger P. SENSE: sensitivity encoding for fast MRI. Magn Reson Med. 1999;42(5):952-962.
- Griswold MA, Jakob PM, Heidemann RM, et al. Generalized autocalibrating partially parallel acquisitions (GRAPPA). Magn Reson Med. 2002;47(6):1202-1210.
- Eckstein K, Dymerska B, Bachrata B, et al. Computationally Efficient Combination of Multi-channel Phase Data From Multi-echo Acquisitions (ASPIRE): Combination of Multi-Channel Phase Data from Multi-Echo Acquisitions (ASPIRE). Magn Reson Med. 2018;79(6):2996-3006. doi:10.1002/mrm.26963
- Schofield MA, Zhu Y. Fast phase unwrapping algorithm for interferometric applications. Opt Lett. 2003;28(14):1194-1196.
- Liu T, Khalidov I, de Rochefort L, et al. A novel background field removal method for MRI using projection onto dipole fields (PDF). NMR Biomed. 2011;24(9):1129-1136. doi:10.1002/nbm.1670
- Li W, Wang N, Yu F, et al. A method for estimating and removing streaking artifacts in quantitative susceptibility mapping. NeuroImage. 2015;108:111-122. doi:10.1016/j.neuroimage.2014.12.043
- Chan K-S, Marques J. SEPIA - SuscEptibility mapping PIpeline tool for phAse images. In: Proceedings of the 27th Annual Meeting of ISMRM. Montreal, Quebec, Canada, 2019. p. 4827.
Figures
Figure 1: Illustration of steps in the chemical shift and
relaxation effects corrections using Simultaneous Multiple Resonance Frequency (SMURF) imaging method. Water and CAIPIRINHA‑shifted fat images are unaliased using
parallel imaging reconstruction techniques (Step 1). The fat image is corrected
for phase discrepancy relative to water, shifted to reverse chemical shift displacement
and intensity corrected for the T1 relaxation difference (Step 2). Recombination
with the water image (Step 3) yields chemical shift and relaxation effects-free
water-fat image.
Figure 2: Separated
water and fat images obtained using Simultaneous Multiple Resonance Frequency (SMURF) imaging method. Note the clear separation over the entire FOV.
Figure 3: Illustration of the effects of individual
chemical shift and relaxation rate corrections on recombined water-fat SMURF images. Type 2 correction removes the phase discrepancy between water and fat
(E vs F), eliminating destructive interference
in mixed water-fat voxels (A vs B). Type 1
correction removes water-fat misalignment, reducing the areas of signal voids (B vs C), and the correction for T1
relaxation differences makes the signal phase reflect the proportions of the
contributing tissues (G vs H).
Figure 4: Illustration of the effects of individual
chemical shift and relaxation rate corrections on estimated susceptibility maps; left: no correction applied, centre left: Type 2 chemical shift artefact
(CSA) corrected, centre right: Type 1 & Type 2 CSA corrected, right: Type 1
& Type 2 CSA and T1 relaxation effects corrected. Without
corrections, susceptibility values in the fatty fasciae are negative (diamagnetic).
With the corrections applied, strong correspondence between the positive
(paramagnetic) areas of susceptibility map and locations of fatty fasciae is
achieved.
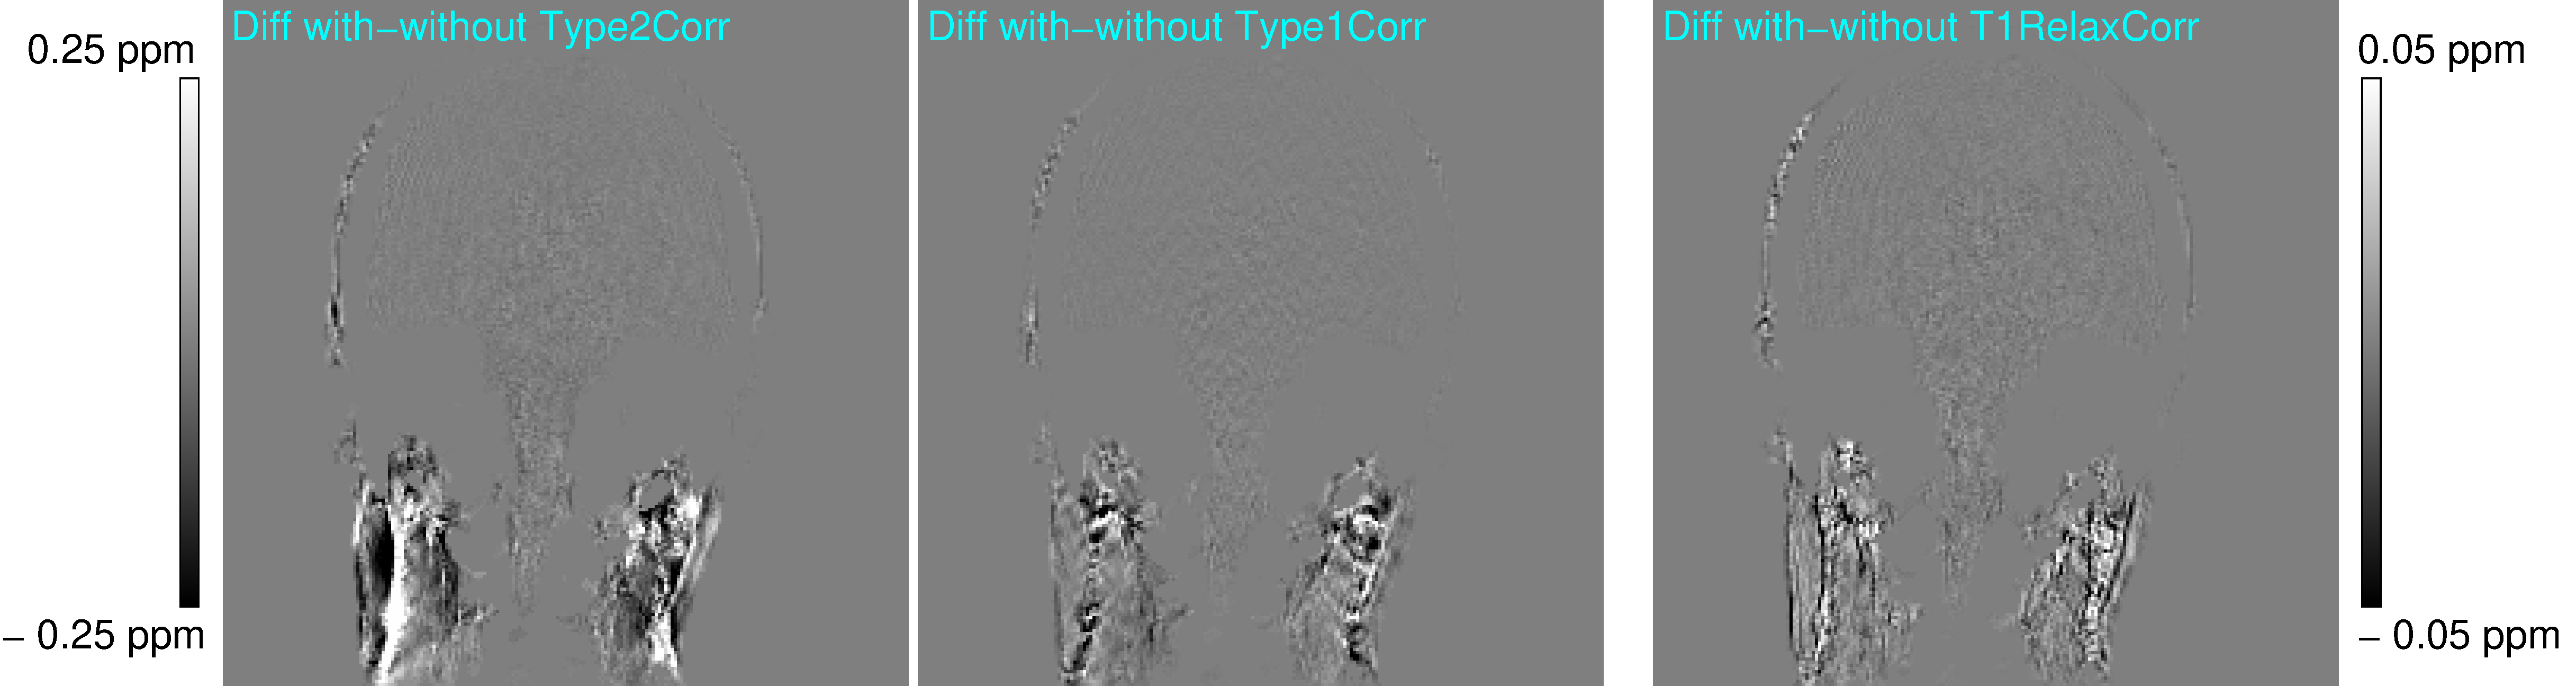
Figure 5: Difference images between
susceptibility maps estimated without and with application of the individual
corrections; left: effects of correction of Type 2 chemical shift artefact
(CSA), centre: effects of correction of Type CSA, right: effects of correction of
T1 relaxation differences. Type 1 and Type 2 CSA corrections show
significant effects in the areas of fatty fasciae and their proximity. The
effects of T1 relaxation correction are smaller, mostly visible at
the water-fat boarders. Note the different scale for the T1
relaxation correction (right image).