0153
Quantitative susceptibility mapping in UK Biobank brain imaging: pipeline and preliminary results in 2400 subjects1Wellcome Centre for Integrative Neuroimaging, FMRIB, Nuffield Department of Clinical Neurosciences, University of Oxford, Oxford, United Kingdom, 2Sir Peter Mansfield Imaging Centre, School of Physics and Astronomy, University of Nottingham, Nottingham, United Kingdom, 3Department of Statistics and Actuarial Science, Simon Fraser University, Vancouver, BC, Canada
Synopsis
UK Biobank aims to scan 100,000 participants and its brain protocol acquires susceptibility-weighted MRI (swMRI). To date, only the swMRI magnitude data were processed to produce T2* maps. The aim of this work is to develop a robust processing pipeline for QSM using the acquired swMRI phase data. We ran this pipeline on 2408 volunteers and report some preliminary results, including age-dependent curves and genetic associations. Significant correlations were found between susceptibility and age in subcortical structures. QSM discovered replicable genetic associations previously identified in T2*. Our results suggest that there is unique information in susceptibility maps compared to T2*.
Introduction
UK Biobank study will acquire brain (and body) imaging in 100,000 participants (40,000 to date), as well as extensive questionnaires, physical measures, biological samples, and long-term health outcomes1,2.The UK Biobank brain protocol acquires susceptibility-weighted MRI (swMRI)2,3. To date, only the swMRI magnitude data were processed, producing T2* maps3. The UK Biobank database provides T2*-based image-derived phenotypes (IDPs, summary imaging measures) in 14 subcortical structures2. A genome-wide association study (GWAS) conducted on these T2* IDPs identified correlations with genes known to affect iron transport, storage and accumulation4.
To date, no processing has been performed on the swMRI phase images, which generally requires more sophisticated processing pipelines5. Quantitative susceptibility mapping (QSM), which utilizes phase data from swMRI, has demonstrated increased sensitivity and specificity to iron concentration compared to T2*6.
The aim of this work is to develop a QSM processing pipeline for the UK Biobank. We have run this pipeline on data from 2408 volunteers to produce susceptibility maps and new IDPs. We report some preliminary results, including age-dependent curves and genetic associations, which suggest that QSM will provide complementary information to the existing T2* IDPs.
Methods
Data acquisitionBrain imaging data have been acquired on identical 3T Siemens Skyras at four sites across the UK. swMRI data was collected with a 3D double-echo GRE sequence (TE1/TE2/TR=9.4/20/27 ms, 0.8x0.8x3 mm3, matrix 256x288x48). Further details can be found in2,3. We processed swMRI data from 2408 subjects (48-80years, 1277 female) from a single scan site.
QSM processing pipeline
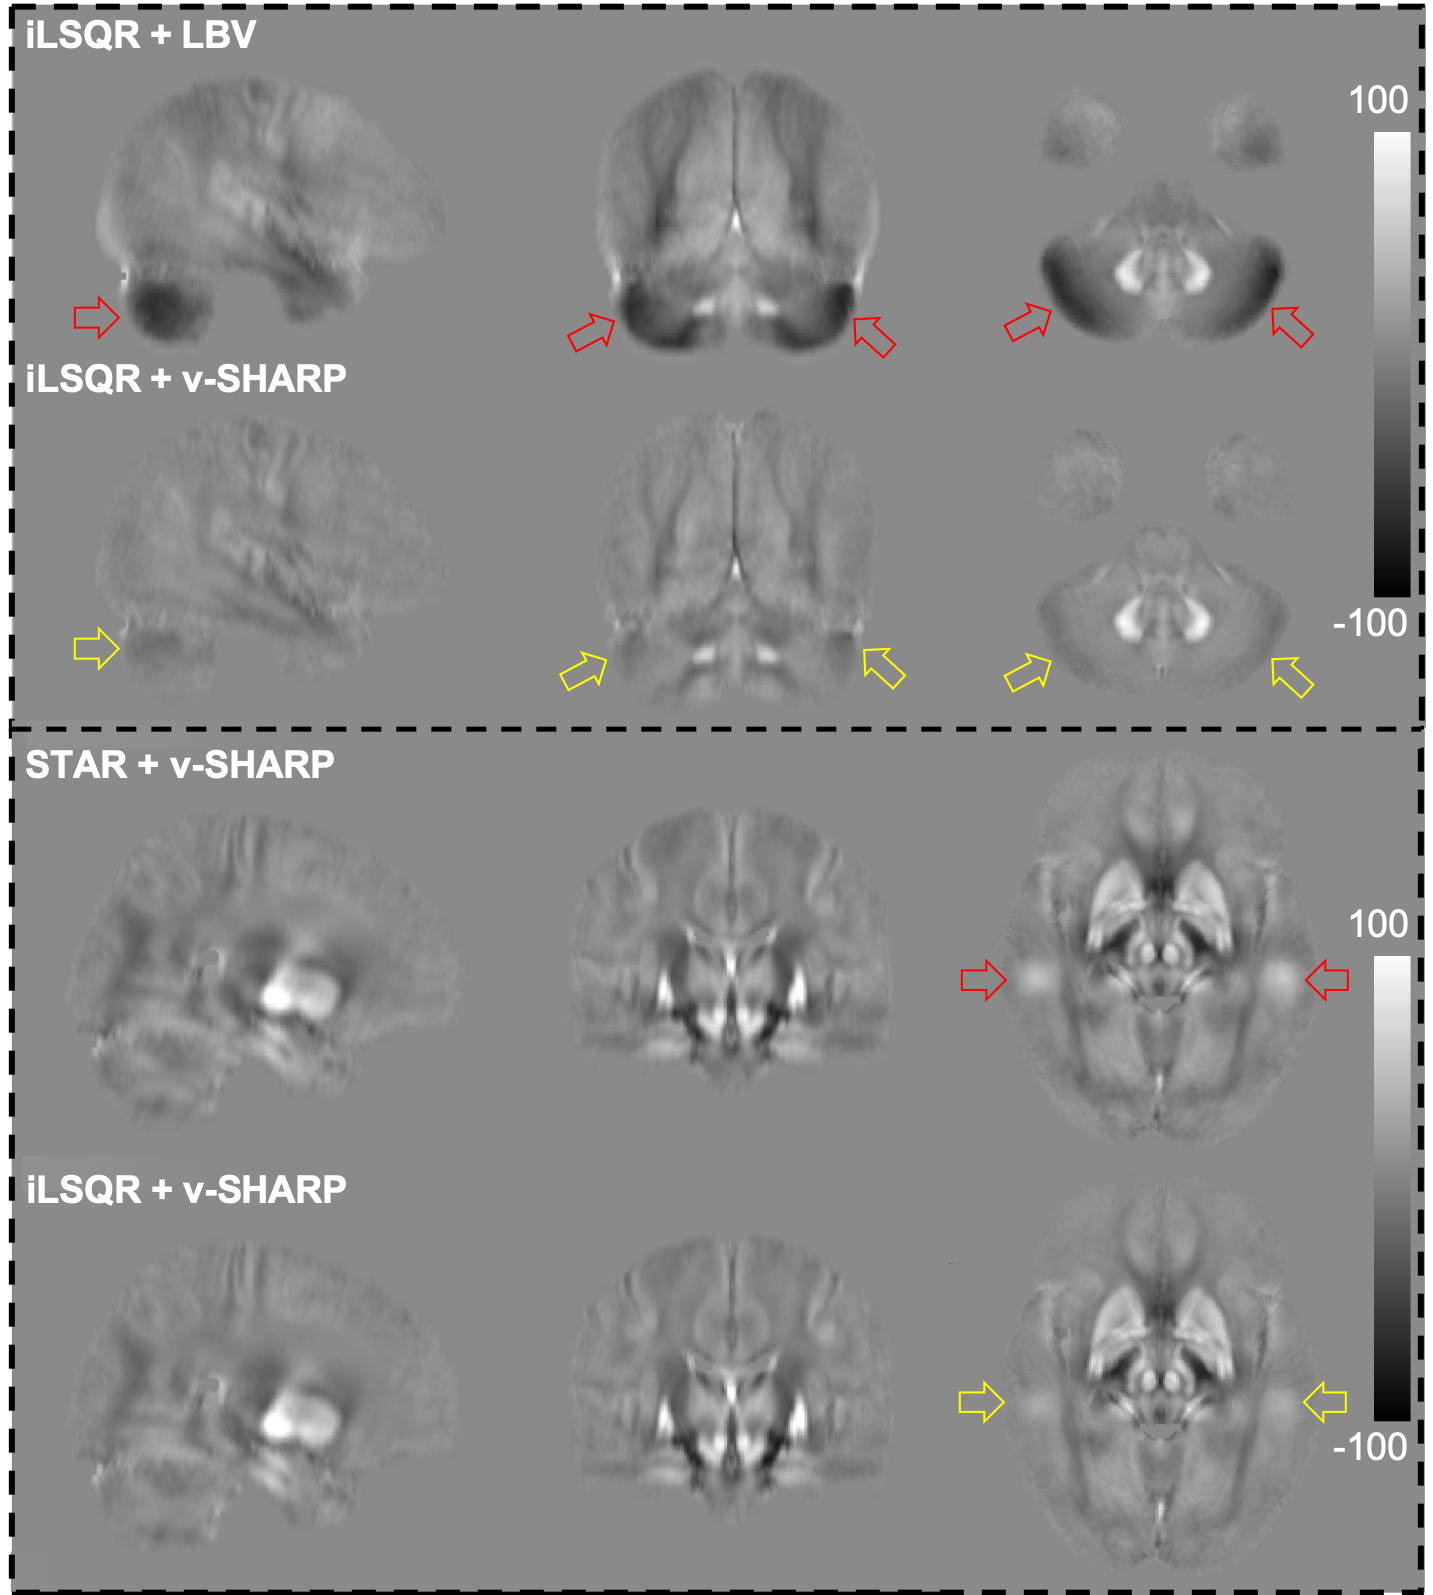
Phase images from individual coils were combined using MCPC-3D-S7 and unwrapped using a Laplacian-method8, two echoes were subsequently combined9,10. Brain masks from the standard Biobank pipeline3 were updated to remove voxels with unreliable phase5. Using 50 test subjects, we evaluated all four combinations of two background field removal methods (LBV11 and v-SHARP12 with 12mm kernel) and two dipole inversion methods (iLSQR13 and STAR-QSM14). The combination of v-SHARP and iLSQR were found to be the most robust (Figure 1), and were used for analysis of all 2408 subjects.
Image analysis
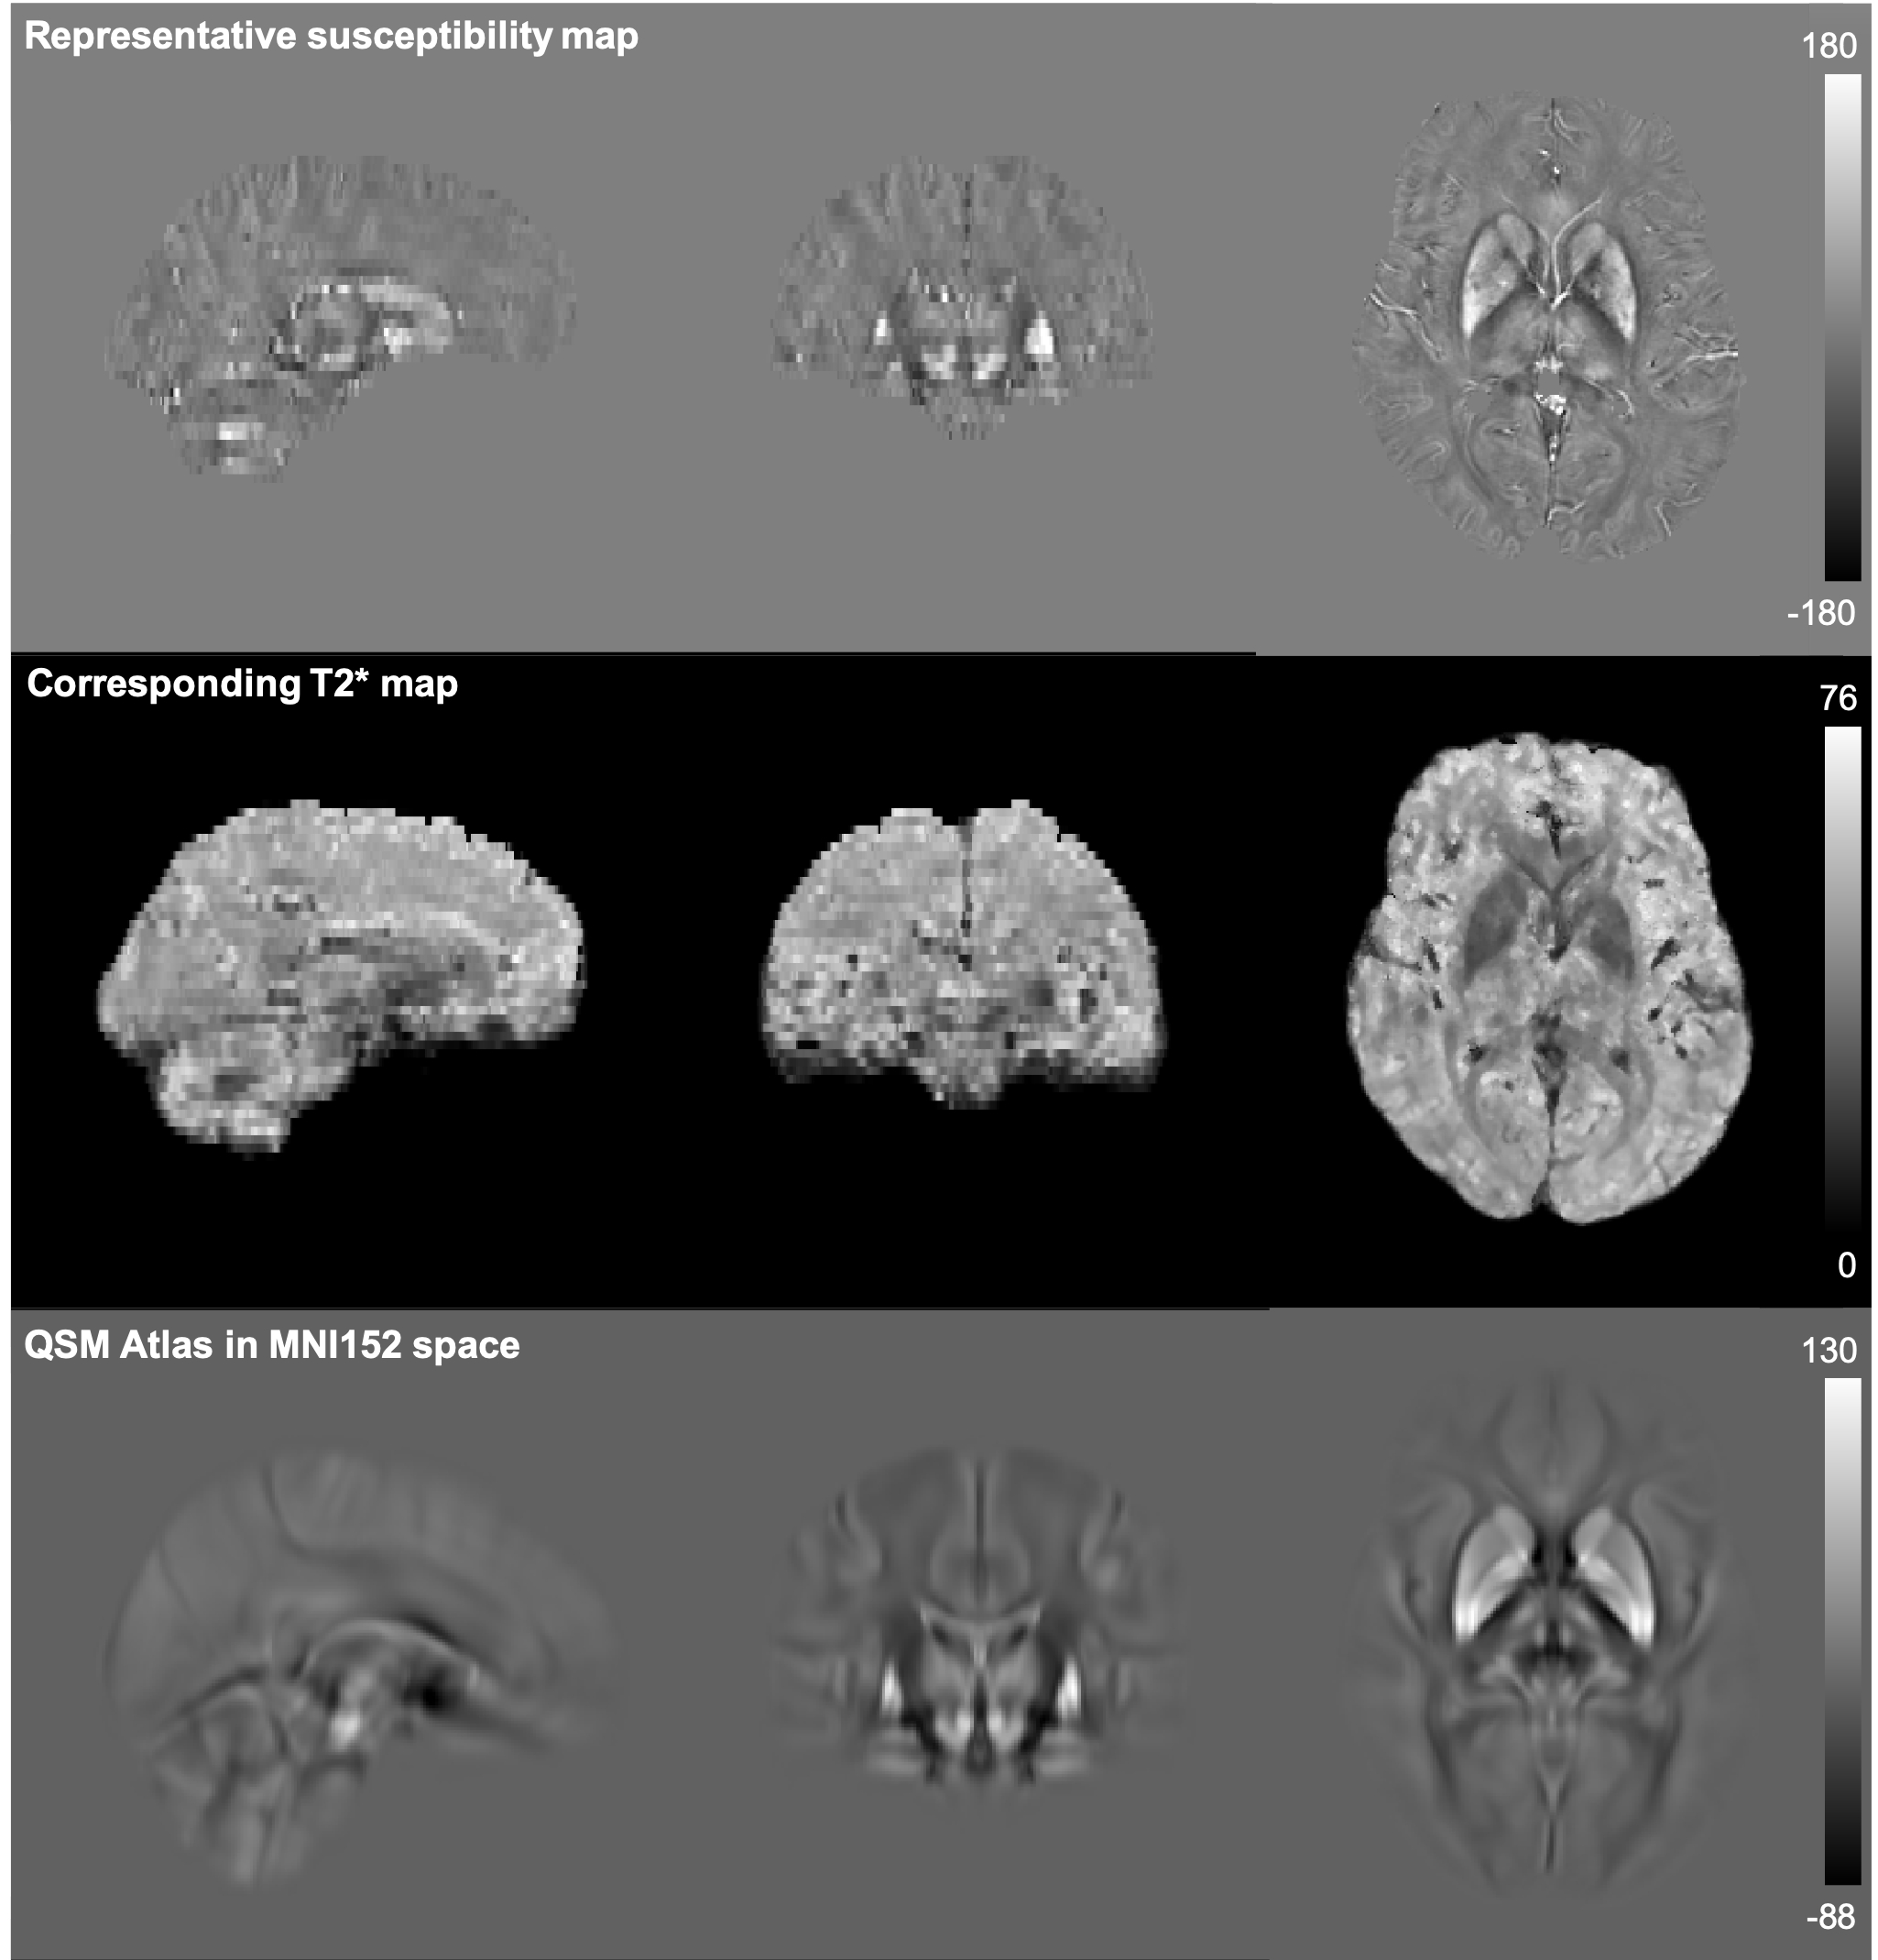
Susceptibility maps were registered to standard space using the existing Biobank non-linear registration pipeline3,15,16,17. IDPs consisting of mean and median susceptibility values were extracted from 16 subcortical structures (right and left for thalamus, caudate, putamen, pallidum, hippocampus, amygdala, accumbens and substantia nigra). A group-averaged susceptibility atlas was generated in MNI space (Figure 2).
Association analysis
UK Biobank is an ageing cohort, and as such the effects of age are of particular interest. Pearson correlation was used to assess the relationship between age and median susceptibility values in subcortical structures after quantile normalisation and correcting for confounds (sex, head size, etc)2.
A GWAS was carried out using the new QSM-based IDPs, as well as previously-described T2*-based IDPs from these same subjects (48 IDPs in total). We followed the approach used previously4 (including selection of subjects, quality thresholding and de-confounding). Associations were identified in a discovery sample of 1355 subjects, and tested for replication in a sample of 672 left-out subjects.
Results
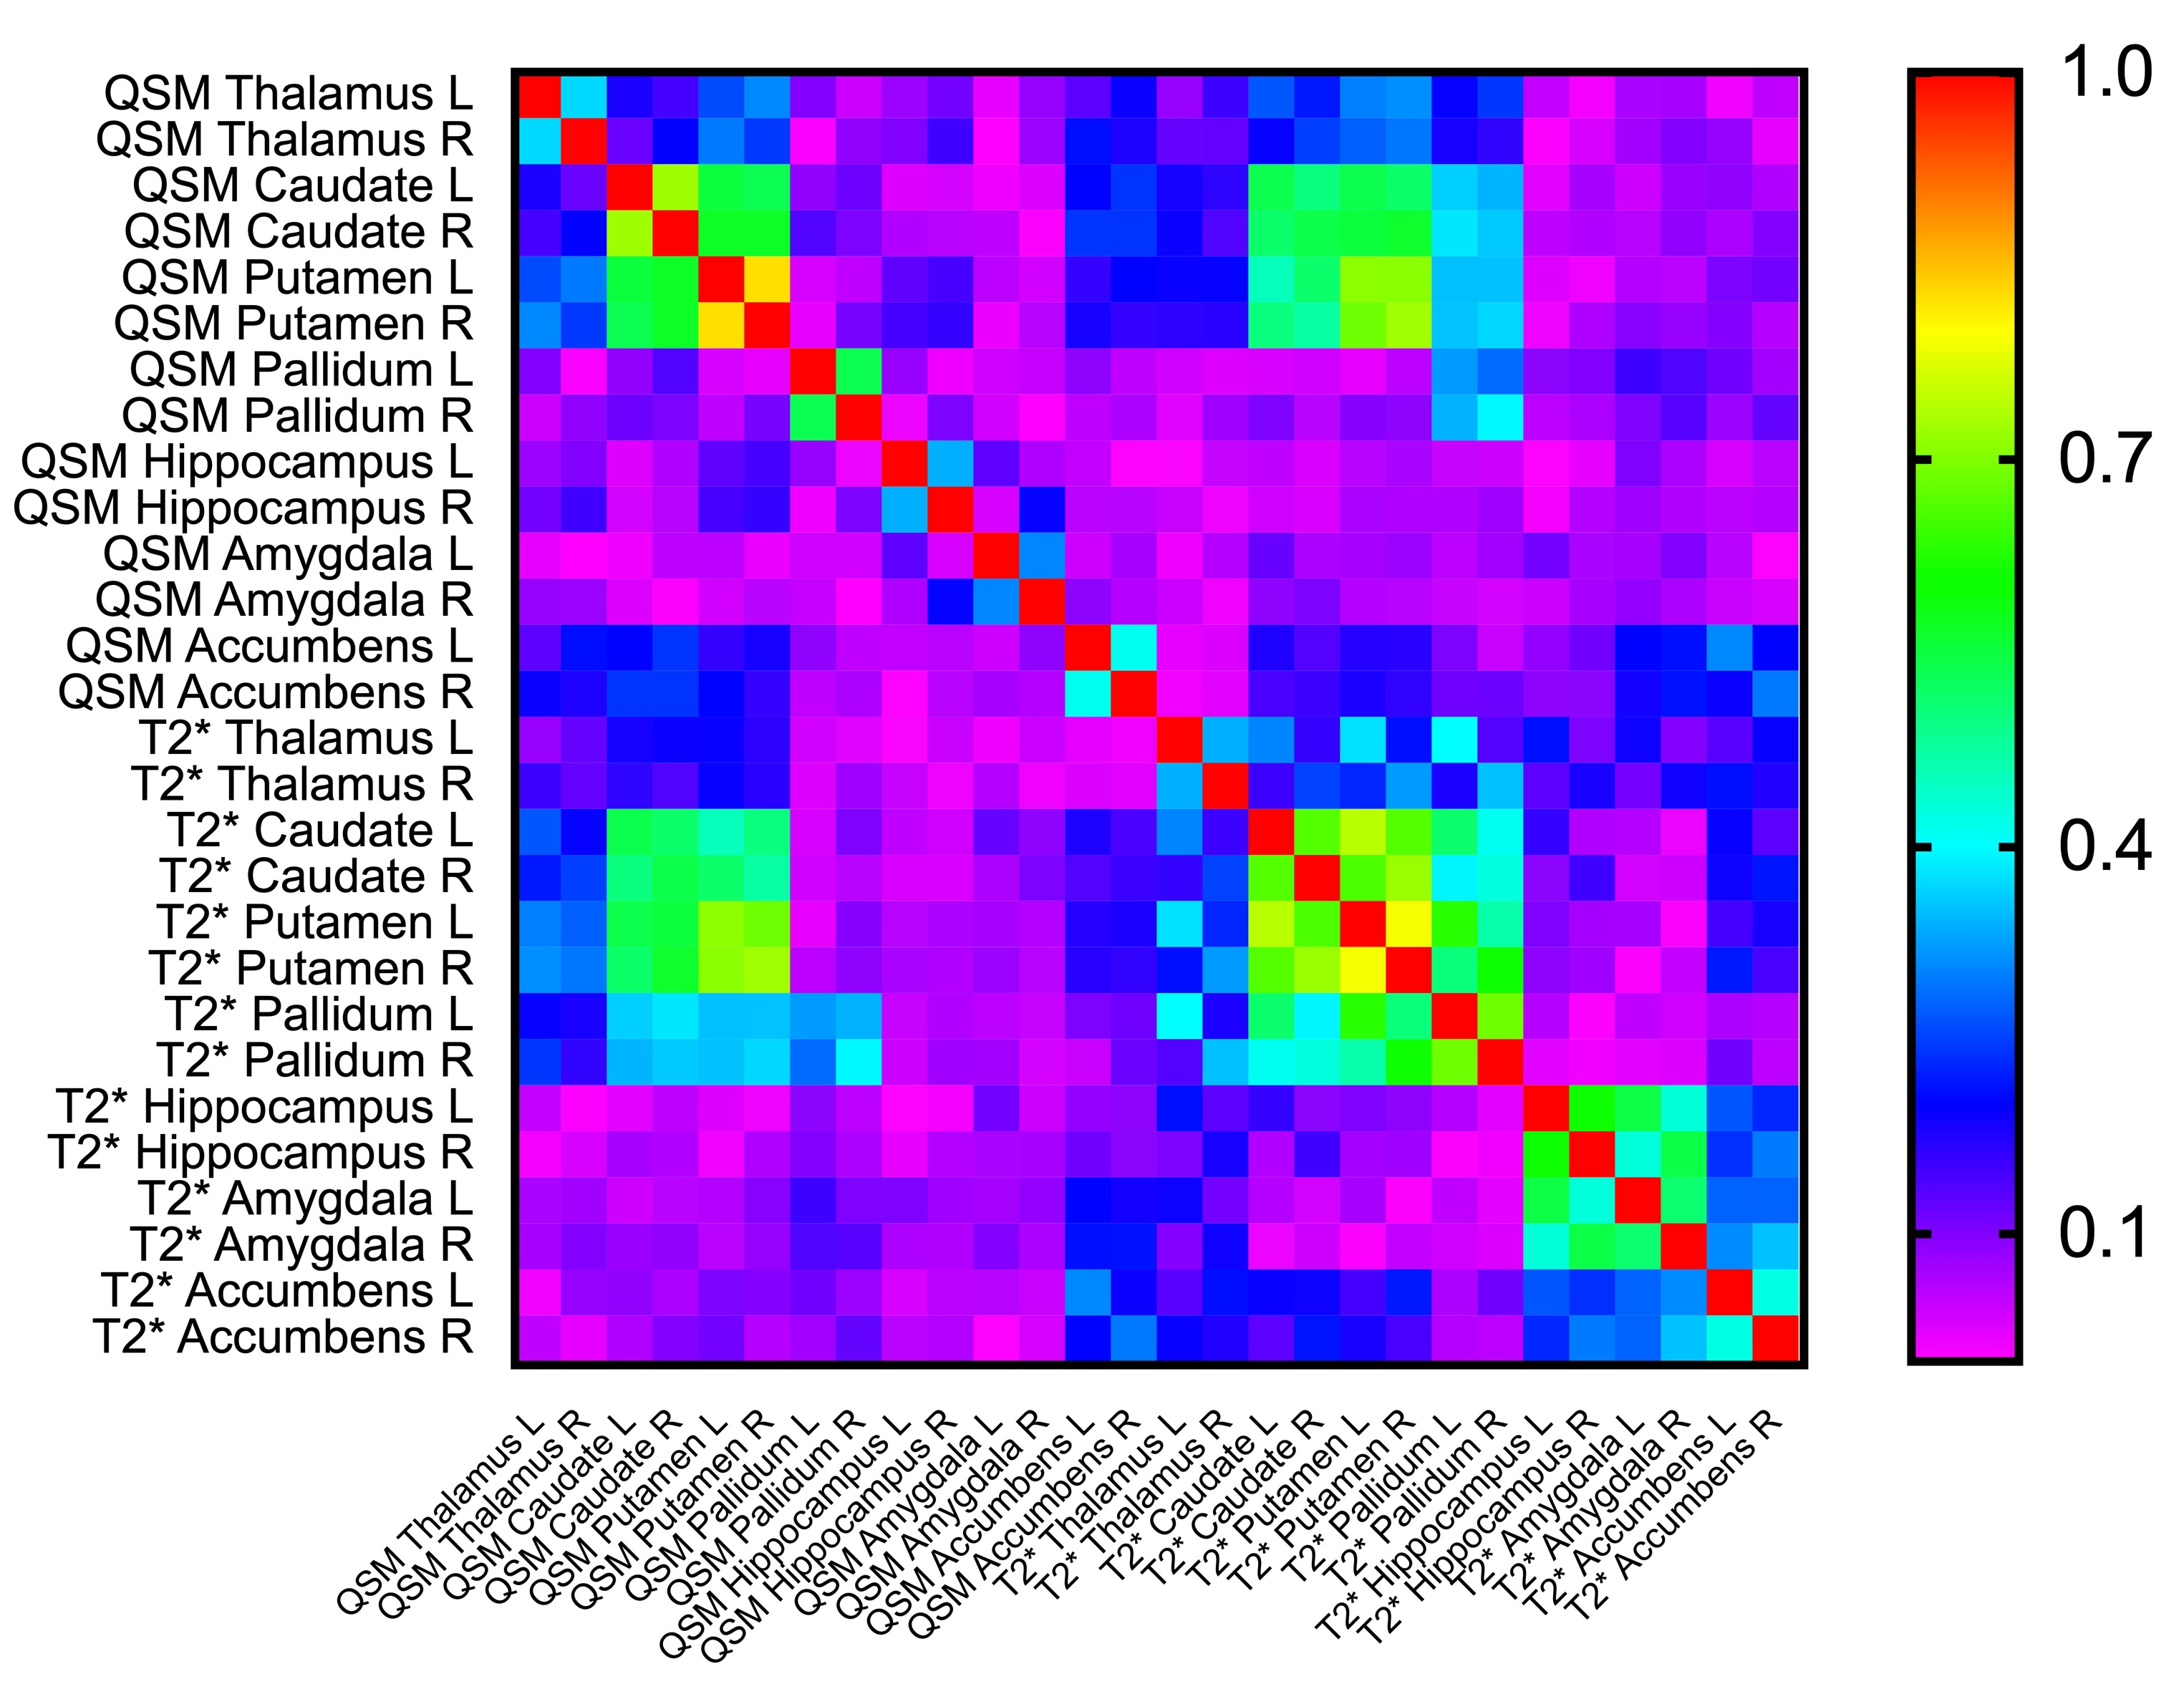
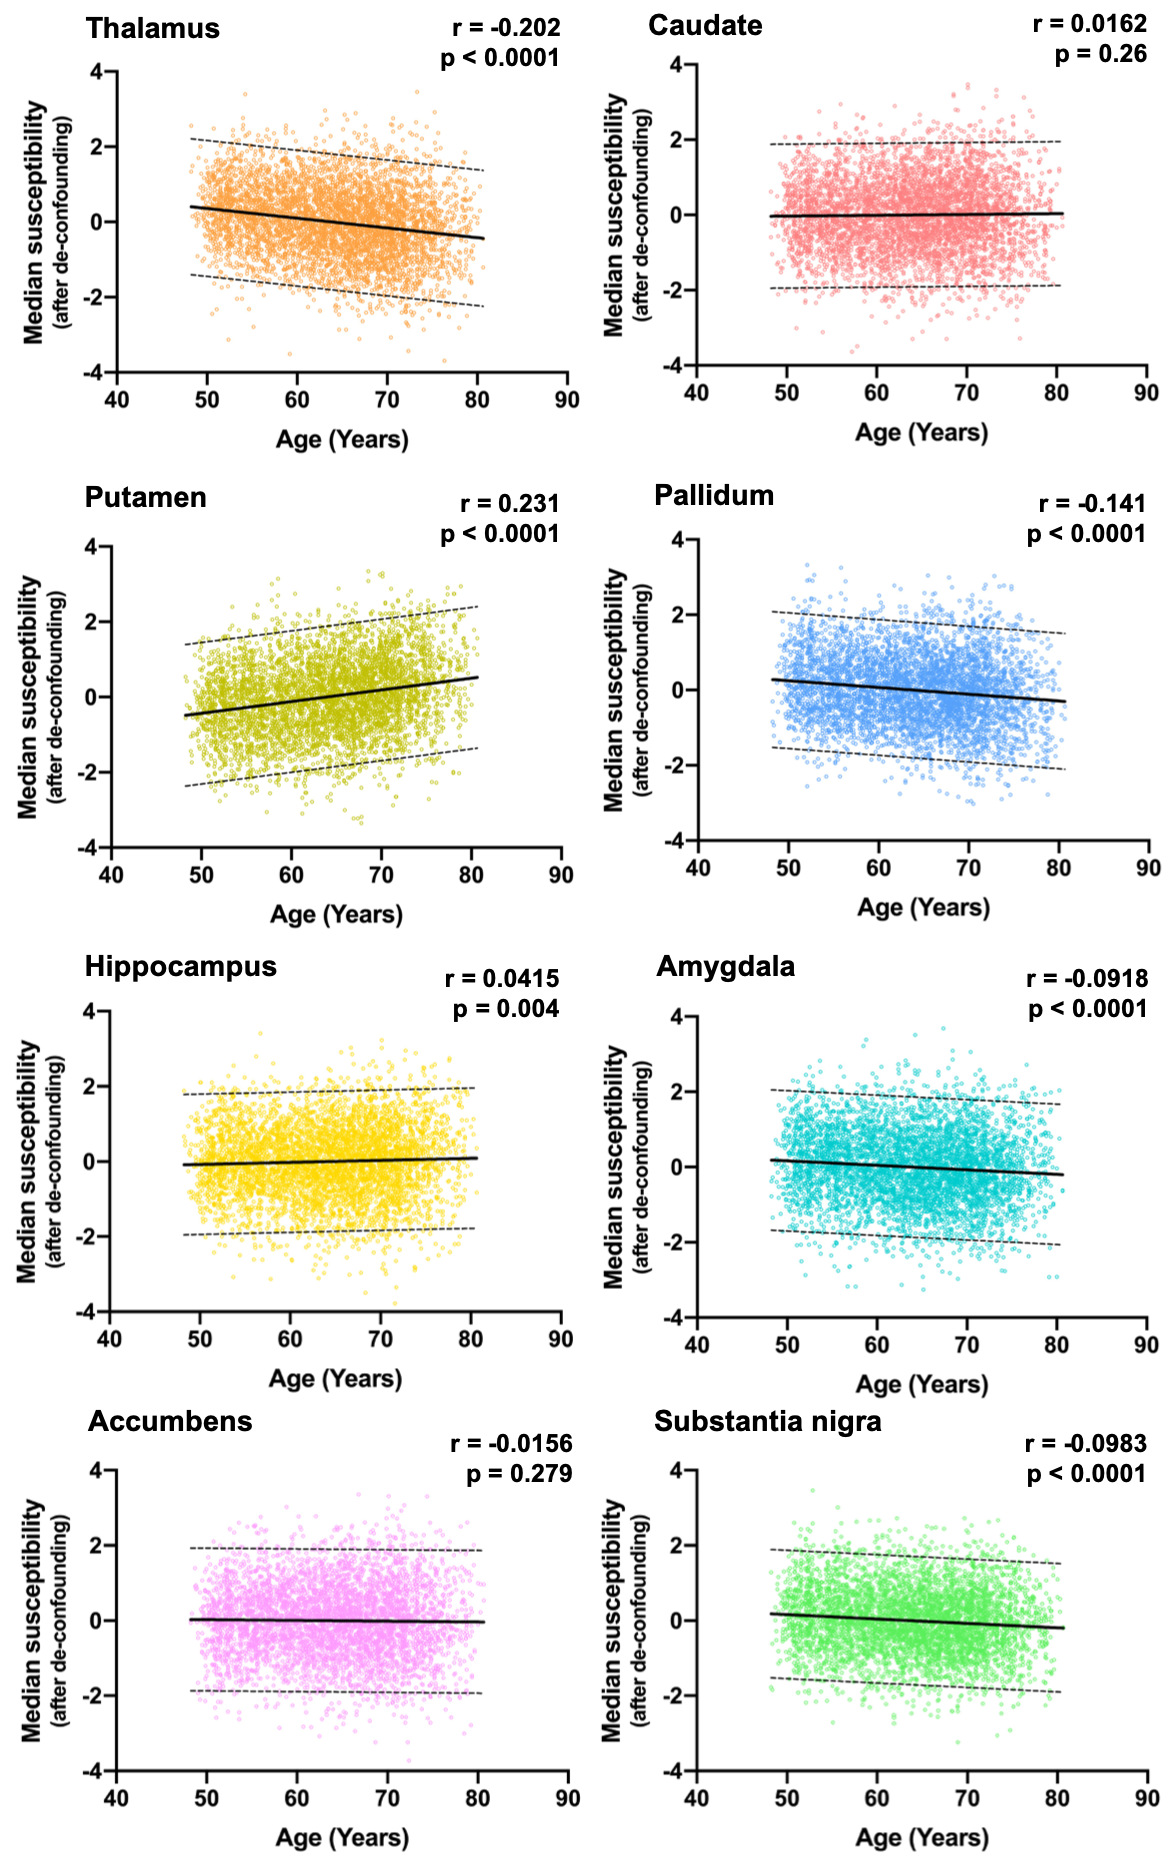
A representative susceptibility map from a single subject, the corresponding T2* map and the “QSM atlas” are shown in Figure 2. The correlation matrix of all QSM and T2* IDPs are shown in Figure 3, demonstrating higher within-contrast correlation than between-contrast correlation, suggesting unique information in QSM compared to T2*.Significant linear correlations were found between median susceptibility values and age in subcortical structures (Figure 4). Strongest correlations were found in the thalamus, putamen and pallidum; smaller but significant associations in hippocampus, amygdala, and the substantia nigra; there were no significant correlations in caudate or accumbens.
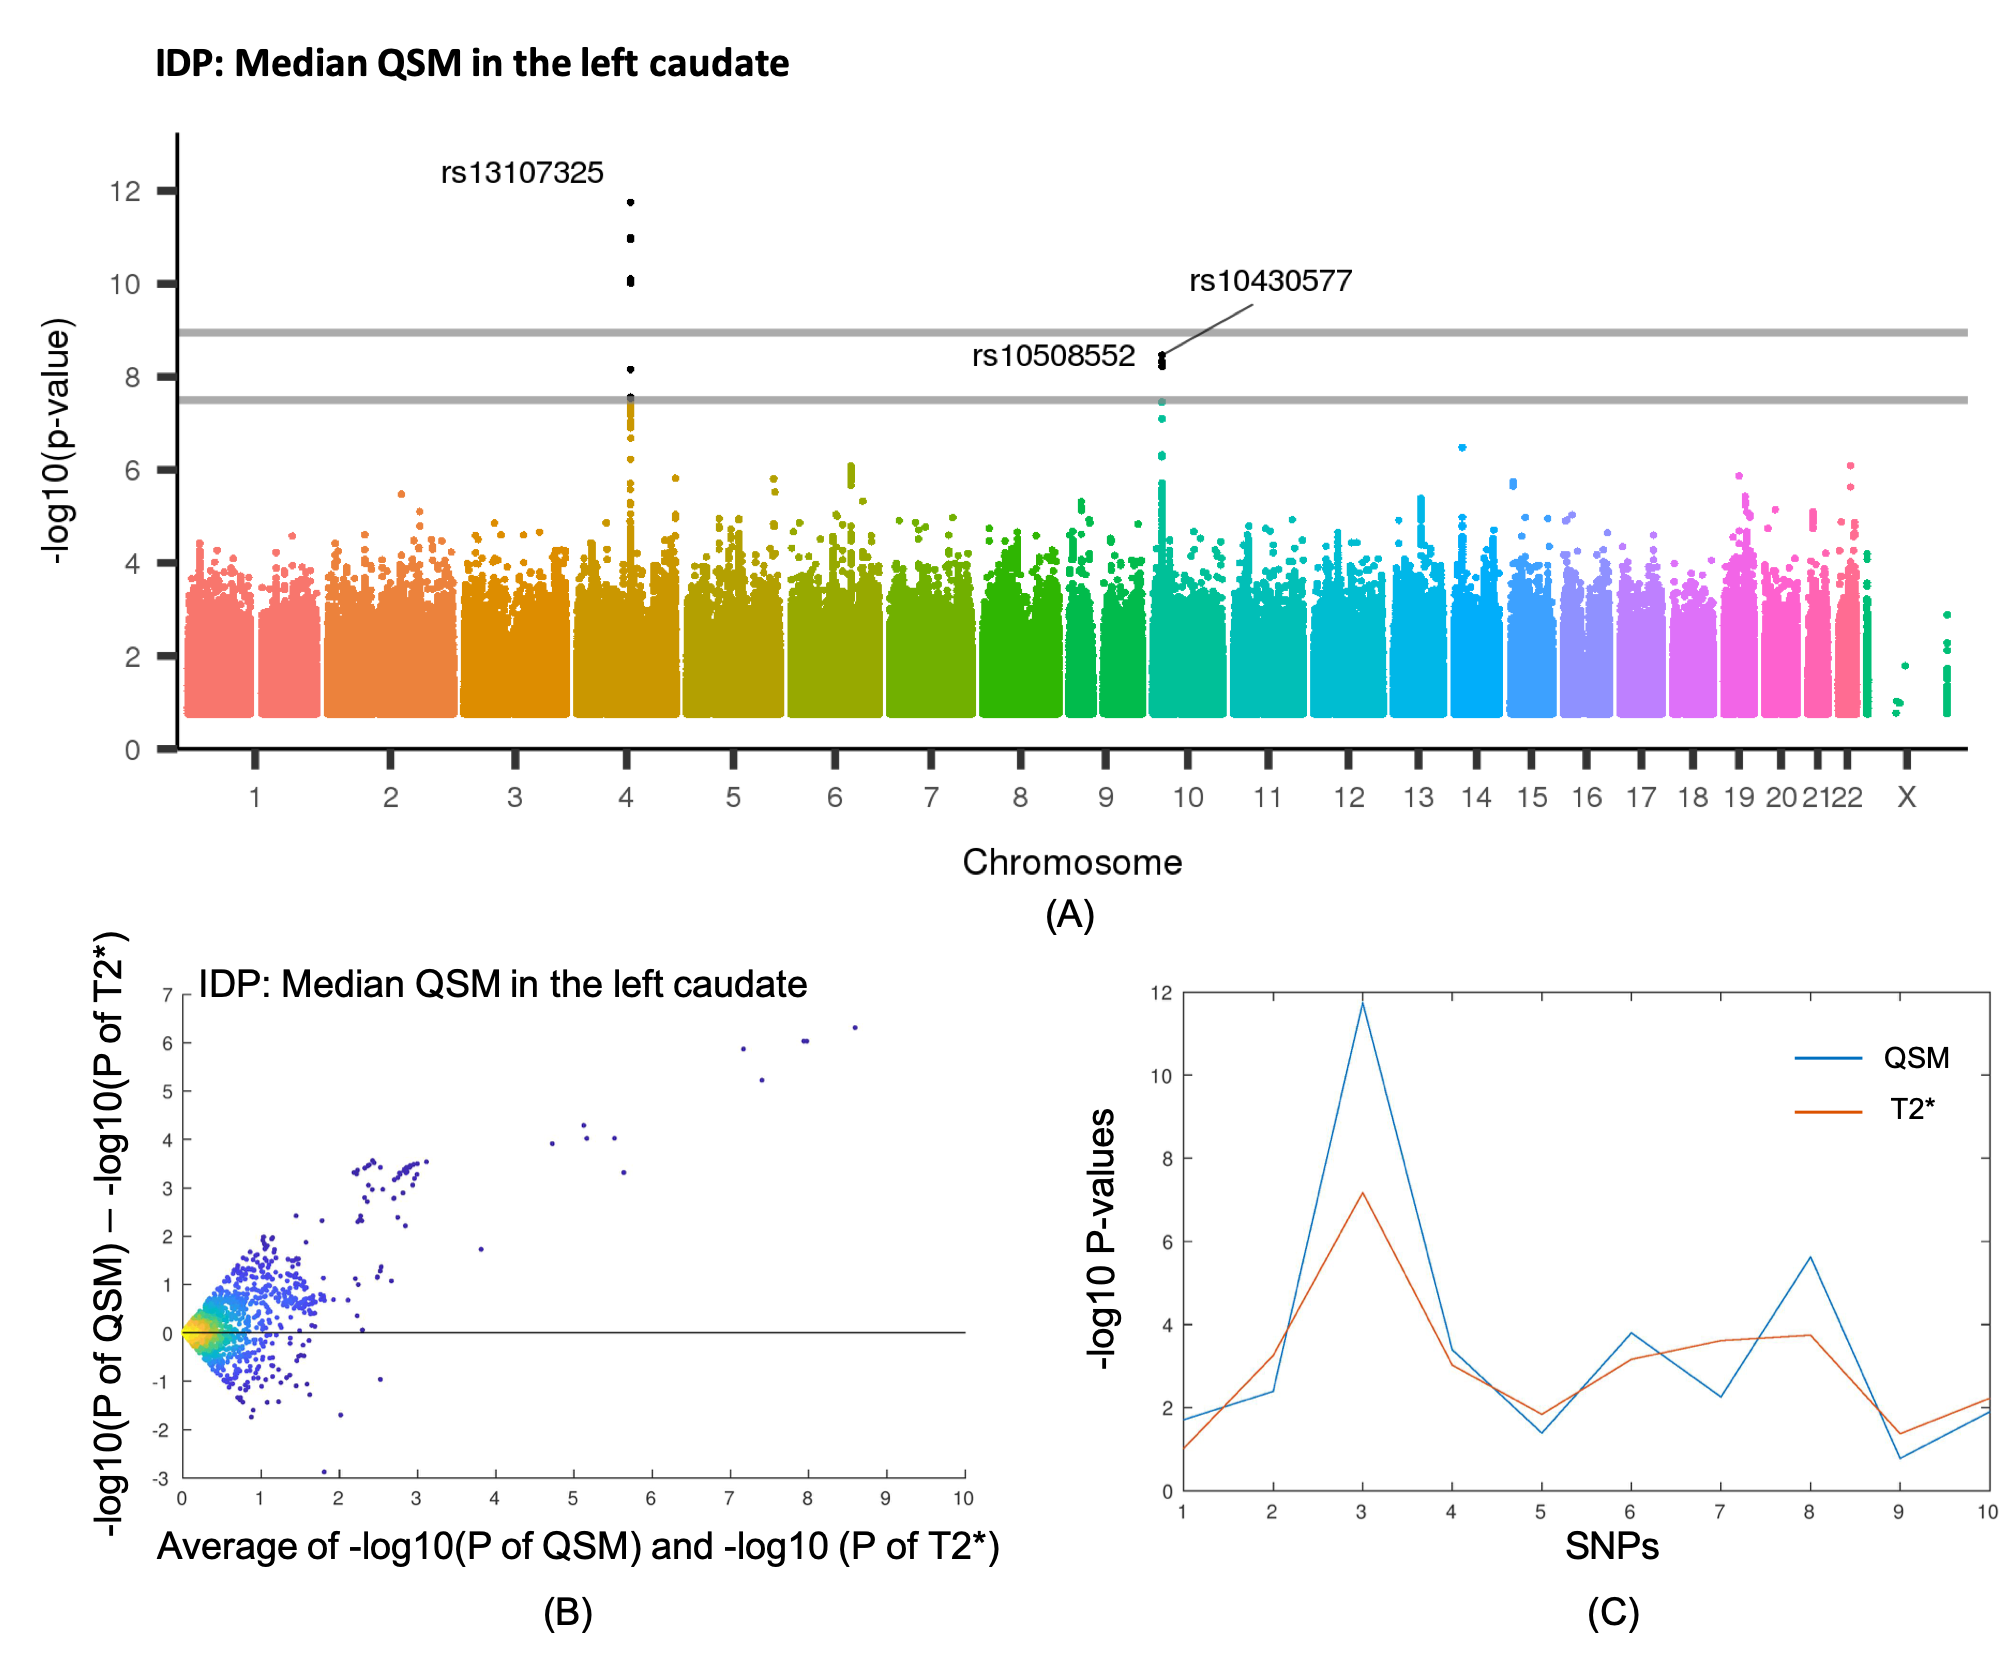
The GWAS consists of pair-wise correlations of 48 IDPs with 10 million genetic loci (single nucleotide polymorphisms, SNPs). This analysis identified 3 peaks of significant associations above the single-phenotype GWAS threshold (-Log10P=7.5) with QSM IDPs, all of which replicated. No significant results were found with T2* IDPs at this sample size.
Figure 5(A) shows the Manhattan plot for the significant associations with median QSM in the left caudate. These associations were reported previously for T2*4 as relating to the SLC39A8/ZIP8 and SLC39A12 genes. Figure 5(B) shows a Bland-Altman plot of -Log10P for QSM vs T2* in left caudate. The y-axis contrasts -Log10P(QSM) to -Log10P(T2*), and the x-axis shows the average, with each point being a different SNP; the plot shows the 2000 SNPs closest to the T2* peak SNP4 (rs13107325). This example shows stronger genetic association for the QSM IDP, compared with the T2*.
A previous imaging GWAS of UK Biobank with a larger discovery cohort of 8428 participants identified associations with T2*-based IDPs4. We extracted the top 10 “peak-SNP-clusters” involving T2*-based IDPs4. Figure 5(C) shows the maximum -log10P across all IDPs for each modality with these peak-SNP-clusters. While the strongest association was found for QSM, there is not a general pattern of stronger associations over T2*.
Conclusion
Our results suggest that there is unique information in susceptibility maps compared to T2*, as indicated by unique correlation structure. The QSM-age associations in different subcortical regions broadly agree with those reported in a previous study18. GWAS on QSM IDPs discovered replicable associations that had previously been identified for T2* on a much larger cohort.Acknowledgements
Benjamin C. Tendler and Karla L. Miller contributed equally to this work.
This research has been conducted using the UK Biobank Resource under Application Number 8107.
References
1. Sudlow C, Gallacher J, Allen N, et al. UK biobank: an open access resource for identifying the causes of a wide range of complex diseases of middle and old age. PLoS medicine. 2015 Mar 31;12(3):e1001779.
2. Miller KL, Alfaro-Almagro F, Bangerter NK, et al. Multimodal population brain imaging in the UK Biobank prospective epidemiological study. Nature neuroscience. 2016 Nov;19(11):1523.
3. Alfaro-Almagro F, Jenkinson M, Bangerter NK, et al. Image processing and quality control for the first 10,000 brain imaging datasets from UK Biobank. Neuroimage. 2018 Feb 1;166:400-24.
4. Elliott LT, Sharp K, Alfaro-Almagro F, et al. Genome-wide association studies of brain imaging phenotypes in UK Biobank. Nature. 2018 Oct;562(7726):210.
5. Haacke EM, Liu S, Buch S, et al. Quantitative susceptibility mapping: current status and future directions. Magnetic resonance imaging. 2015 Jan 1;33(1):1-25.
6. Langkammer C, Schweser F, Krebs N, et al. Quantitative susceptibility mapping (QSM) as a means to measure brain iron? A post mortem validation study. Neuroimage. 2012 Sep 1;62(3):1593-9.
7. Eckstein K, Dymerska B, Bachrata B, et al. Computationally efficient combination of multi‐channel phase data from multi‐echo acquisitions (ASPIRE). Magnetic resonance in medicine. 2018 Jun;79(6):2996-3006.
8. Li W, Wu B, Liu C. Quantitative susceptibility mapping of human brain reflects spatial variation in tissue composition. Neuroimage. 2011 Apr 15;55(4):1645-56.
9. Robinson SD, Bredies K, Khabipova D, et al. An illustrated comparison of processing methods for MR phase imaging and QSM: combining array coil signals and phase unwrapping. NMR in Biomedicine. 2017 Apr;30(4):e3601.
10. Wu B, Li W, Avram AV, Gho SM, Liu C. Fast and tissue-optimized mapping of magnetic susceptibility and T2* with multi-echo and multi-shot spirals. Neuroimage. 2012 Jan 2;59(1):297-305.
11. Zhou, D., et al., Background field removal by solving the Laplacian boundary value problem. NMR in Biomedicine, 2014. 27(3): p. 312-319.
12. Schweser, F., et al., Quantitative imaging of intrinsic magnetic tissue properties using MRI signal phase: an approach to in vivo brain iron metabolism? Neuroimage, 2011. 54(4): p. 2789-2807.
13. Li W, Wang N, Yu F, Han H, Cao W, Romero R, Tantiwongkosi B, Duong TQ, Liu C. A method for estimating and removing streaking artifacts in quantitative susceptibility mapping. Neuroimage. 2015 Mar 1;108:111-22.
14. Wei, H., et al., Streaking artifact reduction for quantitative susceptibility mapping of sources with large dynamic range. NMR in Biomedicine, 2015. 28(10): p. 1294-1303.
15. Jenkinson, M., et al., Improved optimization for the robust and accurate linear registration and motion correction of brain images. Neuroimage, 2002. 17(2): p. 825-841.
16. Jenkinson, M. and S. Smith, A global optimisation method for robust affine registration of brain images. Medical image analysis, 2001. 5(2): p. 143-156.
17. Andersson JLR, Jenkinson M, Smith S (2010) Non-linear registration, aka spatial normalisation. FMRIB technical report TR07JA2
18. Persson N, Wu J, Zhang Q, Liu T, Shen J, Bao R, Ni M, Liu T, Wang Y, Spincemaille P. Age and sex related differences in subcortical brain iron concentrations among healthy adults. Neuroimage. 2015 Nov 15;122:385-98.
Figures