0149
Hyperpolarized [1-13C]/[5-13C] glutamate as a metabolic imaging marker of IDH1 mutant glioma response to temozolomide therapy
Elavarasan Subramani1, Chloe Najac1, Georgios Batsios1, Marina Radoul1, Pavithra Viswanath1, Abigail Molloy1, Donghyun Hong1, Anne Marie Gillespie1, Russell O. Pieper2,3, Joseph Costello2, and Sabrina M Ronen1,3
1Department of Radiology and Biomedical Imaging, University of California San Francisco, San Francisco, CA, United States, 2Department of Neurological Surgery, Helen Diller Research Center, University of California San Francisco, San Francisco, CA, United States, 3Brain Tumor Research Center, University of California San Francisco, San Francisco, CA, United States
1Department of Radiology and Biomedical Imaging, University of California San Francisco, San Francisco, CA, United States, 2Department of Neurological Surgery, Helen Diller Research Center, University of California San Francisco, San Francisco, CA, United States, 3Brain Tumor Research Center, University of California San Francisco, San Francisco, CA, United States
Synopsis
Temozolomide (TMZ) is most commonly used for the treatment of primary glioblastoma but is now being considered for the treatment of low-grade glioma that harbor mutations in the cytosolic isocitrate dehydrogenase 1 (IDH1) gene. Though the treatment of IDH1 mutant patients with TMZ improves survival, there is a need for complementary metabolic imaging approaches to help in assessing early response to therapy. Hyperpolarized 13C magnetic resonance spectroscopy-based metabolic profiling of mutant IDH1 cells treated with TMZ revealed that [1-13C]/[5-13C] glutamate production from [1-13C] α-ketoglutaric acid/[2-13C] pyruvate could serve as translatable biomarkers of response to therapy.
Introduction
Gliomas are most the commonly occurring primary malignant tumor in the central nervous system. Mutations in the cytosolic isocitrate dehydrogenase 1 (IDH1) gene are present in up to 90% of primary low-grade gliomas and result in the neomorphic activity of the enzyme, which catalyzes conversion of α-ketoglutarate to the oncometabolite 2-hydroxyglutarate (2-HG).1,2 Mutant IDH1 tumors are less aggressive than primary glioblastoma, but nonetheless always recur and ultimately lead to patient death. The treatment of IDH1 mutant patients with Temozolomide (TMZ), previously reserved for the treatment of the more aggressive primary glioblastoma, improves survival,3,4 but there remains a need for complementary imaging methods to assess early response to therapy. The goal of this study was therefore to determine the magnetic resonance spectroscopy (MRS)-based biomarkers that can serve indicators of low-grade glioma response to treatment.Methods
NHA and U87 cells genetically engineered to express mutant IDH1 (i.e. NHAIDHmut and U87IDHmut cells) were maintained in culture as previously described5 and treated either with their IC50 value of TMZ (100 μM; N=5), or DMSO (0.2%; N=5) for 72 hours. SF10602, patient-derived astrocytoma cells, were treated with their IC50 value of 400 μM TMZ (N=4) or DMSO (N=4) for 7 days. To assess metabolic fluxes cells were also labelled with [1-13C] glucose or [3-13C] glutamine. Cells were then extracted using the dual-phase extraction method and 1H-MRS (1D water presaturation ZGPR sequence, 90° FA, 3s TR, 256 acquisitions) and proton-decoupled 13C-MRS (30° FA, 3s TR, 2048 acquisitions) spectra of extracted metabolites were acquired using a 500 MHz Bruker Avance spectrometer. Multivariate analysis was performed on the 1H MRS data using SIMCA.6 Correlation values and variable importance for projection scores were used to identify significantly altered metabolites following treatment. 1H and 13C MRS peaks were manually integrated and quantified using Mnova7. Spectral integrals were normalized to TSP and to cell number and statistical significance of differences determined using unpaired Student’s t-test (Graphpad Prism). For hyperpolarized [2-13C] pyruvate 13C-MRS studies, cells were encapsulated in agarose, perfused in an MR compatible perfusion system, exposed to hyperpolarized [2-13C] pyruvate and 13C spectra acquired at 11.7T (5° FA and 3s TR over 300s, 500MHz INOVA spectrometer) to monitor the production of hyperpolarized [5-13C] glutamate. For hyperpolarized [1-13C] α-ketoglutaric acid studies live cells were exposed to [1-13C] α-ketoglutaric acid and 13C spectra acquired at 1.47T in order to leverage the longer hyperpolarized T1 at lower field (13° FA and 3s TR over 300s, pulsar 1.47T) production of hyperpolarized [5- [1-13C] glutamate was monitored. Hyperpolarized glutamate signal was then quantified using Mnova7 and normalized to the respective substrates and cell number.Results and Discussion
Treatment of NHAIDHmut, U87IDHmut and SF10602 cells with their IC50 of TMZ resulted in 47.59±8.63%, 49.13±4.11% and 56.32 ± 6.48% reduction in cell number, respectively. Chemometric analysis of 1H MR spectra showed the metabolic discrimination between TMZ-treated cells and controls. First, PCA visualized the inherent clustering of groups. Further, improved separation between the groups was obtained by supervised classification models, OPLS-DA (Fig.1). Following cross-validation of models for good predictive ability and accuracy, the OPLS-DA model was used to extract the S-line and VIP plots. Most significant metabolites contributing to class separation were successfully identified using the correlation coefficients and VIP with thresholds > ±0.60 and ≥ 1, respectively (Fig. 1). Next, univariate analysis was applied to the integral values of the metabolites identified in this manner. Several metabolites were altered, but the most notably change was an increase in glutamate following treatment and this metabolite was further investigated as a translatable metabolic markers of low-grade glioma response to TMZ treatment (Fig.2). An increase in glutamate was confirmed in the clinically relevant patient-derived cell model, SF10602 (Fig.2). To further assess whether the increase in glutamate could be explained by an increase in TCA cycle flux, synthesis of glutamate from [1-13C] glucose, as well as from [3-13C] glutamine were probed (Fig.3). Consistent with the increase in total metabolite levels, both glucose- and glutamine-derived glutamate were increased in TMZ treated cells compared to controls, together explaining the increase in total pools (Fig.3). Furthermore, dynamically probing the metabolism of hyperpolarized [2-13C] pyruvate in live cells revealed that build-up of [5-13C] glutamate, which is associated with flux via the TCA cycle, was significantly higher in TMZ-treated cells in both the NHAIDHmut and U87IDHmut models (Fig.4). Following injection of [1-13C] α-ketoglutaric acid, a detectable build-up of [1-13C] glutamate was also observed in both cell models and was significantly increased following TMZ treatment (Fig.5). In line with these findings, total cellular activity of enzymes known to catalyze the α-ketoglutaric acid to glutamate conversion, namely aspartate transaminase and alanine aminotransferase were found to be upregulated in TMZ-treated cells.Conclusion
This study shows that 13C MRS detectable production of hyperpolarized [1-13C] and [5-13C] glutamate from hyperpolarized [1-13C] α-ketoglutaric acid and [2-13C] pyruvate, respectively, can be used to monitor response to TMZ therapy in mutant IDH1 cells. Further studies are warranted to confirm our findings in vivo in animal models. Nonetheless, these findings identify a possible new approach for improving currently available imaging methods for early detection of response to therapy in low-grade mutant IDH1 glioma.Acknowledgements
This work is supported by NIH R01CA197254 and NIH center grant P41EB013598.References
- Yan H, Parsons DW, Jin G, et al. IDH1and IDH2Mutations in Gliomas. New Engl J Med. 2009;360:765-773.
- Dang L, White DW, Gross S, et al. Cancer-associated IDH1 mutations produce 2-hydroxyglutarate. Nature. 2009;462:739-744.
- Cairncross JG, Wang M, Jenkins RB, et al. Benefit from procarbazine, lomustine, and vincristine in oligodendroglial tumors is associated with mutation of IDH. J Clin Oncol. 2014;32:783-790.
- Buckner JC, Shaw EG, Pugh SL, et al. Radiation plus procarbazine, CCNU, and vincristine in low-grade glioma. N Engl J Med. 2016;374:1344-1355.
- Chaumeil MM, Larson PEZ, Yoshihara HAI, et al. Non-invasive in vivo assessment of IDH1 mutational status in glioma. Nat Commun. 2013;4:2429.
- Subramani E, Rameshbabu AP, Jothiramajayam M, et al. Mycobacterial heat shock protein 65 mediated metabolic shift in decidualization of human endometrial stromal cells. Sci Rep. 2017;7(1):3942.
Figures
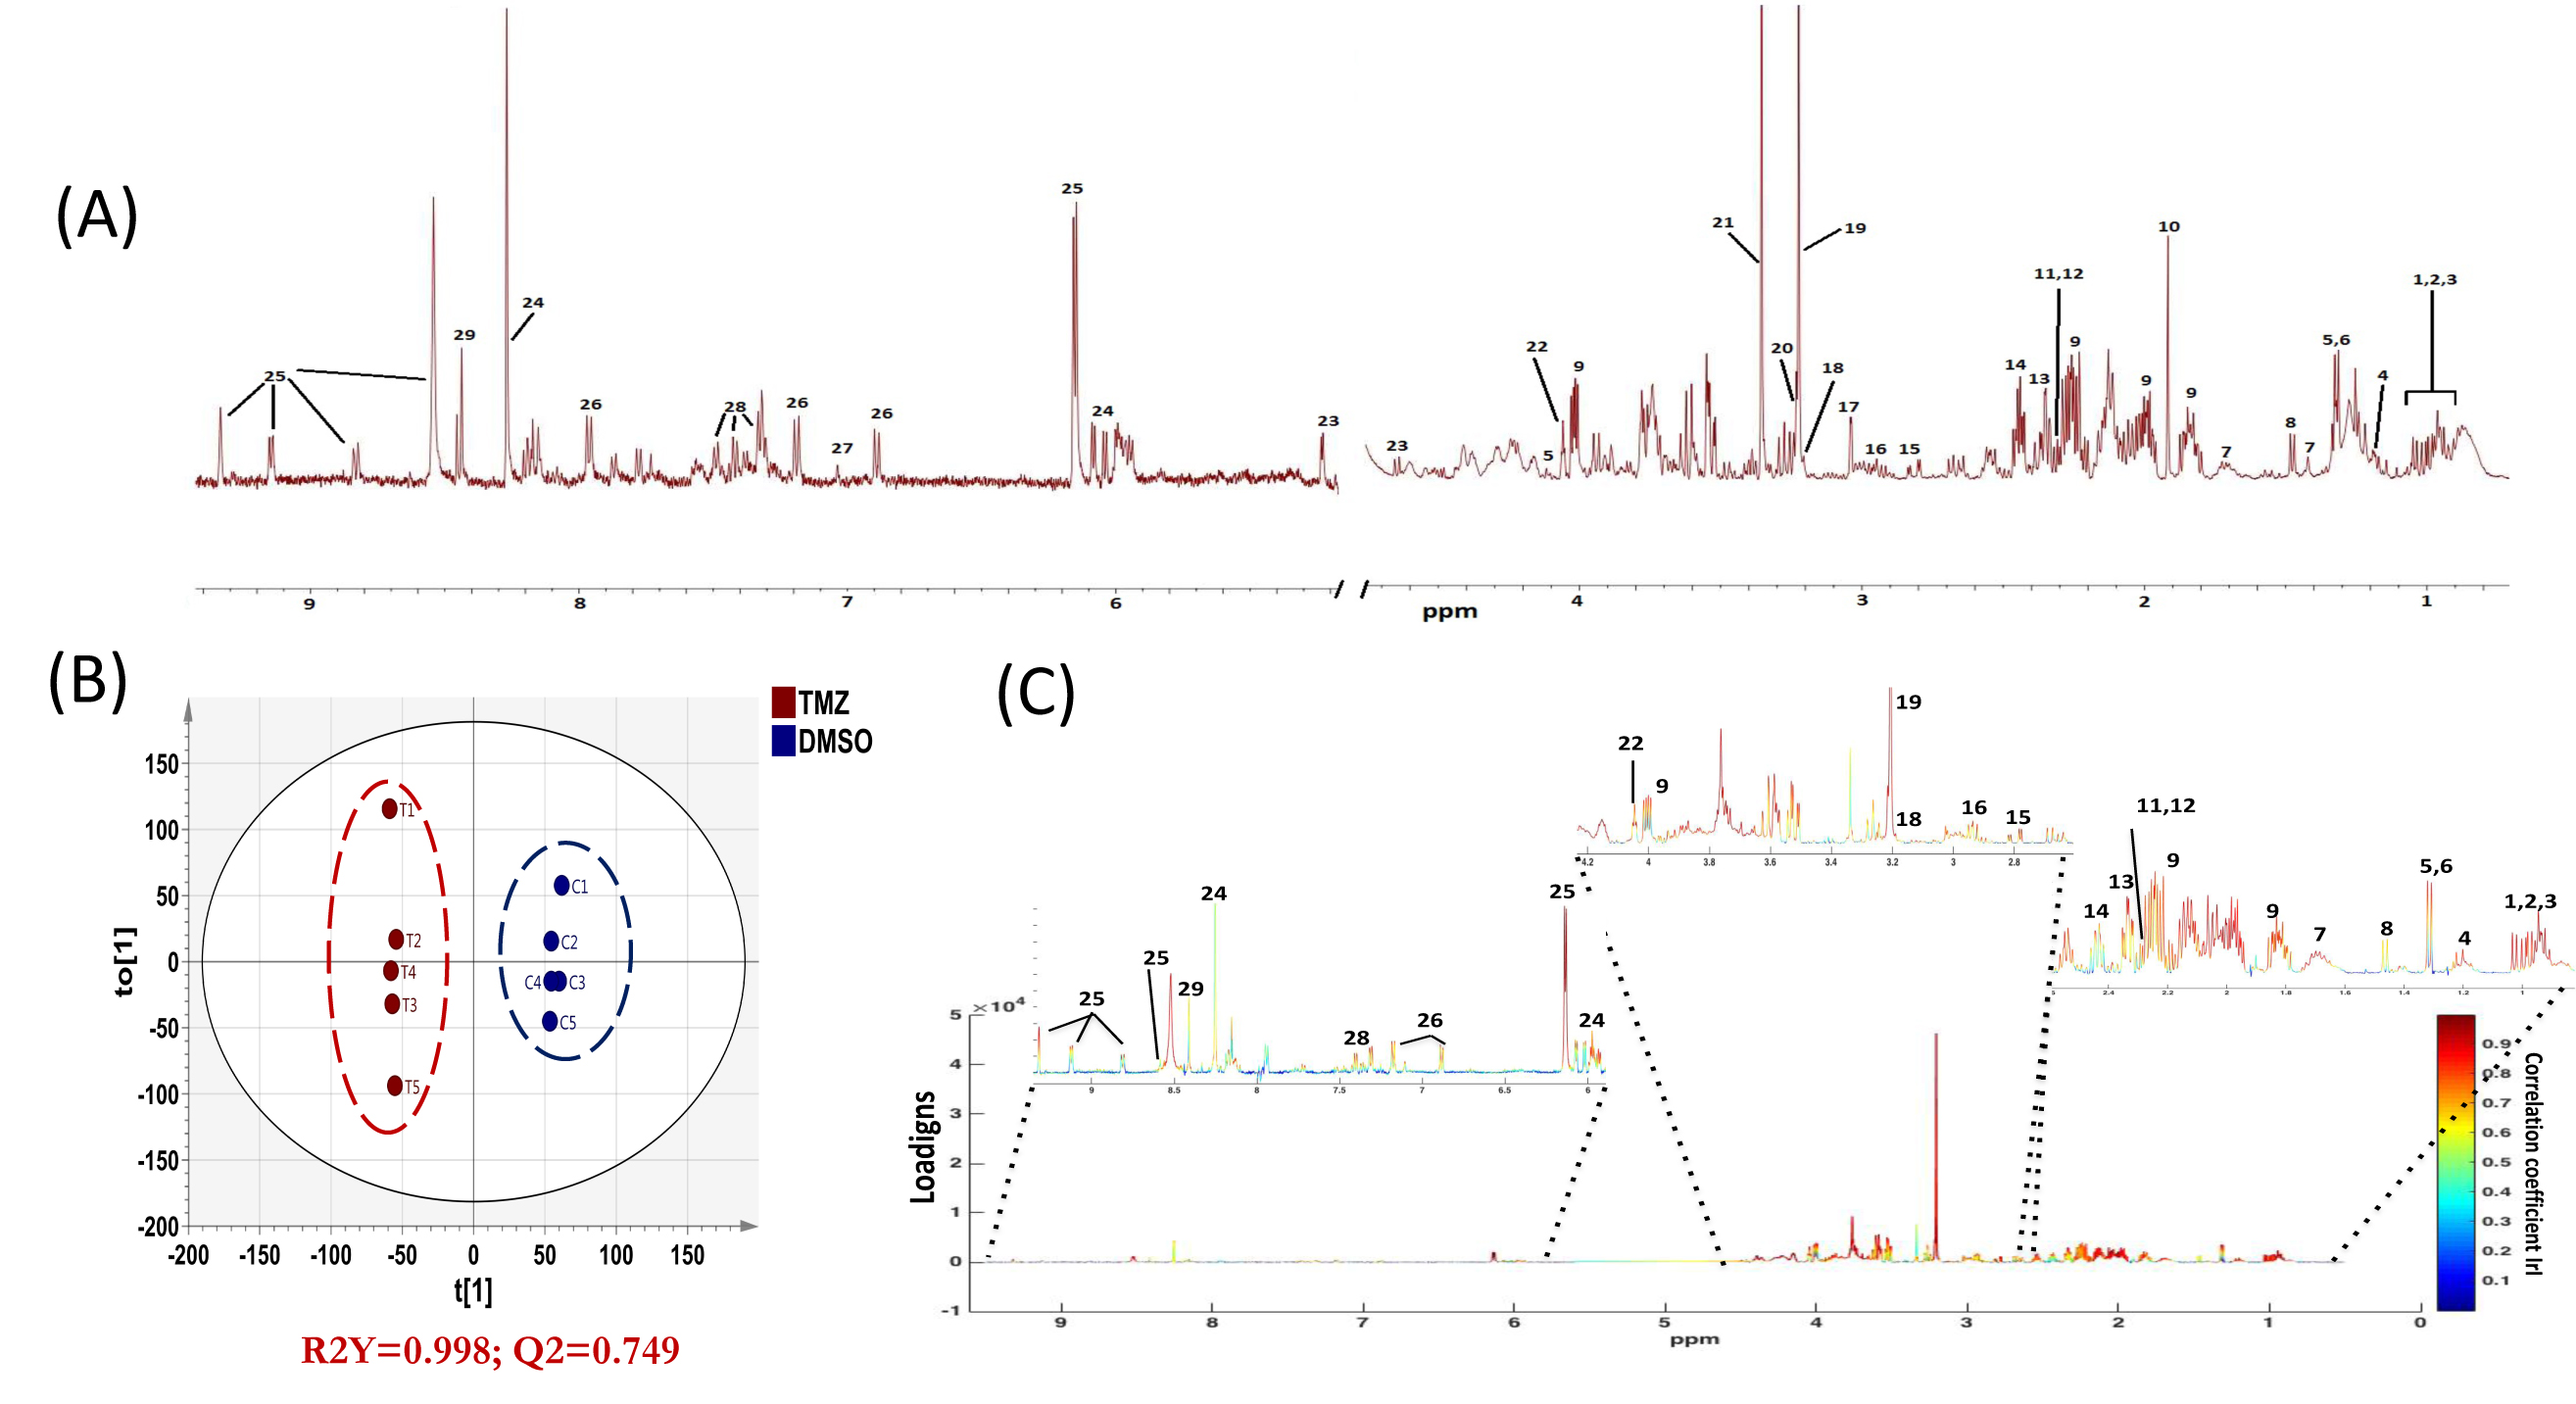
Fig.1:A typical 1H
spectrum of NHAIDHmut cells (A). 1.Ile, 2.Leu, 3.Val, 4.3-hydroxybutyrate,
5.Lac, 6.Thr, 7.Lys, 8.Ala, 9.2-HG, 10.Acetate, 11.Pyr, 12.Succinate, 13.Glutamine,
14.Glutamate, 15.Asp, 16.GLS, 17.Creatine, 18.Choline, 19.Phosphocholine,
20.Glycerophosphocholine, 21.Phosphatidylcholine, 22.Myoino, 23.Glucose, 23.His,
24.ATP/ADP/AMP, 25.NAD/NADP+, 26.Tyr, 27.1-methylhistidine, 28.Phe, 29. For. 2D
scatter plot of OPLS-DA shows discrimination of control and TMZ-treated groups
(B). S-line plot. Correlation coefficient plot as color map (C).
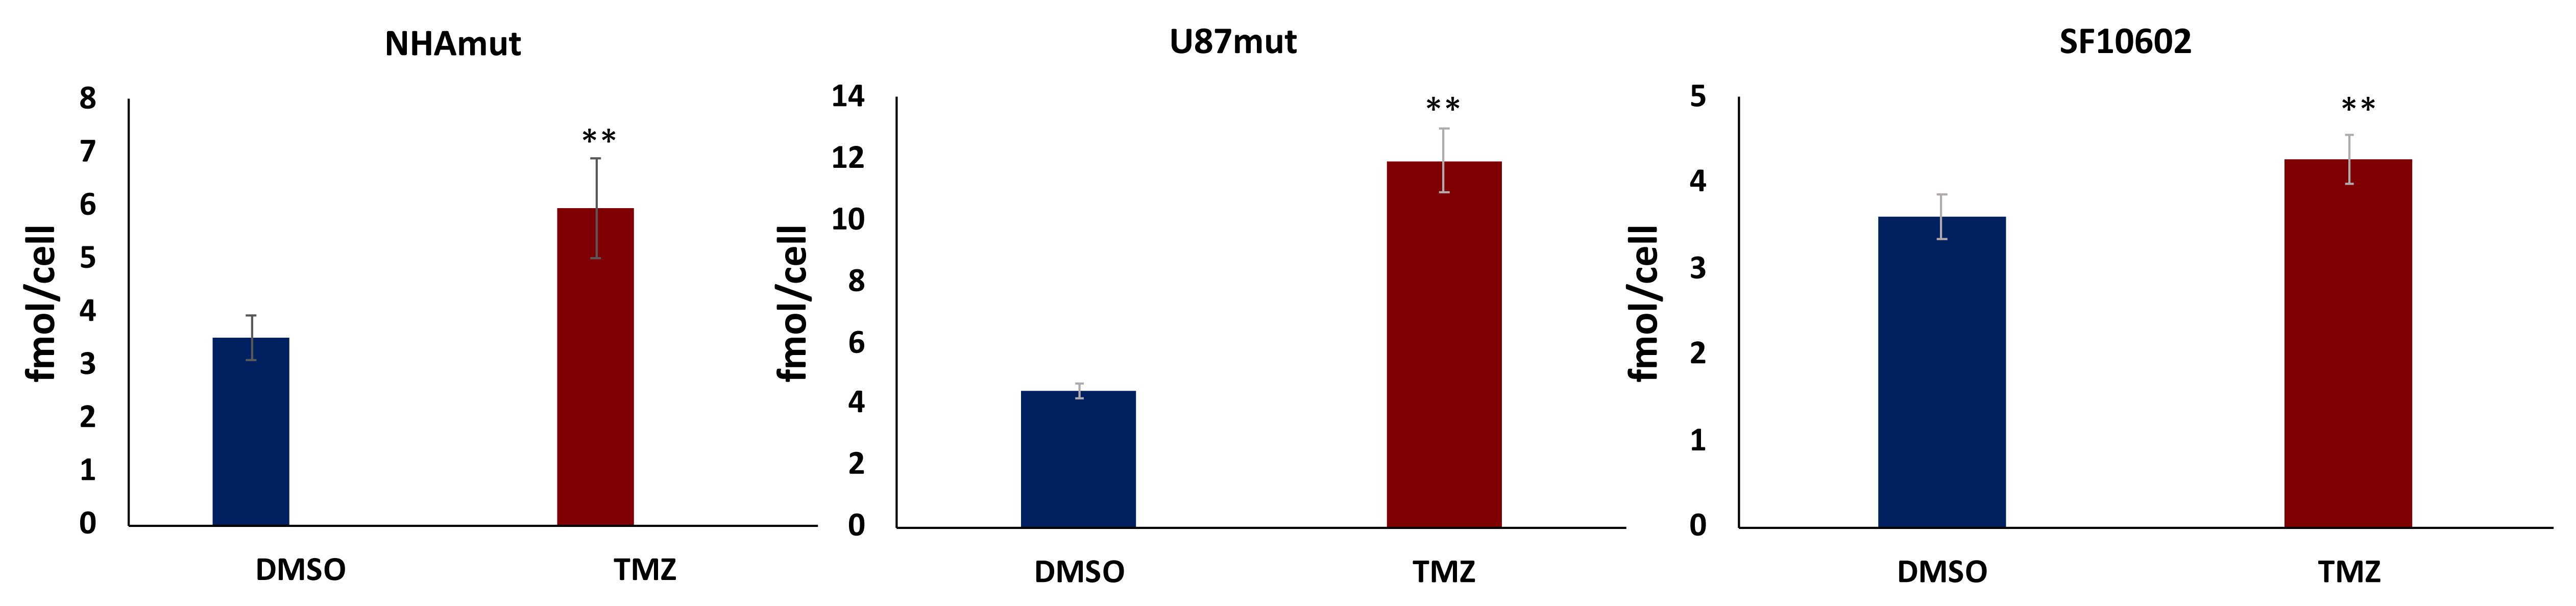
Fig.2:Quantification
of 1H MRS-detected glutamate levels in NHAmut, U87mut and SF10602
cell models. *p<0.05; **p<0.01.
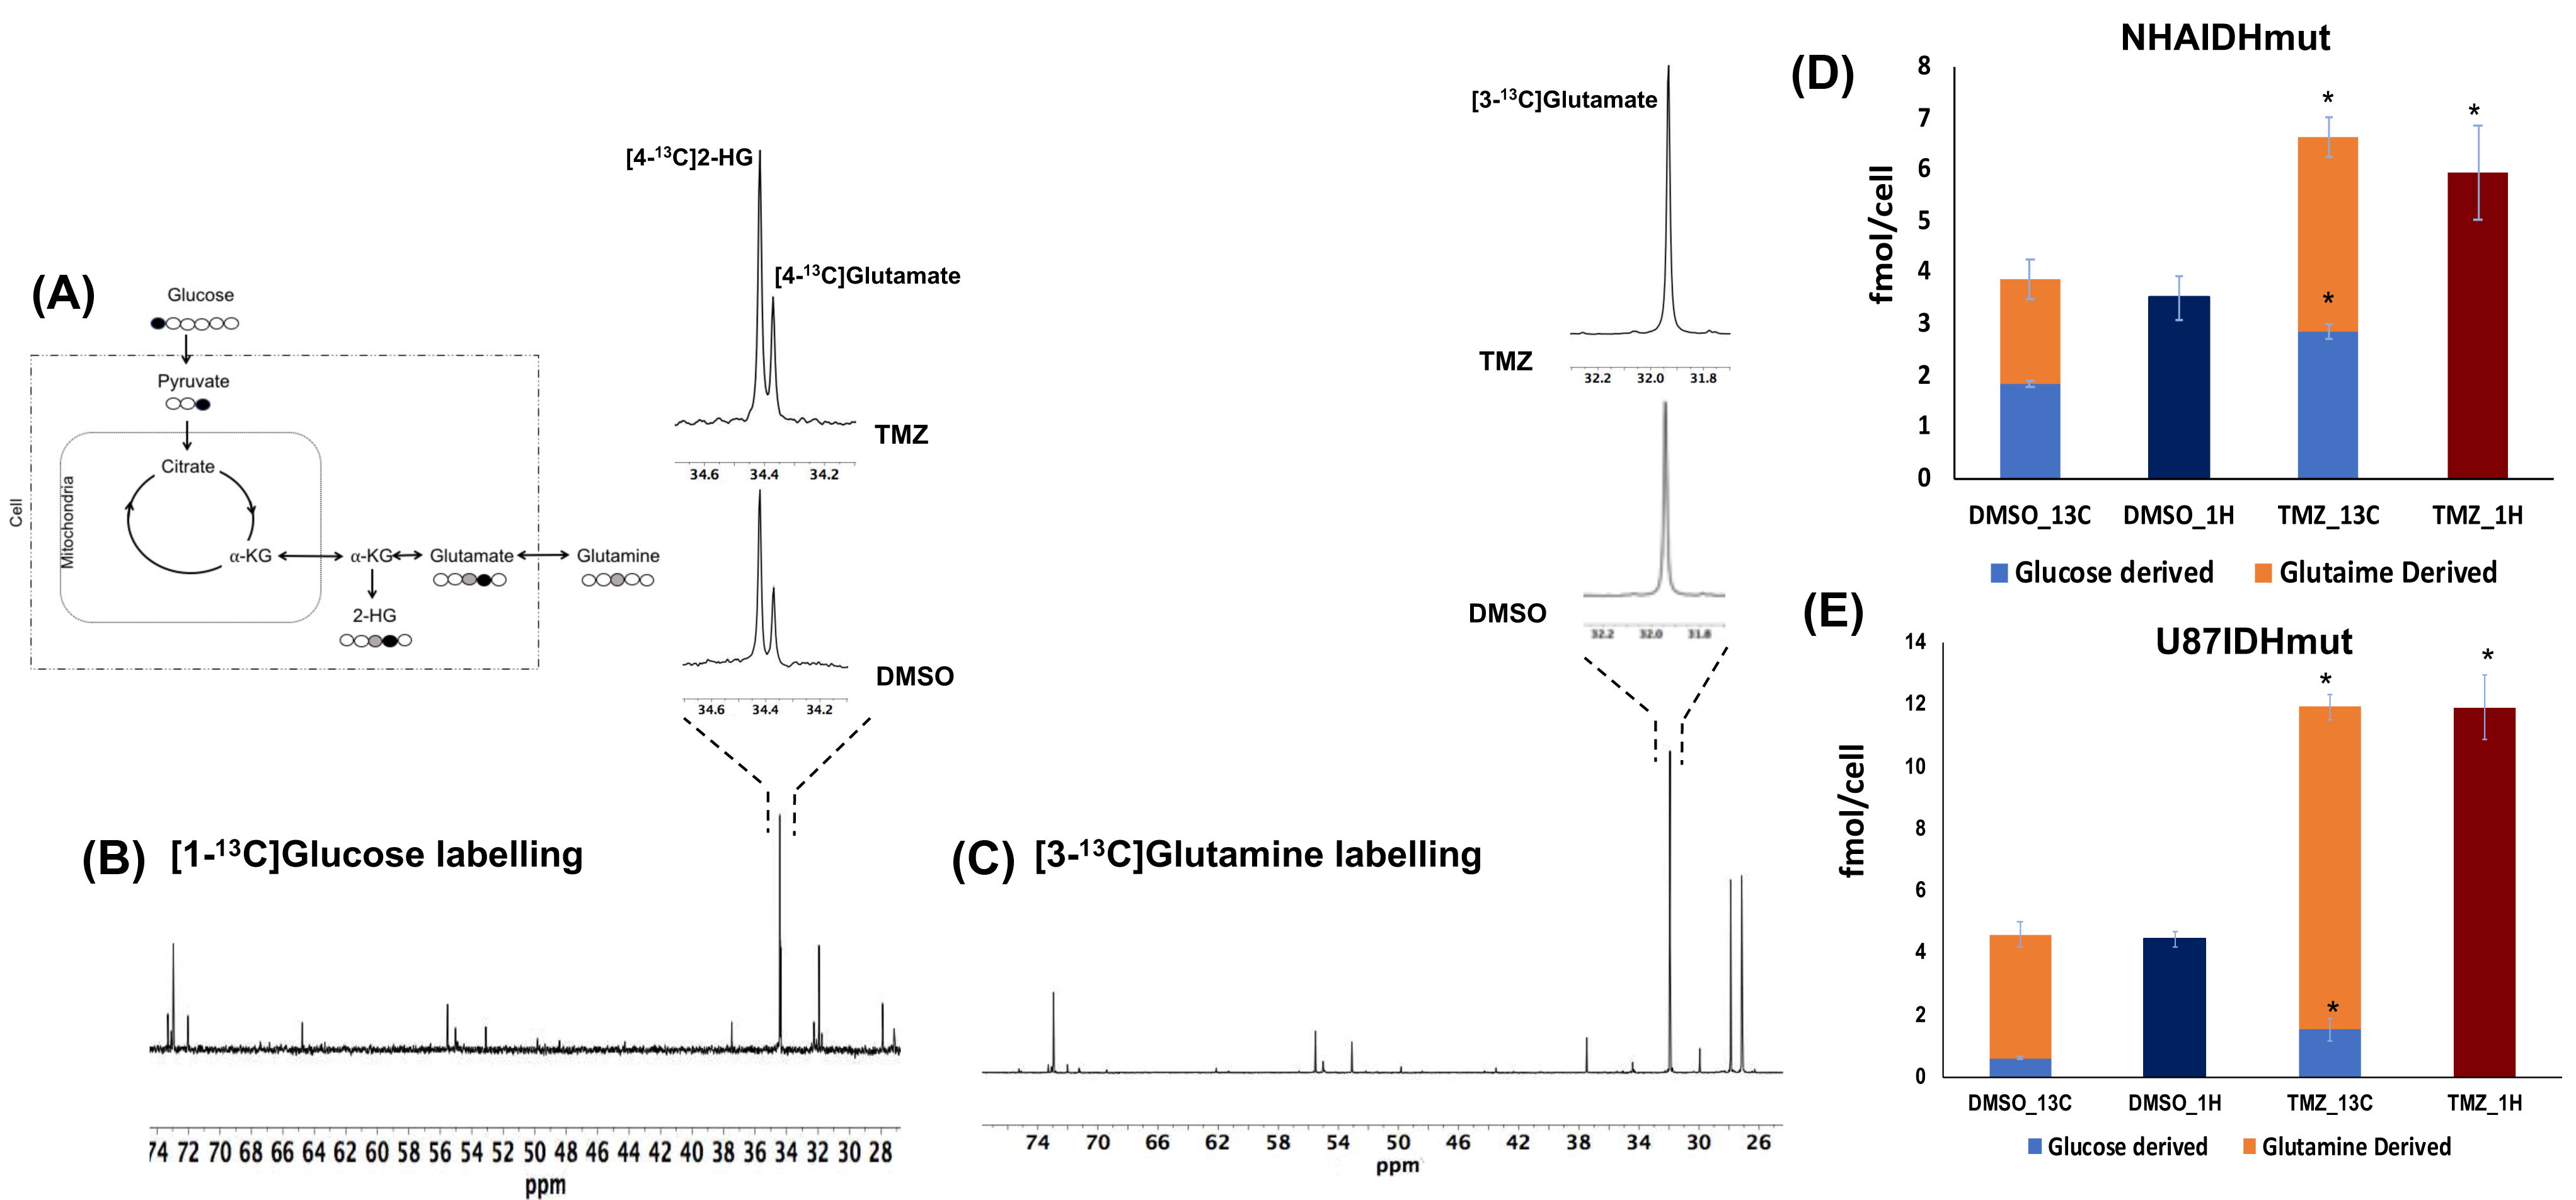
Fig.3:Schematic representation of [1-13C]
glucose and [3-13C] glutamine labelling (A).
500 MHz 13C MRS spectrum
(δ 28.0−74.0) of [1-13C] glucose (B) and [3-13C] glutamine
(C) labelled NHAIDHmut cells. Glucose and glutamine flux to glutamate is
increased in NHAIDHmut (D) and U87IDHmut (E) cells under TMZ treatment.
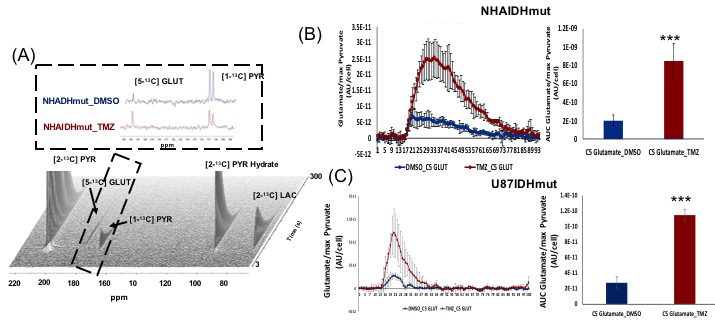
Fig.4:Dynamic 13C-MRS array
showing metabolism of hyperpolarized [2-13C] pyruvate in NHAIDHmut
model treated with TMZ or DMSO for 72h (A). Inserts explain the sum of all
spectra within dotted region of the array. [2-13C] PYR: [2-13C]
pyruvate, [2-13C] PYR Hydrate: [2-13C] pyruvate hydrate, [1-13C]
PYR: [1-13C] pyruvate, [5-13C] GLUT: [5-13C] glutamate.
***p<0.0001. Production of hyperpolarized [5-13C] glutamate in
NHAIDHmut (B) and U87IDHmut (C) models treated with TMZ (n=5) or DMSO (n=5).
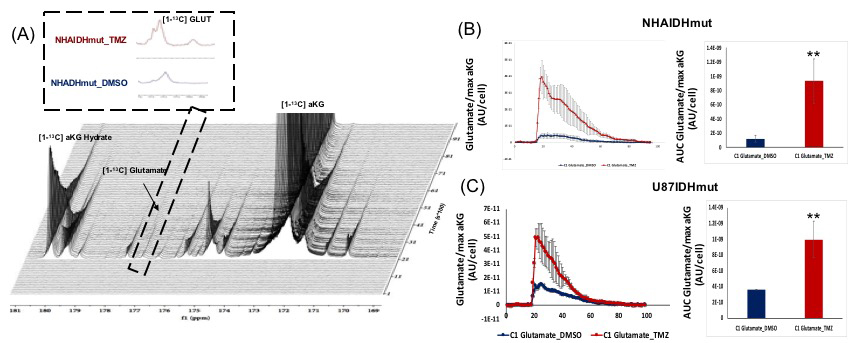
Fig.5:Dynamic 13C-MRS
array showing metabolism of hyperpolarized [1-13C] α-ketoglutaric
acid in NHAIDHmut model treated with TMZ or DMSO for 72h (A). Inserts explain
the sum of all spectra within dotted region of the array. [1-13C]
aKG: 1-13C α-ketoglutaric acid, [1-13C] aKG Hydrate: [1-13C]
α-ketoglutaric acid hydrate, [1-13C] glutamate. **p<0.001.
Production of hyperpolarized [1-13C] glutamate in NHAIDHmut (B) and
U87IDHmut (C) models treated with TMZ (n=3) or DMSO (n=3).