0148
Low dose brain irradiation leads to delayed neuro-inflammation
Dina Sikpa1, Jérémie P. Fouquet1, Luc Tremblay1, Réjean Lebel1, Benoit Paquette1, and Martin Lepage1
1Université de Sherbrooke, Sherbrooke, QC, Canada
1Université de Sherbrooke, Sherbrooke, QC, Canada
Synopsis
We studied the late radiation effect of a low radiation dose on the healthy mouse brain using MRI and histology. MRI enables the visualisation of early inflammation and late radiation necrosis. Histological analysis confirmed tissue damage and revealed that cellular (astrocytes, microglia) and molecular activation (ICAM-1, VCAM-1) as a result of neuro-inflammation precedes the formation of the necrotic core.
Introduction
Stereotactic radiosurgery (SRS) is commonly used to treat metastatic brain tumors. However, the surrounding healthy brain tissue receives a significant dose of radiation resulting in early and late side effects such as radiation necrosis (RN) and neurocognitive deficits 1. The delayed RN is a well-known adverse effect and can occur from a few months to several years after radiotherapy 2, 3. The pathogenesis of these side effects is of growing interest and a number of studies support a significant role for neuro-inflammation 4. Our goal was to characterize the molecular and cellular signature of radiation-induced inflammation of the healthy brain. In the long term, this knowledge could benefit patients by providing insight on how to prevent early and late radiation therapy side effects.Methods
Balb/c mice were irradiated with a single-hemispheric radiation total dose of 45 Gy (Figure 1) using a Leksell Gamma Knife Perfexion (Elekta AB, Stockholm, Sweden) with a 4 mm collimator 3. Late-delayed radiation-induced neuro-inflammation was assed 10, 17, 19 and 21 months after irradiation using magnetic resonance imaging (MRI). A T2*-weighted sequence was used to visualize (1) the emergence and evolution of a necrotic core and (2) vascular inflammation by imaging the vascular cell adhesion molecule-1 (VCAM-1) with microparticles of iron oxide functionalized with anti-VCAM-1 antibodies (MPIO-VCAM-1) or control antibodies as described previously 5, 6. Scan (1) was the “pre-injection” image for scan (2). All MRI experiments were conducted on a 210-mm small animal 7T scanner (Varian Inc., Palo Alto, CA) with a dedicated mouse head-coil (RAPID MR International, OH) using a T2*-weighted sequence (TR = 50 ms, TE = 25 ms, flip angle = 15°, data matrix = 256x192x96, field of view = 20x15x10 mm3, 2 averages). Brains were extracted for histological analysis following imaging sessions. Brain slides were examined for pathological changes, and immunohistochemistry targeting glial fibrillary acidic protein (GFAP, indicating astrocyte activation), ionized calcium-binding molecule 1 (Iba1, microglial activation) and cell adhesion molecules (ICAM-1, VCAM-1, endothelial cells activation) was performed. Tissue damage was assed using both hematoxylin & eosin to assess general pathology and Luxol fast blue counterstained with Cresyl Violet to visualize myelin sheaths.Results
Both MR and histological data (Fig. 2A-D and I-P respectively) reveal that RN appear only at 17 months after irradiation. On MR images, the necrotic core appeared first in the area that received 100 % of the dose as an hypointense volume (Fig. 2B) that expanded to the rest of the irradiated hemisphere over time (Fig. 2D). Negative contrast (NC) quantification confirmed those observations (Fig. 2Q). Molecular MR imaging revealed that cerebrovascular inflammation was already present at 10 months (Fig. 2E) and the apparent hypointense volume observed on “pre-injection” image increased – a clear indication that VCAM-1 expression was increased on activated blood vessels (Fig. 2F-H). RN manifested on H&E-stained slides as areas of edema, increased number of telangiectatic and hyalinised blood vessels, few areas of hypercellularity, hemorrhage and tissue loss (Fig. 2L and P). Before that time point, there was no clear evidence of RN. However, irradiation resulted in myelin sheath damage as soon as 10 months, which increased with time (Fig. 4A-D). Microscopically, increased ICAM-1 and VCAM-1 expression indicated endothelial activation over time (Fig. 3A-D and E-H respectively). A strong ICAM-1 cellular staining was observed at all time points (Fig. 3A). GFAP-stained sections showed increased staining with hypertrophic astrocytes at 10 months that persisted until 21 months (Fig. 4F-I). Microglial activation was also increased compared to controls (Fig. 4K-N) with microglia showing a hyper-ramified morphology (Fig. 4L and M). However, at 21 months there was a decrease in Iba1 staining (Fig. 4N).Discussion and Conclusion
Using MR imaging and histological analysis allowed for the visualization of different stages of brain inflammation after a relatively low radiation dose. Molecular MR imaging targeting VCAM-1 enabled the detection of cerebrovascular inflammation preceding the formation of the necrotic core. This study is the first to show RN at this radiation dose and at such a late stage. We anticipate the slower progression of RN at low dose will enable deciphering the different events leading to RN.Acknowledgements
The authors are grateful to the Electron Microscopy & Histology Research Core of the FMSS at the Université de Sherbrooke for their histology service. Martin Lepage and Benoit Paquette are members of the Fonds de recherche Québec – Santé – funded Centre de recherche du centre hospitalier universitaire de Sherbrooke.References
- Patel U, Patel A, Cobb C, Benkers T, Vermeulen S. The management of brain necrosis as a result of SRS treatment for intra-cranial tumors. Transl Cancer Res; 3:373–82 (2014).
- Valk PE, Dillon WP. Radiation injury of the brain. AJNR Am J Neuroradiol 12(1):45–62 (1991).
- Jiang X, Yuan L, Engelbach JA, et al. A gamma-knife-enabled mouse model of cerebral single-hemisphere delayed radiation necrosis. PLoS ONE 10, e0139596 (2015).
- Furuse M, Nonoguchi N, Kawabata S, Miyatake S, Kuroiwa T. Delayed brain radiation necrosis: pathological review and new molecular targets for treatment. Med Mol Morphol. ; 48:183–90 (2015).
- McAteer MA, Sibson NR, von zur Muhlen C, et al. In vivo magnetic resonance imaging of acute brain inflammation using microparticles of iron oxide. Nature Medicine 13, 1253 - 1258 (2007).
- Sikpa D, Whittingstall L, Fouquet JP, Tremblay L, Lebel R, Lepage M. Pre-existing inflammation in the brain promotes metastases invasion. Joint Annual Meeting ISMRM-ESMRMB Paris, France (2018)
Figures
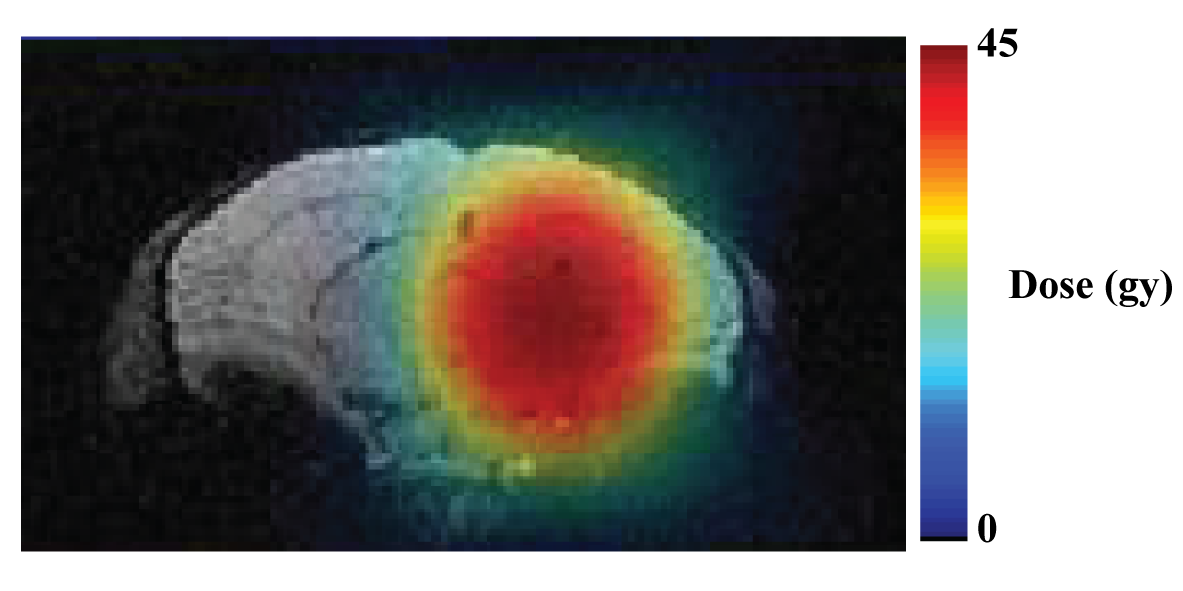
Figure 1. Radiation treatment plan superimposed on an
MR image of a mouse brain.
A single treatment plan delivered 23.1 Gy at 50 % isodose (45 Gy dose at 100%)
with a gamma-knife.
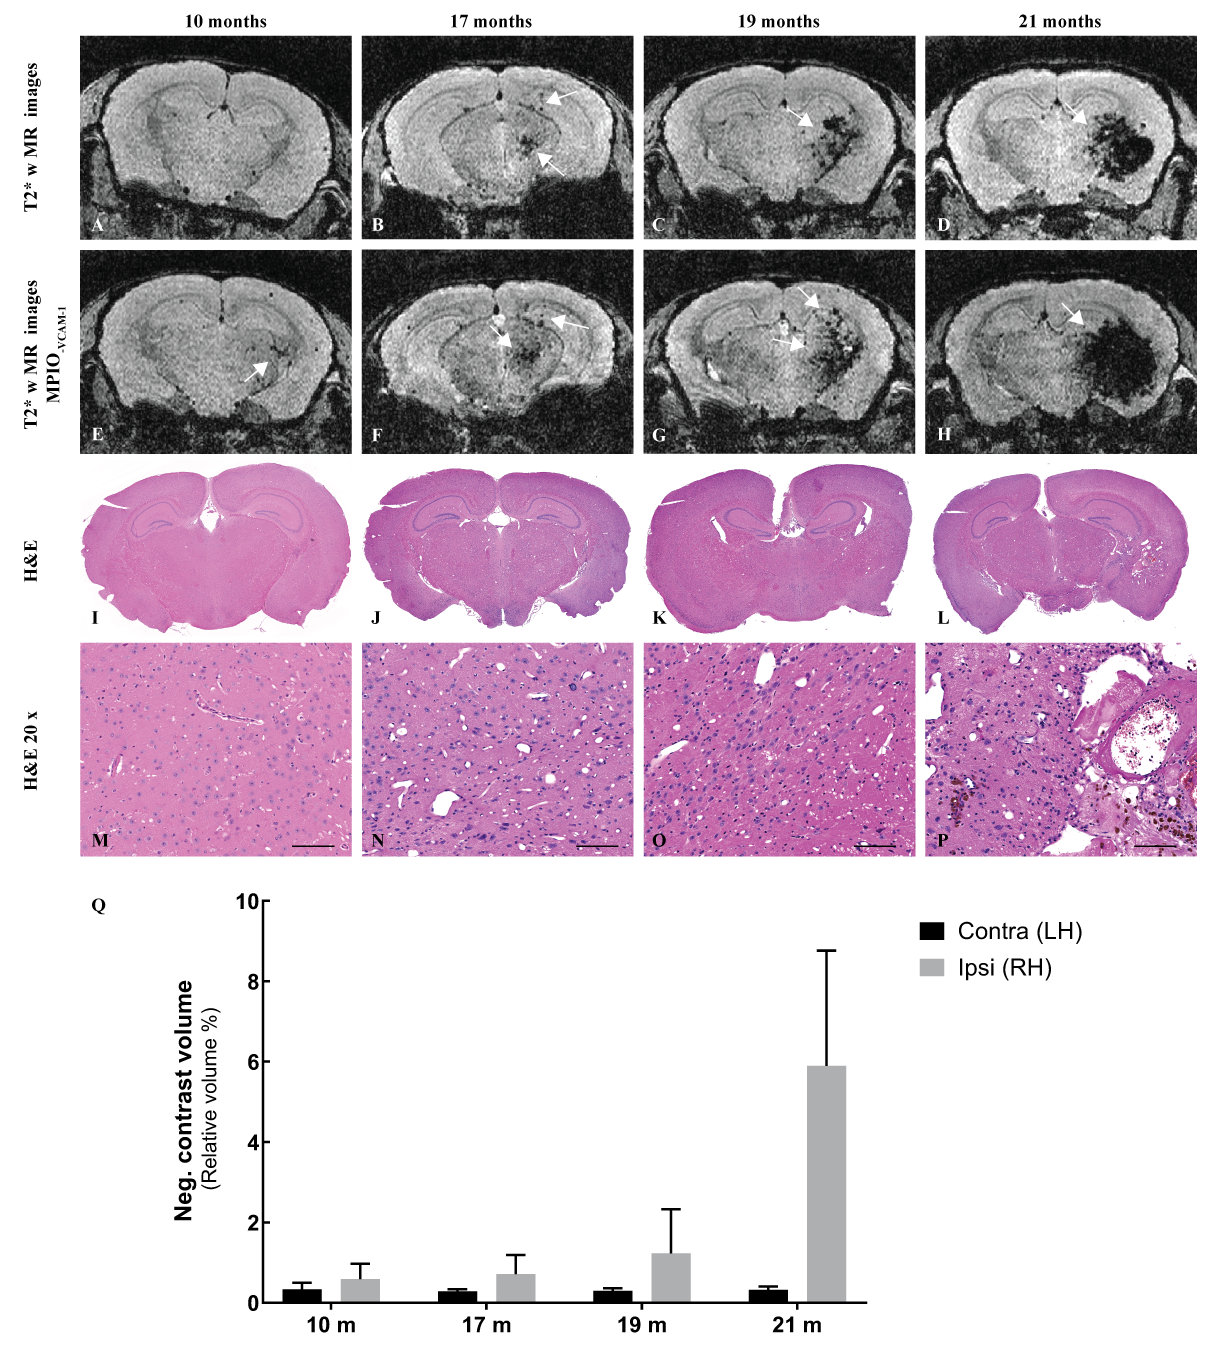
Figure 2. Necrosis and endothelial cells activation
following brain irradiation. Representative 3D T2*-weighted MR images before (A-D)
and after (A-H) injection of MPIO-VCAM-1. On pre-scans, regions of
RN appear as hypointense areas starting at 17 months after irradiation (white
arrows). After MPIO-VCAM-1 injection, the apparent hypointense
volume increases (white arrows). (I-P) H&E –stained brain slides shows RN
necrosis features at 21 months (L and P) (20 x, scale bar: 100 µm). (Q)
The NC volume extracted from pre-injection T2*-w images is larger in the irradiated hemisphere.
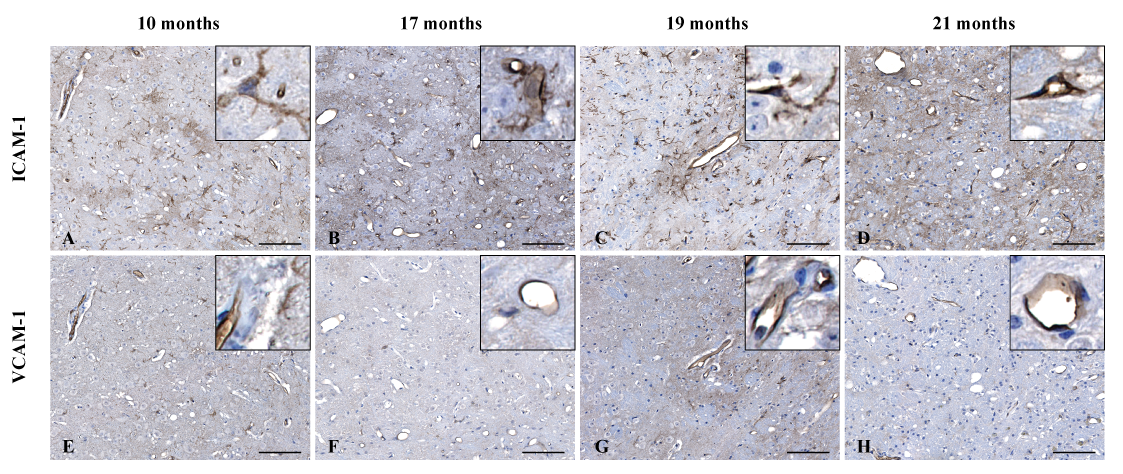
Figure 3. Endothelial cell activation following brain
irradiation. (A-B)
Immunohistochemistry against ICAM-1 showed a strong expression of ICAM-1 on
blood vessels (20 x magnification, scale bar: 100 µm)
as well as parenchymal cells (insert, 80 x magnification). (E-H) VCAM-1 was
found expressed locally on the brain area that received the highest dose, then was
detected on the entire hemisphere at 21 months (H, magnification 20 x, scale
bar: 100 µm).
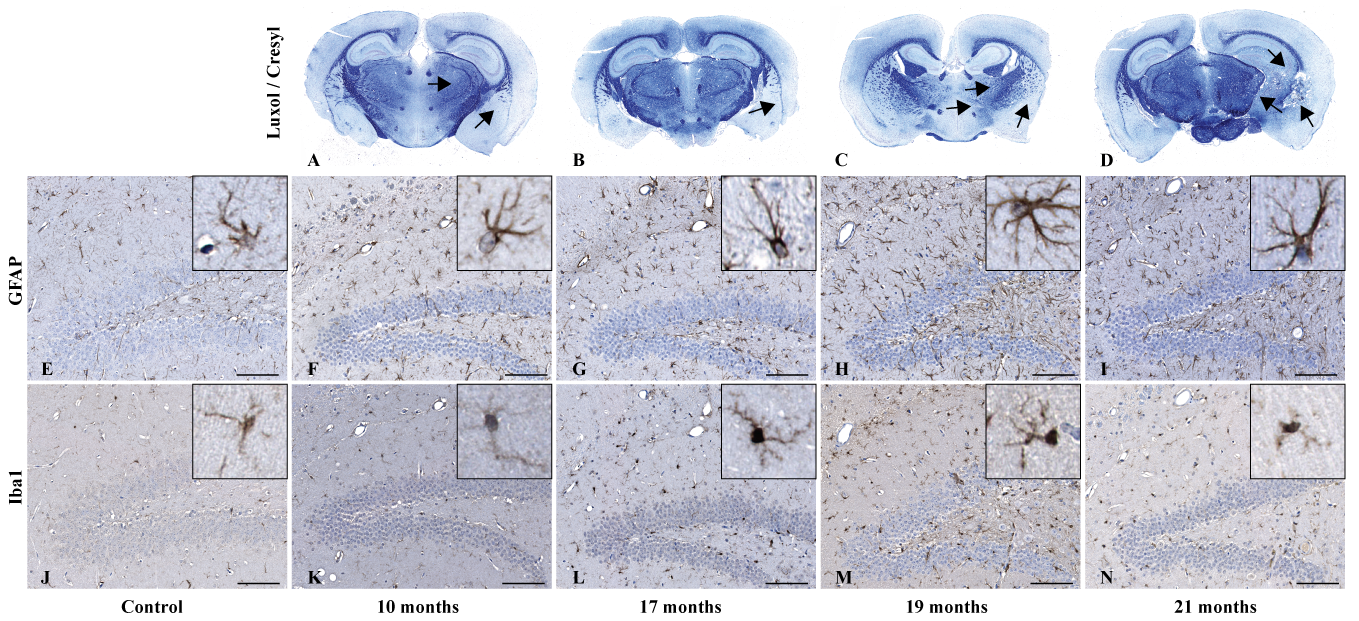
Figure 4. Cellular effect of brain irradiation. (A-D) Histological brain section staining with Luxol
fast blue revealed progressive myelin sheath damage (black arrows –
magnification 1 x). Similarly, immunohistochemistry targeting GFAP (F-I) and
Iba1 (K-N) showed increased astrocytic and microglial cell activation compared
to non-irradiated controls (E and J) (magnification
20 x; scale bar: 100 µm). Inserts show representative individual glial
cell morphology at high-resolution (80 x magnification).