0147
Impact of Single Fraction Stereotactic Radiosurgery vs. Hypofractionated Radiation Therapy on CEST and MT Parameters of Brain Metastases1Physical Sciences, Sunnybrook Research Institute, Toronto, ON, Canada, 2Radiation Oncology, Sunnybrook Health Sciences Centre, Toronto, ON, Canada, 3Radiation Oncology, University of Toronto, Toronto, ON, Canada, 4Medical Biophysics, University of Toronto, Toronto, ON, Canada
Synopsis
Brain metastases are treated with single fraction stereotactic radiosurgery (sf-SRS) or hypofractionated radiation therapy (HFTR). CEST was previously shown to identify responders to sf-SRS within one-week post-treatment. This study investigated the differences in CEST and MT properties of brain metastases treated with sf-SRS and 5 fraction HFRT (5f-HFRT) one week after treatment. We observed statistically significantly larger reduction in CEST properties of tumours treated with sf-SRS compared to those treated with 5f-HFRT. However, changes in MT properties of the two cohort were similar. Such differences should be considered when evaluating response of brain metastases to radiotherapy using CEST and MT.
Introduction
Single fraction stereotactic radiosurgery (sf-SRS) or hypofractionated radiation therapy (HFRT), which involve delivering high doses of radiation focally to the tumour, are the preferred treatment option for brain metastases. sf-SRS uses 18-20Gy in single fraction while HFRT delivers 24-30Gy in 3-5 fractions where the radiation dose and fractionation are determined based on tumour size. We have previously shown chemical exchange saturation transfer (CEST)-MRI can identify responders one week after sf-SRS1.This study probed CEST and quantitative magnetization transfer (qMT) properties of patients treated with sf-SRS and 5-fraction HFRT (5f-HFRT). The objective was determining if changes in CEST/qMT (within one week) were similar between patients treated with sf-SRS and 5f-HFRT, and if these patient populations could be analyzed similarly when assessing treatment response using CEST/qMT.
Methods
Subjects: 54 patients with brain metastases were recruited (REB approved) and MRI-scanned before and one week after start of treatment. There were 35 patients (39 Tumours) treated with 5f-HFRT (27.5-30Gy) and 19 patients (20 Tumours) treated with sf-SRS (18-20Gy). Not all patients participated at the follow-up scan and there were 15 sf-SRS and 34 5f-HFRT tumours at post-treatment scan.MRI: was performed on a 3T Philips Achieva scanner. An axial slice passing through the tumour was imaged with TFE (TR/TE=1971/29ms, TFE-factor=2, Matrix=160×160, FOV=20×20cm, slice=3mm).
CEST: Imaging covered saturation frequency offsets between -5.9 and 5.9ppm in 0.2ppm increments with 4 references at ~780ppm at the beginning and the end of the spectrum. RF saturation included 4 block pulses of 242.5ms each with 2.5ms gaps interleaved and B1=0.52µT2. CEST imaging was repeated twice.
qMT: Imaging covered offsets between 2 and 780ppm with 14 offsets (with equal logarithmic scale spacing). RF saturation consisted of 4 block pulses of 242.5ms each with 2.5ms gaps interleaved and B1=1.5,3,5µT3.
T1,B1,T2 mapping was performed using inversion recovery, WASABI4, and multi-TE imaging.
Analysis: CEST,MT,T1,T2,post-Gd T1w/FLAIR images were co-registered to the first acquired CEST image. Tumour ROI was identified at each scan on post-Gd T1w. Metrics were calculated voxelwise and the median over the ROI was used.
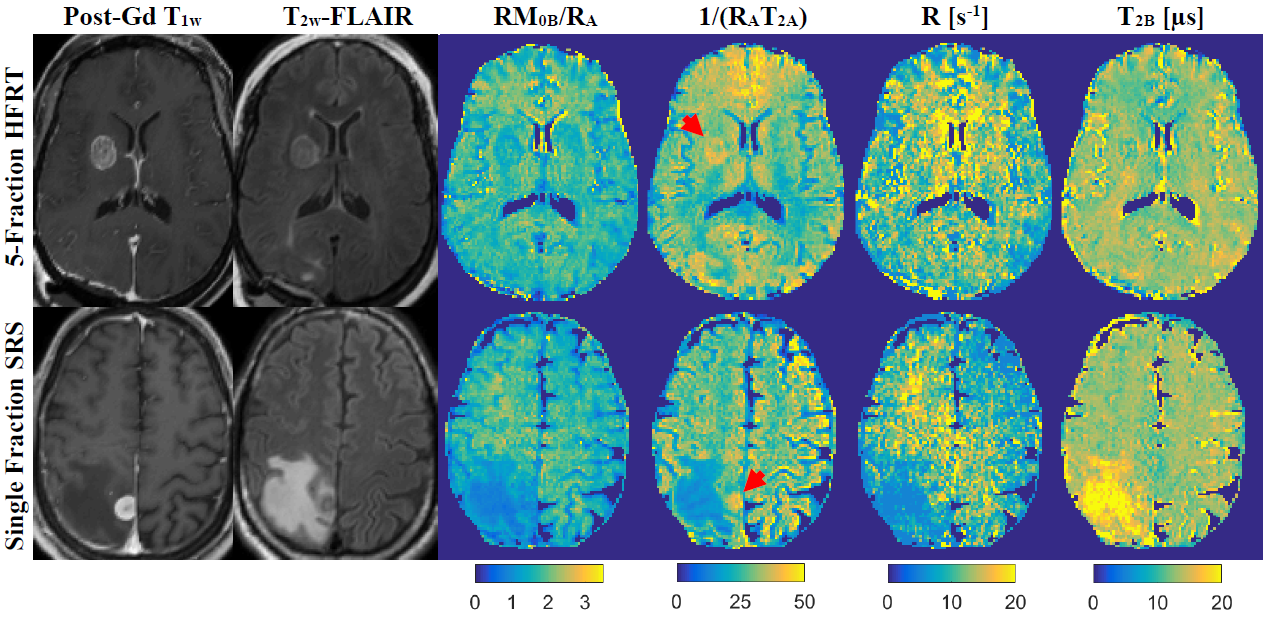
qMT: The three MT spectra were fitted to the two-pool MT model proposed by Henkelman5 in transient state, and the four model parameters [RM0B/RA,T2B,R,1/(RAT2A)] were calculated where RM0B/RA is the amount of magnetization transfer; M0B, the macromolecular pool-size; R, the exchange rate from MT to water pool; RA, the longitudinal relaxation rate of the water pool; and T2A and T2B, the transverse relaxation times of the water and MT pools, respectively.
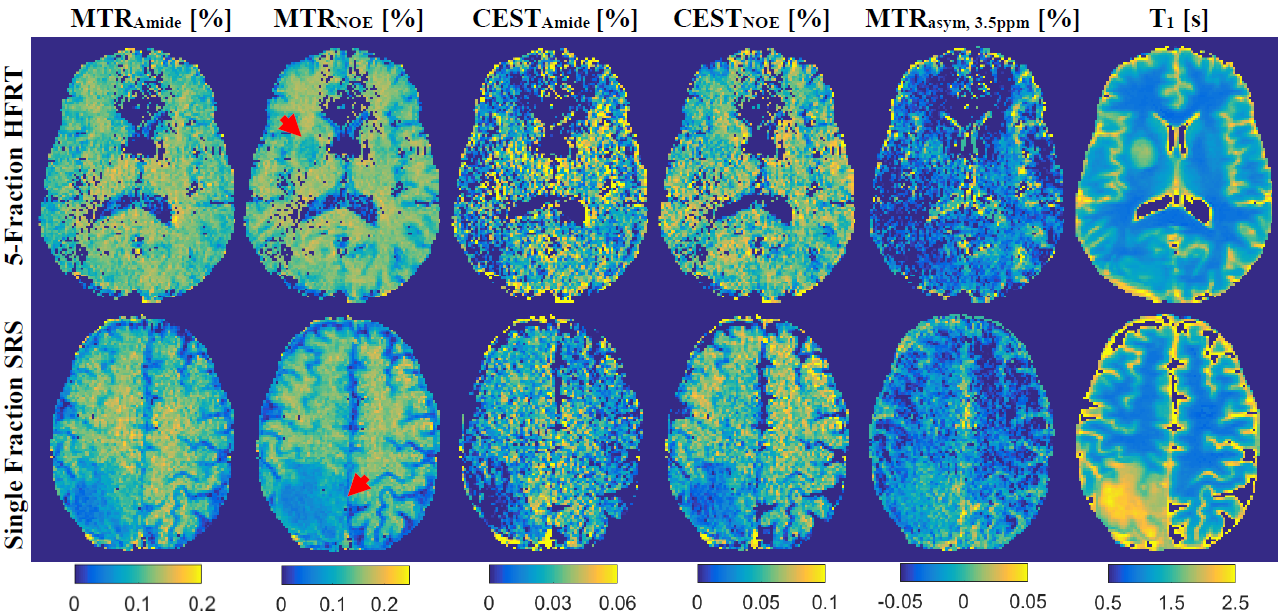
CEST: B0 correction was performed using WASSR6 and drift correction was also performed2. Each spectrum was normalized to its reference and the two normalized CEST spectra were averaged. The amplitude of this spectrum at the peak amide CEST (3.5ppm) and aliphatic nuclear Overhauser effect (NOE; -3.5ppm) offsets were used as MTRAmide and MTRNOE signals, respectively. Then, the MT Z-spectrum was extrapolated using the estimated qMT model parameters to the frequency offsets and B1 amplitude used in the CEST experiment. This spectrum was subtracted from CEST spectrum to isolate the CEST signals and its amplitude at 3.5 and -3.5ppm were used as CESTAmide and CESTNOE signals, respectively.
Results & Discussions
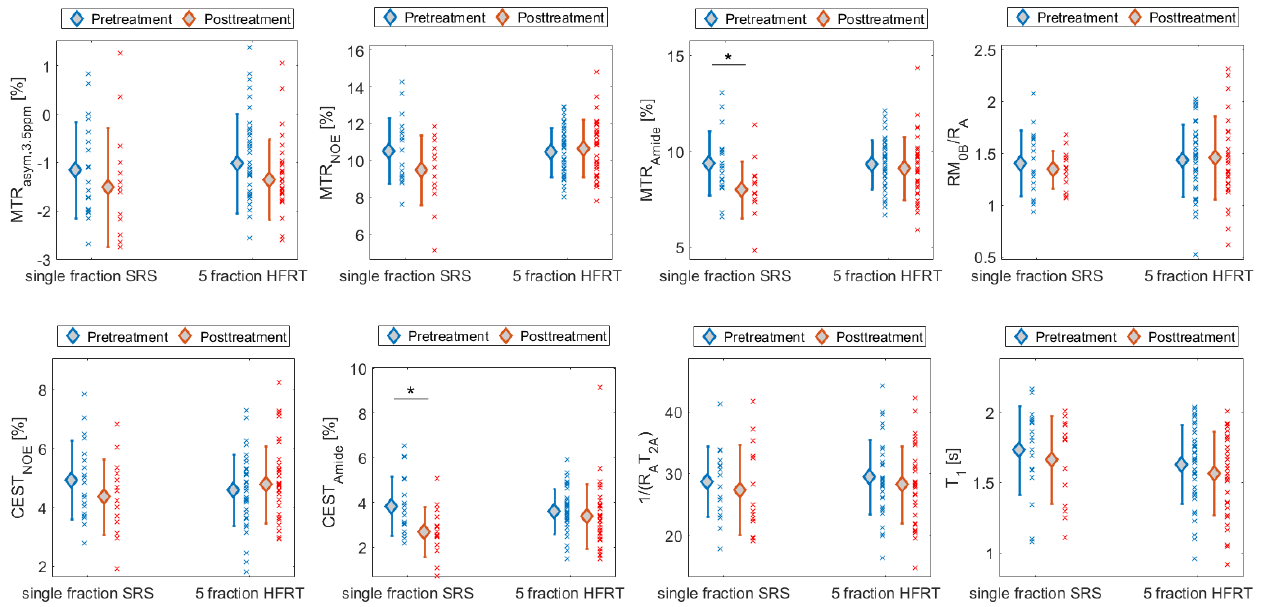
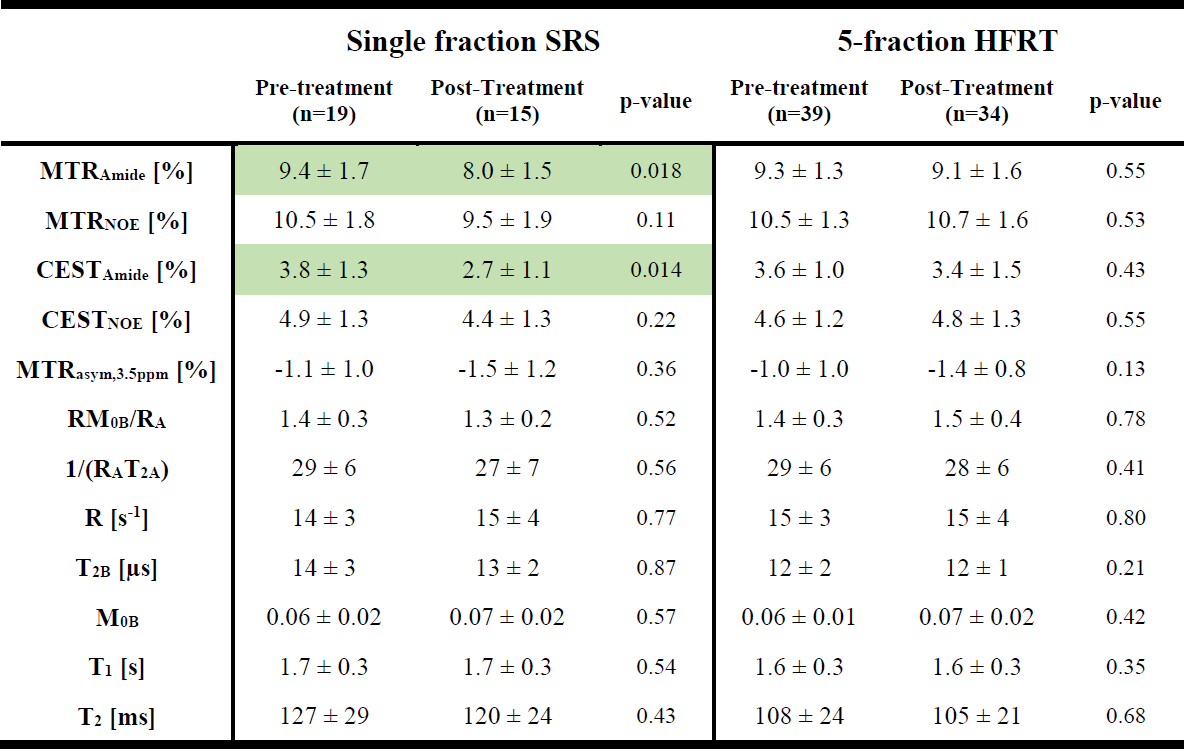
Figure 1 shows post-Gd T1w, T2w-FLAIR images and MT parametric maps for pre-treatment scan of two patients treated with sf-SRS and 5f-HFRT. Fig.2 shows CEST contribution and T1 maps for the two patients at their pre-treatment scans. Table 1 reports CEST and qMT parameters (averaged over all patients). Fig.3 shows the distribution and the parameter value for individual patients at each scan for all patients in each cohort.At baseline, despite heterogeneity in the CEST, MTR and qMT values of tumours at each cohort (i.e., relatively large standard deviations in Fig.3), there was no difference in the CEST, MTR and qMT values between the two cohorts (i.e., the two cohorts were a homogeneous population before treatment).
At one week post-treatment scan (compared to the pre-treatment), MTRNOE and MTRAmide of patients treated with sf-SRS were significantly lower than those treated with hypofractionation (11% lower,p=0.029 for MTRNOE and 12% lower,p=0.033 for MTRAmide).
When comparing the pre-treatment and post-treatment scans of patients in each cohort, for patients treated with sf-SRS, there was a statistically significant reduction in CESTAmide and MTRAmide (29% reduction,p=0.014 for CESTAmide and 15% lower,p=0.018 for MTRAmide). However, for patients treated with 5f-HFRT, although there were some changes in CEST and MTR values, they were small and were not statistically significant (6% reduction,p=0.43 for CESTAmide, and 2% reduction,p=0.55 for MTRAmide).
Thus, for 5f-HFRT patients, the interval between pre-treatment and follow-up scan may need to be longer than one week to better determine treatment effects. Moreover, the qMT properties and T1 were not different for either cohort between the two scan time points.
Conclusions
CEST and qMT are sensitive to radiotherapy and may characterize treatment effects early. Considering the expected impact of radiotherapy on the tumour is reduction in the CEST and MTR values, the current study demonstrates the magnitude of their changes depend on how the treatment is being delivered and there was significantly larger change in CEST, MTR when the full dose was given with sf-SRS. Thus, these two cohorts need to be analyzed separately when determining response to treatment using CEST.Acknowledgements
This study was funded by Terry Fox Research Institute (TFRI project 1034), Canadian Cancer Society Research Institute (CCSRI 701640) and Brain Canada grant (CCSRI 705083).References
1. Desmond KL, Mehrabian H, Chavez S, et al. Chemical exchange saturation transfer for Predicting response to stereotactic radiosurgery in human brain metastasis. Magn Reson Med. 2017;78(3):1110-1120. doi:10.1002/mrm.26470
2. Mehrabian H, Desmond KL, Soliman H, Sahgal A, Stanisz GJ. Differentiation between radiation necrosis and tumor progression using chemical exchange saturation transfer. Clin Cancer Res. 2017;23(14):3667-3675. doi:10.1158/1078-0432.CCR-16-2265
3. Mehrabian H, Myrehaug S, Soliman H, Sahgal A, Stanisz GJGJ. Quantitative Magnetization Transfer in Monitoring Glioblastoma (GBM) Response to Therapy. Sci Rep. 2018;8(1):2475. doi:10.1038/s41598-018-20624-6
4. Schuenke P, Windschuh J, Roeloffs V, Ladd ME, Bachert P, Zaiss M. Simultaneous mapping of water shift and B1(WASABI)—Application to field-Inhomogeneity correction of CEST MRI data. Magn Reson Med. 2017;77(2):571-580. doi:10.1002/mrm.26133.
5. Henkelman RM, Huang X, Xiang QS, Stanisz GJ, Swanson SD, Bronskill MJ. Quantitative interpretation of magnetization transfer. Magn Reson Med. 1993;29:759-766.
6. Kim M, Gillen J, Landman BA, Zhou J, van Zijl PCM. Water saturation shift referencing (WASSR) for chemical exchange saturation transfer (CEST) experiments. Magn Reson Med. 2009;61(6):1441-1450.
Figures