0145
Immune Checkpoint Blockade (ICB) Response Evaluation with MRI/MR Elastography (MRE) in Surgical and Non-Surgical Patients with HCC1Radiology, MD Anderson, Houston, TX, United States, 2Interventional Radiology, MD Anderson, Houston, TX, United States, 3Imaging Physics, MD Anderson, Houston, TX, United States, 4Cancer Systems Imaging, MD Anderson, Houston, TX, United States, 5Biostatistics, MD Anderson, Houston, TX, United States, 6GI Medical Oncology, MD Anderson, Houston, TX, United States, 7Epidemiology, MD Anderson, Houston, TX, United States, 8Hemopathology, MD Anderson, Houston, TX, United States, 9Pathology, MD Anderson, Houston, TX, United States, 10Radiology, Mayo Clinic, Rochester, MN, United States, 11Radiation Oncology, Massachusetts General Hospital, Boston, MA, United States, 12MD Anderson, Houston, TX, United States
Synopsis
Newer systemic treatments for advanced hepatocellular carcinoma (HCC) include immune checkpoint blockade (ICB) which act through increasing cytotoxic T-cell mediated response to tumor. There is a lack of biomarkers of ICB response and treatment outcomes are not correlated with change in tumor size. We evaluated MRI imaging features of HCC and change in tumor stiffness after 6 weeks immunotherapy in surgical and non-surgical patients. An increase in HCC stiffness on MRE after 6 weeks treatment was significantly correlated with treatment response. Longitudinal measurement of tumor stiffness on MRE provides a novel technique for early immunotherapy response assessment.
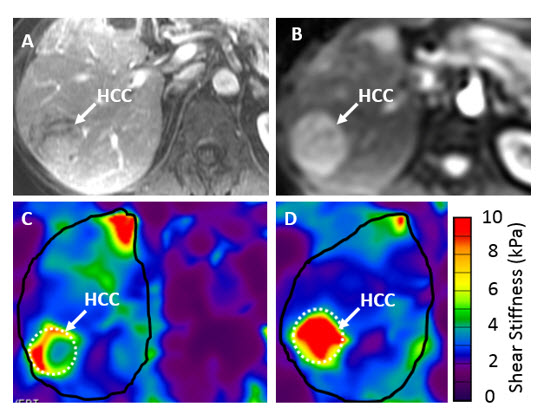
MRI and MRE was performed on a 3T whole body MRI scanner with a 32‐channel phased‐array torso coil. Liver MRI included the following: axial T2-weighted FRFSE, coronal SSFSE, axial IDEAL-IQ; T2* mapping for iron and fat quantification; axial DWI (b-values 50, 400, 800); axial LAVA pre- and post-dynamic contrast enhancement with gadoxetate and 20 minute delay (hepatobiliary phase) imaging. Liver MRE exam was performed with acoustic waves at 60 Hz 3. Data was acquired using a 2D-echoplanar imaging (EPI) based MRE sequence with the following imaging parameters: TR/TE = 600ms/min; slice thickness/gap =7/2.5mm; FOV 38-42cm; matrix = 64x64; NEX = 2; motion encoding gradient along the z-direction, 6 axial slices through widest cross-section of the liver including the bulk of the tumor; parallel imaging factor = 2, and acquisition time = 16-19 seconds. Automated in-line post-processing was used to generate quantitative maps or “elastograms” of liver shear stiffness in units of kilopascals (kPa) 3-5.
Images were reviewed by 2 radiologists blinded to data on treatment response. Percent HCC enhancement was categorized on arterial phase images using a 5-point scale (0-4): none=0, <25%=1, 25-50%=2, >50 to 75%=3, >75% =4. HCC size was measured on 20 minute delay contrast-enhanced images (hepatobiliary phase). MRE-derived average stiffness measurements (kPa) were measured by placing regions-of-interest (ROIs) on the MRE elastograms (stiffness maps) as previously described 5, 6. Average HCC stiffness was measured by drawing ROIs on the elastograms covering as much of the tumor as possible on adjacent slices (minimum of 2 slices). In the case of multiple tumors, the largest tumor was selected. HCC apparent diffusion coefficient (ADC) was measured by placing ROIs to include the darkest regions of the tumor on the ADC map.
Spearman rank correlation was estimated between imaging measurements (baseline and change in both HCC size and stiffness, ADC value and percent arterial phase enhancement) at the 2 time-points and treatment response. Wilcoxon rank-sum test or Fisher’s Exact test was used for comparison of HCC stiffness and change in stiffness between non-responders and responders; p-value <0.05 was considered statistically significant. Statistical analyses was performed using SAS version 9.3 and JMP version 14.0 (SAS Institute, Cary, NC).
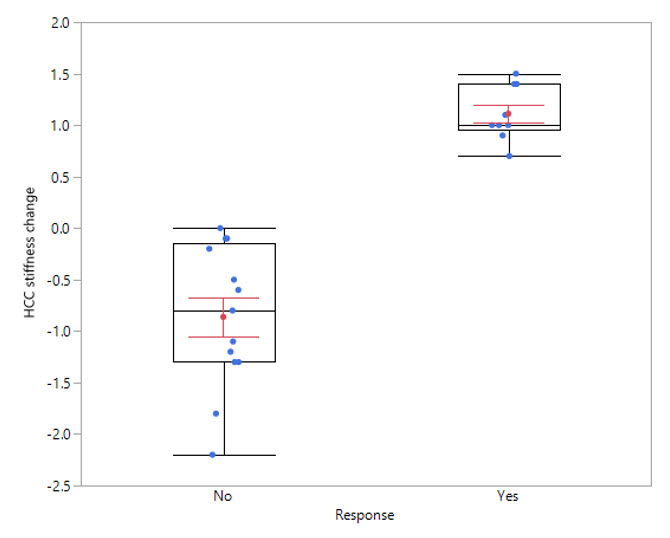
Median HCC size and change in size were 4.7 cm (1.2, 14.0) and –0.32 cm, respectively. Median baseline HCC stiffness and change in stiffness were 5 kPa (2.2, 12.4) and –0.1 kPa (–2.2, 1.5), respectively. Median change in HCC size for responders and non-responders was –1.2 cm (–4.8, 0.4) and 0 cm (–1.5, 1.1), respectively (p=0.02).
Treatment response was significantly correlated with increase in HCC stiffness at 6 weeks (p< 0.001), Figures 1 and 2. No significant correlation was seen between treatment response and change in HCC size, ADC value, or percent HCC enhancement.
Acknowledgements
No acknowledgement found.References
References:
1. Poon RT, Fan ST, Lo CM, Liu CL, Wong J. Long-Term Survival and Pattern of Recurrence After Resection of Small Hepatocellular Carcinoma in Patients With Preserved Liver Function Implications for a Strategy of Salvage Transplantation. Annals of Surgery, 2002; 235:373-382
2. Sun L, Xu G, Liao W, Yang H, Xu H, Du S, et al. Clinicopathologic and prognostic significance of regulatory T cells in patients with hepatocellular carcinoma: a meta-analysis. Oncotarget, 2017; 8:39658–39672
3. Xu W, Liu K, Chen M, Sun JY, McCaughan GW, Lu XJ, et al. Immunotherapy for hepatocellular carcinoma: recent advances and future perspectives. Ther Adv Med Oncol, 2019; 11: 1–15
4. Venkatesh SK, Yin M, Ehman RL. Magnetic Resonance Elastography of Liver: Technique, Analysis and Clinical Applications. J Magn Reson Imaging. 2013 March; 37(3): 544–555. doi:10.1002/jmri.23731
5. Pepin KM, Chen J, Glaser KJ, Mariappan YK, Reuland B, Ziesmer S, Carter R, Ansell SM, Ehman RL, McGee KP. MR elastography derived shear stiffness--a new imaging biomarker for the assessment of early tumor response to chemotherapy. Magn Reson Med 2014; 71:1834-40 PMID: 23801372
6. Horger M, Lauer UM, Schraml C, Berg CP, Koppenhӧfer U, Claussen CD, et al. Early MRI response monitoring of patients with advanced hepatocellular carcinoma under treatment with the multikinase inhibitor sorafenib. BMC Cancer 2009; 9:208
7. Qayyum A, Hwang KP, Stafford J, Verma A, Maru D, Sandesh S, Sun J, Pestana RC, Avritscher R, Hassan M; Amin HM, Rashid A, Wistuba II, Ehman RL, Ma J, Kaseb A. Immunotherapy Response Evaluation with Magnetic Resonance Elastography (MRE) in Advanced HCC. JITC. In Press
8. Kaseb AO, Vence L, Blando J, Yadav S, Ikoma N, Pestana RC, et al. Immunologic Correlates of Pathologic Complete Response to Preoperative Immunotherapy in Hepatocellular Carcinoma. Cancer Immunol Res, 2019; 7: 1390-1395
Figures