0144
The Role of Iron Chelation in the Tumour Microenvironment of Triple-Negative Breast Cancer1Medical Physics, Memorial Sloan Kettering Cancer Center, New York, NY, United States, 2Department of Medicine, Memorial Sloan Kettering Cancer Center, New York, NY, United States, 3Molecular Pharmacology Program, Memorial Sloan Kettering Cancer Center, New York, NY, United States, 4Weill Cornell Medical College, Cornell University, New York, NY, United States
Synopsis
Intracellular iron, essential for cancer cell proliferation and metabolism, is modified in cancer cells. Triple-negative breast cancers are metastatic cancers associated with a high recurrence rate, poor prognosis and lack of effective targeted therapies. We are investigating the potential of Deferiprone, a clinically approved intracellular iron chelator for non-cancer related diseases, to improve chemotherapeutic treatment response in triple-negative breast cancer by altering iron-dependent proliferation and metabolism. The effectiveness of Deferiprone to impair triple-negative breast cancer cell growth and affect cellular metabolism was evaluated by monitoring live cells, exposed to Deferiprone, in an MR-compatible cell bioreactor using multi-nuclear MRS.
Introduction
Triple-negative breast cancers (TNBC) lack estrogen (ER-), progesterone (PR-) and HER2- receptors and are metastatic cancers associated with a high recurrence rate, poor prognosis and lack of effective targeted therapies. Infiltration of iron-rich tumour-associated macrophages promotes tumour progression.1,2 Cellular iron is essential for cell proliferation3 and metabolism and increases cancer cell susceptibility to modest iron deficiency.5-7 Deferiprone (DFP), a clinically approved iron chelator for non-cancer related diseases,8 enters cancer cells and alters iron-dependent enzyme activities by decreasing intracellular iron.9-11 Based on preliminary data showing a DFP-induced cytostatic effect in multiple breast cancer cell lines (Table 1), we investigate the mechanism of DFP to induce cell cytostasis in TNBC and its potential to improve chemotherapeutic treatment response in combination therapy. Specifically, the effectiveness of DFP to impair TNBC cell growth and affect cellular metabolism was evaluated in live cells in an MR-compatible cell bioreactor12 by measuring the metabolization of 13C-1-Glucose using13C-MRS and cell energy state by 31P-MRS.Methods
Murine metastatic TNBC 4T1 cells were grown in Dulbecco’s Modified Essential (DME) medium, containing 25 mM glucose, 6 mM glutamine, 10% fetal bovine serum, and 1% penicillin/streptomycin at 37 ⁰C in humidified 5% CO2 / 95% air. For the MR-cell bioreactor studies, 4T1 cells were cultured on microcarriers (125-212 μm diameter; PP3772, Corning, New York, NY; 3×10⁶ cells/0.5 ml beads×6) to ~70% confluence. Cell number and viability were estimated from a representative sample at the start (#cellsinitial) and end (#cellsend) of each MR experiment by Trypan Blue exclusion. Continually perfused, live cells were studied in an MR-compatible cell bioreactor12 on a 500 MHz MR system (Bruker BioSpin, Billerica, MA) equipped with a 10-mm broad-band probe for 1H and 31P/13C scans. To monitor metabolism changes, cells were continuously perfused for 31 hours with DME media. After 1 h setup and the first 31P MR spectrum, the un-labeled perfusion medium was replaced with medium containing 25 mM 1-13C-labeled glucose for the remaining 30 h of experiment. Three independent experiments were performed in regular medium conditions (CTRL) and three in medium containing 100 µM DFP (DFP-treated). During each experiment, 1H-decoupled, Nuclear Overhauser Effect-enhanced 13C MR spectra (TR = 1200 s, 45 degree flip angle, 30 kHz sweep width, 8k points, 1000 averages, 20 min acquisition time) were acquired repeatedly interspaced with two consecutive 31P spectra (TR = 1200 s, 45 degree flip angle, 20 kHz sweep width, 2k points, 1800 averages, 30 min acquisition time) every six hours. Quantification of MR spectral peaks was performed in time domain using AMARES (jMRUI v5.2). Metabolites were normalized to the β-NTP signal of the first 31P MR spectrum (βNTPinit). A two-tail unpaired Student t test was used to compare DFP-treated and untreated (CTRL) 4T1 cell data. The effect of DFP on the migration of confluent 4T1 cells was assessed by wound healing assay.3Results
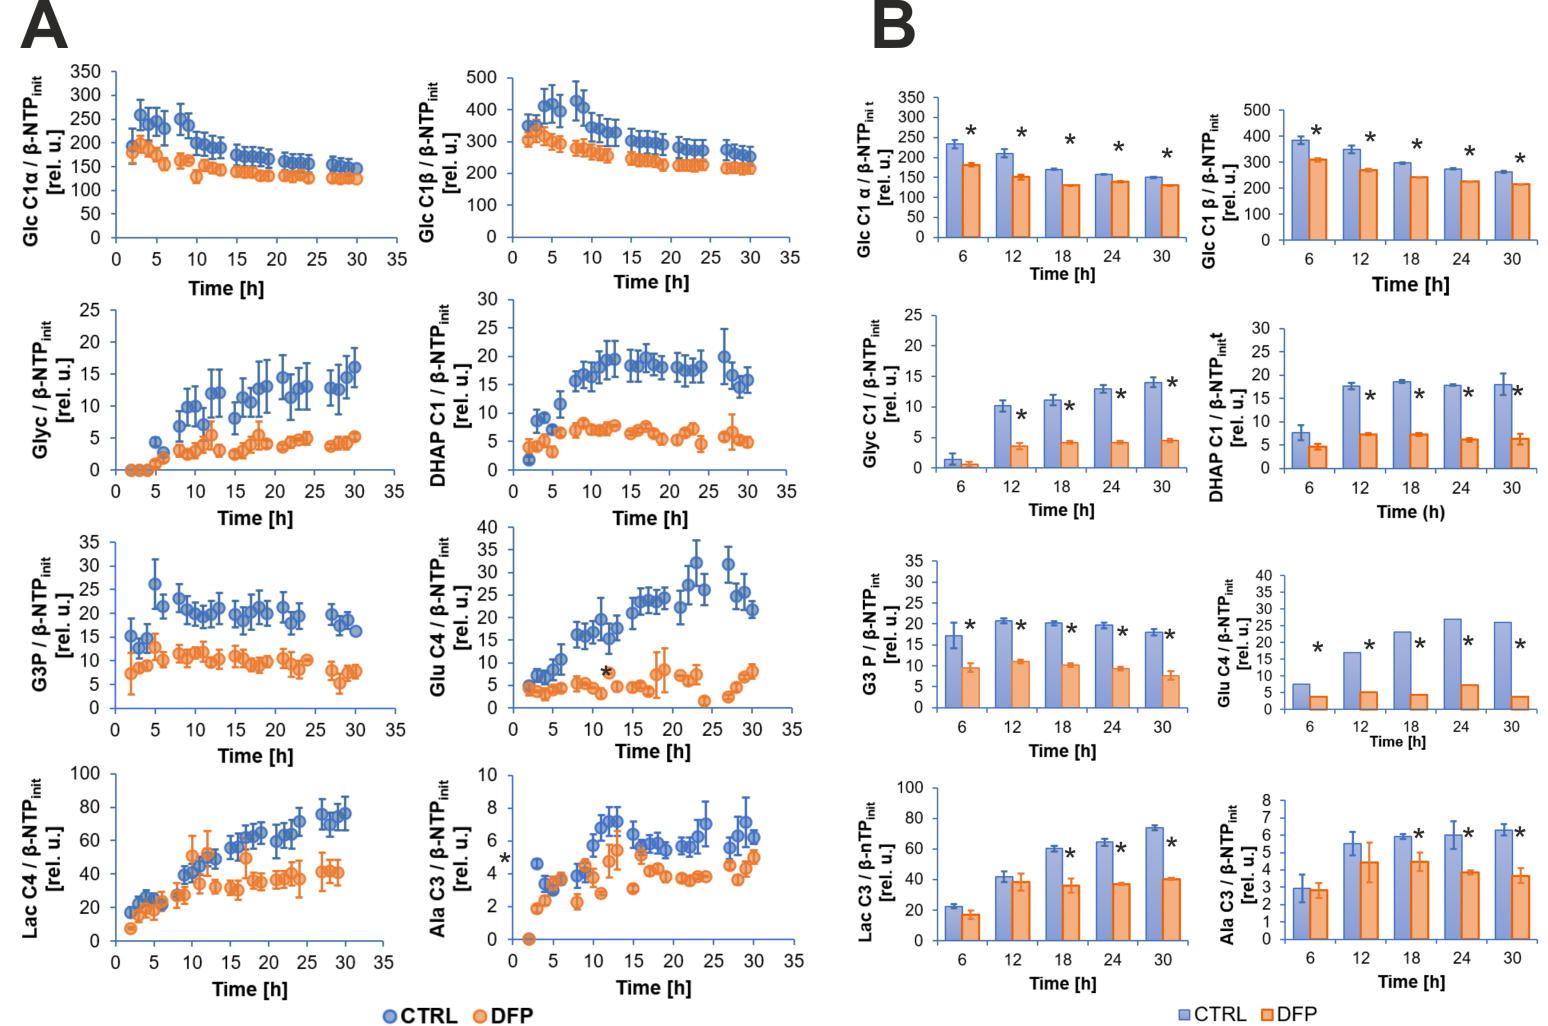
Figure 2A shows the comparison between the cell count ratios rC=[#cellsend/#cellsinitial] of each experiment and the corresponding cellular energy ratios (rE=[β-NTPend/β-NTPinit]) determined for both DFP-treated and untreated cells. In DFP-treated 4T1 cells the cell mass was significantly lower than in untreated 4T1 cells, whereas rE decreases significantly slower than the cell loss determined by cell counting. This agrees with our IC50 studies showing decreased proliferation caused by DFP. Wound healing is significantly reduced in DFP-treated 4T1 cells at 24 and 36 h exposure, delaying wound closure to about 48 h compared to the 36 h in untreated and 50 µM DFP-treated 4T1 cells (Fig. 2B). Figure 3A shows representative 31P spectra of DFP-treated and untreated 4T1 cells acquired at 31 h. The time course of β-NTP levels is similar between DFP-treated and control 4T1 cells (Fig. 3B). The phospholipid precursors PCho (Fig. 3C) and GPCho (data not shown) exhibit significant differences between DFP-treated and control 4T1 cells at the latest time points. The intracellular pH was stable throughout and unaffected by DFP (data not shown). Representative 13C spectra acquired over time in control and DFP-treated cells are shown in Figure 4. The quantitative evaluation of 13C spectra metabolites of DFP-treated and control 4T1 cells (Fig. 5), show various average metabolite levels that differ significantly between DFP-treated and untreated 4T1 cells. Specifically, less glucose-C1 signal loss, lower lactate-C3, glutamine-C4, fatty acid chains (CH2)n, and Alanine-C3 13C-labelling were found in DFP-treated than in control 4T1 cells.Discussion
Our findings that DFP exposure of TNBC 4T1 cells can impair their migration and cell growth (Fig. 2) agrees with our previous findings in prostate cancer.3 Changes in PCho (Fig. 3C), GPCho and GPCho/PCho indicated subtle phospholipid membrane turnover differences between DFP-treated and control cells. The time course effects of DFP on 4T1 cell metabolism, assayed by 13C MRS (Fig. 5), suggest that DFP exposure affects the Krebs cycle, cell energy and fatty acid metabolism in accordance with our previous study using live TRAMP-C2 cells.3Conclusion
In conclusion, this study shows the cytostatic effect of DFP on the TNBC 4T1 cells and can be considered as a first step for a potential clinical translation in combination therapy into humans. Clinical translation is straightforward considering that Deferiprone is already approved clinically for non-cancer related diseases.Acknowledgements
This work was support by grants W81ZWH-17-1-0525 (JAK) and P30CA008748 (Cancer Center Support Grant). We thank Dr. RV Simões for helpful discussions and the Molecular Cytology Core Facility for their assistance with the wound healing assay.References
- Wang J, Chen H, Chen X, et al. Med Sci Monit. Expression of Tumor-Related Macrophages and Cytokines After Surgery of Triple-Negative Breast Cancer Patients and its Implications. 2016; 22:115-20.
- 2. Yuan ZY, Luo RZ, Peng RJ, et al. High infiltration of tumor-associated macrophages in triple-negative breast cancer is associated with a higher risk of distant metastasis. Onco Targets Ther. 2014;21(7):1475-80.
- Simoes RV, Veeraperumal S, Serganova IS, et al. Inhibition of prostate cancer proliferation by Deferiprone. NMR Biomed. 2017;30(6).
- Pinnix ZK, Miller LD, Wang W, et al. Ferroportin and iron regulation in breast cancer progression and prognosis. Sci Transl Med. 2010;2(43):43ra56.
- Freitas I, Boncompagni E, Varracone R, et al. Iron accumulation in mammary tumor suggests a tug of war between tumor and host for the microelement. Anticancer Res. 2007; 27(5A):3059-65.
- Hann HW, Stahlhut MW, Blumberg BS. Iron nutrition and tumor growth: decreased tumor growth in iron-deficient mice. Cancer Res. 1988;48(15):4168-70.
- Hann HW, Stahlhut MW, Menduke H. Iron enhances tumor growth. Observation on spontaneous mammary tumors in mice. Cancer. 1991;68(11):2407-10.
- Piga A, Roggero S, Salussolia I, et al. Deferiprone. Ann N Y Acad Sci. 2010;1202:75-8.
- Beinert H, Kennedy MC. Aconitase, a two-faced protein: enzyme and iron regulatory factor. FASEB J. 1993;7(15):1442-9.
- Glickstein H, El RB, Shvartsman M, et al. Intracellular labile iron pools as direct targets of iron chelators: a fluorescence study of chelator action in living cells. Blood. 2005;106(9):3242-50.
- Goncalves S, Paupe V, Dassa EP, et al. Deferiprone targets aconitase: implication for Friedreich's ataxia treatment. BMC Neurol. 2008; 8:20.
- Simoes RV, Serganova IS, Kruchevsky N, et al. Metabolic plasticity of metastatic breast cancer cells: adaptation to changes in the microenvironment. Neoplasia. 2015; 17(8):671-84
Figures
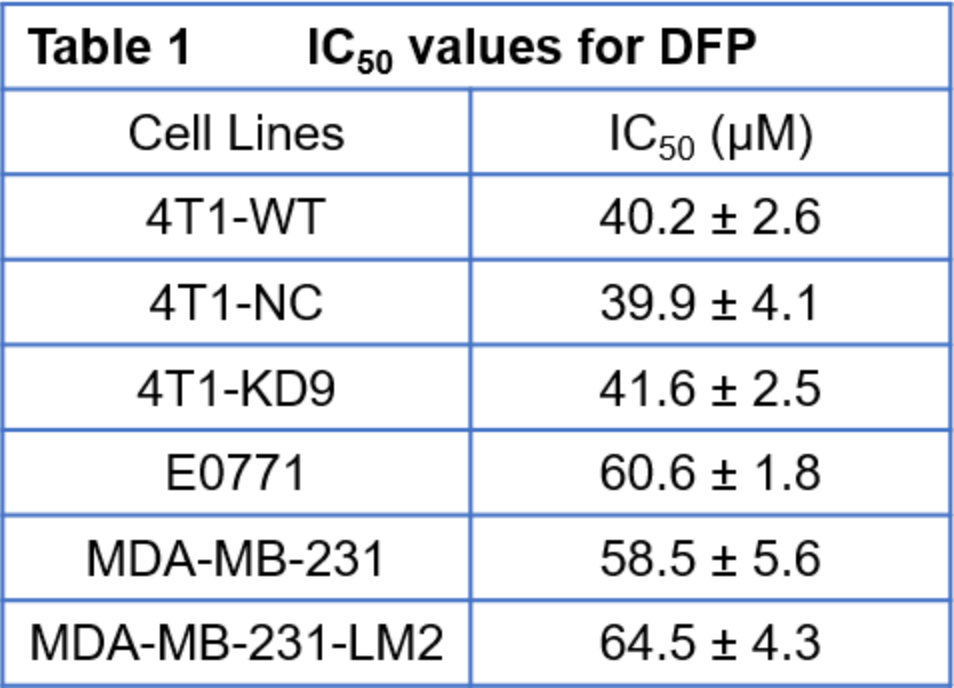
Each cell line was exposed to Deferiprone (DFP) for 48 h in each of three independent experiments. Data are mean ± SD
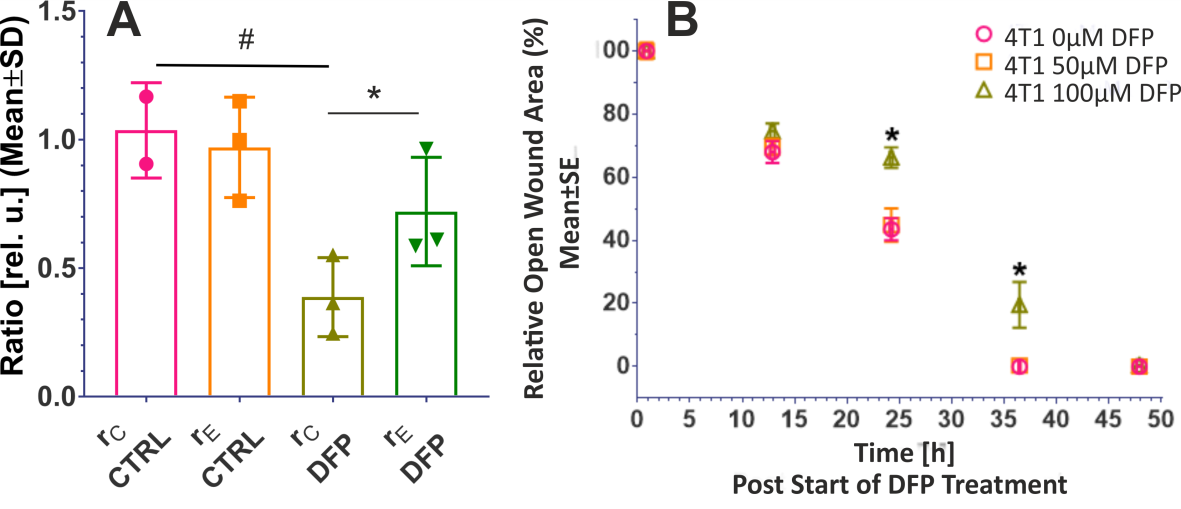
Figure 2. A. Cell growth. Comparison between the ratio, rC, of counted cells at the end and start of each experiment (rC=#cellsend/#cellsint), and the corresponding cellular energy ratio (rE=β-NTPend/ β-NTPinit) in DFP-treated and untreated 4T1 cells. B. Cell migration. Wound closure as function of DFP exposure for cells treated with 0, 50 and 100 µM DFP, respectively. * p < 0.05 2-way ANOVA, Tukey's multiple comparison (swapped directions).
Data in A and B are averaged over three independent experiments, respectively.
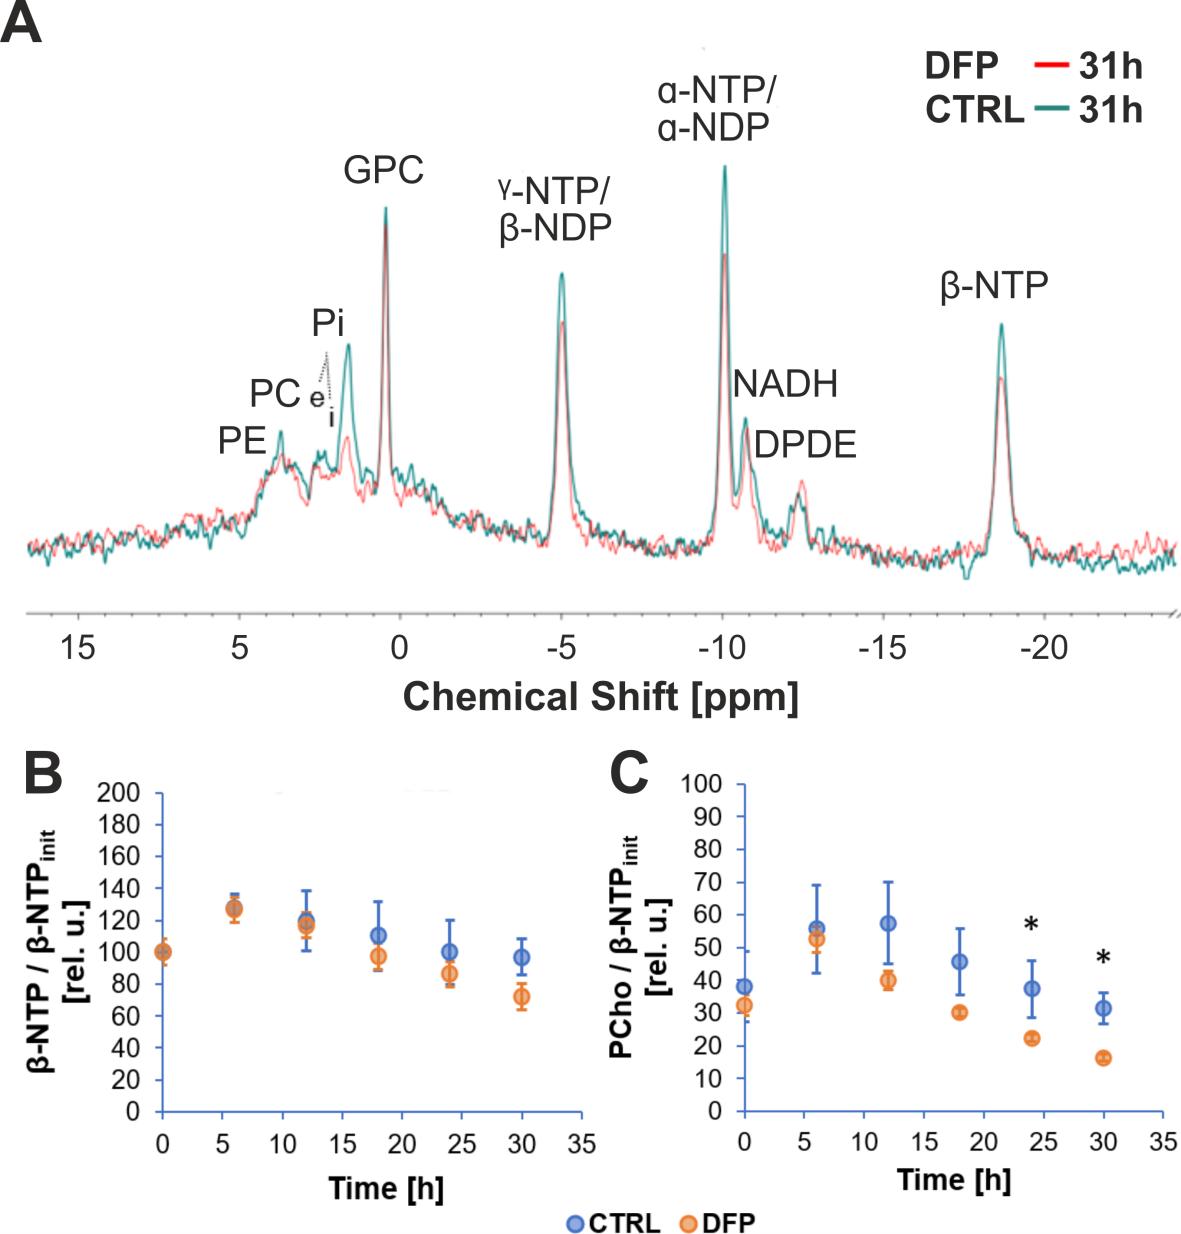
Figure 3: A Representative 31P spectra of DFP-treated and untreated 4T1 cells, acquired at 31 h.
B,C: Time course of β-NTP (B) and PCho (C). PCho levels differ significantly between untreated and DFP-treated (100 µM DFP) 4T1 cells (* p < 0.05, unpaired t test) at the latest time points. PCho changes indicates phospholipid membrane turnover differences between DFP-treated and control cells. Data are mean ± standard error, n = 3.
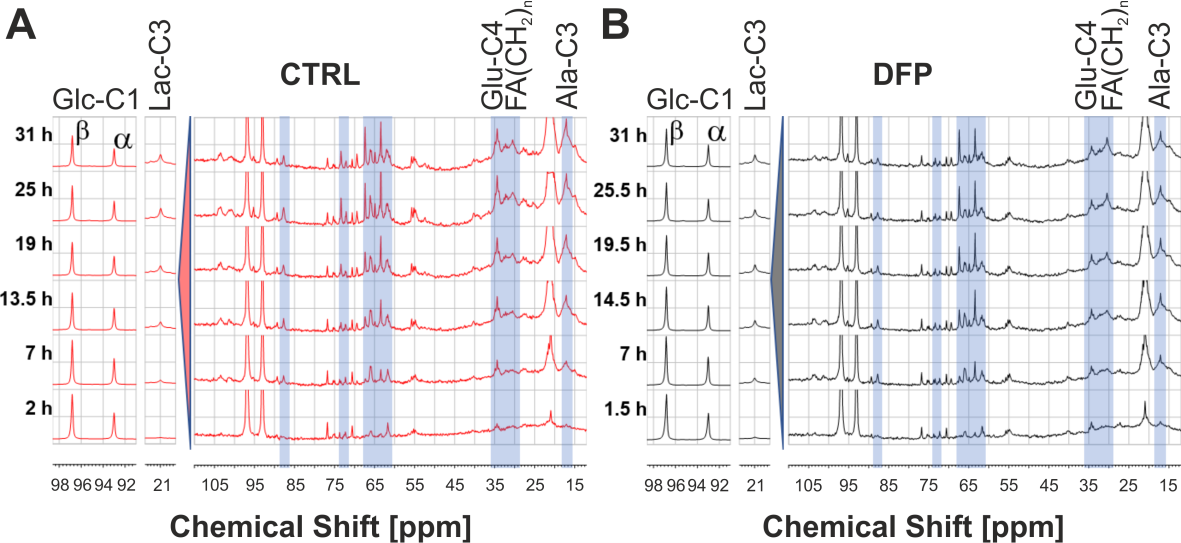
Figure 4 Representative 13C spectra of DFP-treated (100 µM) and untreated 4T1 cells over time.