0142
How the choice of PK model and AIF affect DCE-MRI detection of pancreatic cancer responses to stroma-directed drug?1Department of Radiology, University of Pennsylvania, Philadelphia, PA, United States, 2Pancreatic Cancer Research Center, University of Pennsylvania, Philadelphia, PA, United States, 3Abramson Cancer Center, University of Pennsylvania, Philadelphia, PA, United States
Synopsis
Pancreatic ductal adenocarcinoma (PDA) is characterized by a dense stroma, which poses a substantial barrier to drug penetration and motivates development of stroma-directed interventions. We aim to test the utility of DCE-MRI to predict PDA responses to such treatment. We compared individual versus group-arterial input function approach and metric including Ktrans, kep and Vp derived from three commonly used pharmacokinetic models. Our data provides rationale for choice of PK model and AIF approach which lead to quantitative DCE-MRI marker of optimal sensitivity and specificity for detection of PDA responses to human hyaluronidase that reduces PDA stroma.
METHODS: Cells (4662-KPC) were obtain from dissected tumor in KPC mice, a genetically engineered mouse (GEM) model of PDA 6 as described earlier 3. An orthotopic PDA model was generated by injection of 1.25x10⁵ 4662-KPC cells into the pancreas of syngeneic mice by a surgical procedure 7. Mice were subjected to DCE-MRI at baseline and 24 h after one iv injection of PEGPH20 (1 mg/ kg) or vehicle (VEH). PEGPH20 (PP) is an investigational drug that degrades hyaluronan (HA) in PDA extracellular matrix 2. Tumors were harvested after imaging for assessing HA level by immunostaining. MRI studies were performed on a 9.4T DirectDrive® system (Agilent) interfaced with a 12-cm gradient coil. DCE protocol to generate T10 map of tumor and blood (T1 before CA injection), DCE-series, AIF and for individual mice were described earlier 7. MultiHance® diluted to 10 mM of gadolinium in saline was injected in 0.2 mL via tail vein. Group-AIF was the average of 20 AIFs measured from 10 mice; each mouse contributed two AIFs, one obtained at baseline and the other after treatment. Individual AIFs were aligned by bolus-arrival time of CA before averaging. DCE series and T10 maps of the tumor were fit to a PK model using the least-squares method. Three PK models were compared: Tofts (T), Modified-Tofts (M-T) and Shutter-Speed (SS) model 8-10. Pixel-wise parametric maps of Ktrans (the rate constant of transferring unit volume of contrast agent from capillaries to interstitial space, min-1), kep (the rate constant from interstitial space to capillaries, min-1), τi (the intracellular water life time, sec),Ve (extracellular & extravascular volume fraction =Ktrans/kep) and Vp (vascular volume fraction) were obtained as output. Receiver Operating Characteristic (ROC) curves of Ktrans were constructed in SPSS (IBM). Responses to PEGPH20 was confirmed by reduction hyaluronan level by IHC compared to VEH-treated mice 7.
RESULTS: While all mice were from the same strain and similar in age, individual AIFs exhibit a great difference in amplitude, leading to the highest SD at the peak point of group-AIF (Fig 1A), consistent with other report 11. Variation of AIF among subjects or between pre- versus post-treatment in same mouse can result from differing physiological condition at the time of study or occasionally imperfect bolus injection of contrast agent. Pixel-wise Ktrans (Fig 1B) and mean Ktrans of each tumor (Fig 1C) exhibit moderately good correlation between individual versus group-AIF with Pearson coefficient r =0.69 and 0.86, respectively.
Employing individual-AIF, both SS- and T-model detected a significant increase of kep after PP treatment (Fig 2A), whereas only SS (but not T or M-T) model detected a significant increase in %change of Ktrans between PP versus VEH group (Fig 2B). Using group-AIF, only SS model was able to detect a significant increase of kep and Ktrans from baseline to post-PP (Fig 2C-2D) as well as an increase in %change of Ktrans between PP versus VEH group (Fig 2E).
Data in Fig 2 suggest that Ktrans and kep are suitable metric for detecting the effect of PEGPH20; meanwhile, the SS-model seems more sensitive than T or M-T model when individual or group-AIF approach is employed. We computed the ROC curves of Ktrans and kep (Fig 3A-3B). AUC (area-under-curve) of ROC for Ktrans (%change) is greater than that of ROC for kep (%change), suggesting that Ktrans have higher predictive value for stroma-directed drug.
Notably, using the group-AIF, the M-T model revealed a moderate but significant increase of Vp after PP treatment (Fig 4A). Analysis of CD31 (endothelial marker) stained sections suggest that “vascular lumen area” metric exhibits an average of 48% increase after PP versus VEH treatment, although significance is not reached due to small sample size. Micrographs from one PP and one VEH treated mouse are shown in Fig 4B-4C.
DISCUSSION: The group-AIF combined with SS-model (not with T or M-T model) can detect response to PP, while individual AIF can work with T or SS-model to detect such response. Our data suggest Ktrans an optimal marker in sensitivity /specificity compared to kep.
CONCLUSION: This study provides rationale for choice of PK model and AIF approach which lead to quantitative DCE-MRI marker of optimal sensitivity and specificity for detecting PDA response to PEGPH20 treatment. Because imaging markers such as Ktrans map can evaluate responses of the entire tumor, they may avoid the sampling error and morbidity associated with ultrasound-guided endoscopic biopsy employed in clinic trials of stromal drugs.
Acknowledgements
This study was partially supported by U24CA231858 (Penn Quantitative Imaging Resource for Pancreatic Cancer), R21CA198563 and R01CA211337.References
1. Mace TA, Shakya R, Pitarresi JR, et al. IL-6 and PD-L1 antibody blockade combination therapy reduces tumour progression in murine models of pancreatic cancer. Gut 2018;67(2):320-332.
2. Hingorani SR, Zheng L, Bullock AJ, et al. HALO 202: Randomized Phase II Study of PEGPH20 Plus Nab-Paclitaxel/Gemcitabine Versus Nab-Paclitaxel/Gemcitabine in Patients With Untreated, Metastatic Pancreatic Ductal Adenocarcinoma. J Clin Oncol 2018;36(4):359-366.
3. Lo A, Wang LC, Scholler J, et al. Tumor-Promoting Desmoplasia Is Disrupted by Depleting FAP-Expressing Stromal Cells. Cancer Res 2015;75(14):2800-2810.
4. Beatty GL, Chiorean EG, Fishman MP, et al. CD40 agonists alter tumor stroma and show efficacy against pancreatic carcinoma in mice and humans. Science 2011;331(6024):1612-1616.
5. Chauhan VP, Martin JD, Liu H, et al. Angiotensin inhibition enhances drug delivery and potentiates chemotherapy by decompressing tumour blood vessels. Nature communications 2013;4:2516. 6. Hingorani SR, Petricoin EF, Maitra A, et al. Preinvasive and invasive ductal pancreatic cancer and its early detection in the mouse. Cancer Cell 2003;4(6):437-450.
7. Cao J, Pickup S, Clendenin C, et al. Dynamic Contrast-enhanced MRI Detects Responses to Stroma-directed Therapy in Mouse Models of Pancreatic Ductal Adenocarcinoma. Clinical cancer research : an official journal of the American Association for Cancer Research 2019;25(7):2314-2322.
8. Tofts PS. Modeling tracer kinetics in dynamic Gd-DTPA MR imaging. J Magn Reson Imaging 1997;7. 9. Zhou R, Pickup S, Yankeelov TE, Springer CS, Jr., Glickson JD. Simultaneous measurement of arterial input function and tumor pharmacokinetics in mice by dynamic contrast enhanced imaging: effects of transcytolemmal water exchange. Magn Reson Med 2004;52(2):248-257.
10. Li X, Rooney WD, Springer CS, Jr. A unified magnetic resonance imaging pharmacokinetic theory: intravascular and extracellular contrast reagents. Magn Reson Med 2005;54(6):1351-1359.
11. Loveless ME, Halliday J, Liess C, et al. A quantitative comparison of the influence of individual versus population-derived vascular input functions on dynamic contrast enhanced-MRI in small animals. Magnetic Resonance in Medicine 2012;67(1):226-236.
Figures

Figure 1 Group AIF and correlation of Ktrans derived from group and individual AIF.
A: The group AIF (mean ±SD) obtained from 20 individual AIF obtained from mice used in this study. Correlation of Ktrans values were from SS-model fitting using individual- and group-AIF was plotted pixel-wise (B) or using the mean of each subject (C).

Figure 2 DCE metric obtained from three PK models combined with individual or group-AIF approach for detecting the treatment effect of stroma-directed drug.
A-B: Using Individual AIF, both SS and T (not M-T) model can detect the treatment effect of PEGPH20 as an increase of kep. However, only the SS model led to significant % change of Ktrans between PP vs. VEH group.
C-E: Using group AIF, only the SS (but not T or M-T) model detected the kep and Ktrans increase after PEGPH20 treatment as well as %change of Ktrans between PP vs. VEH group.
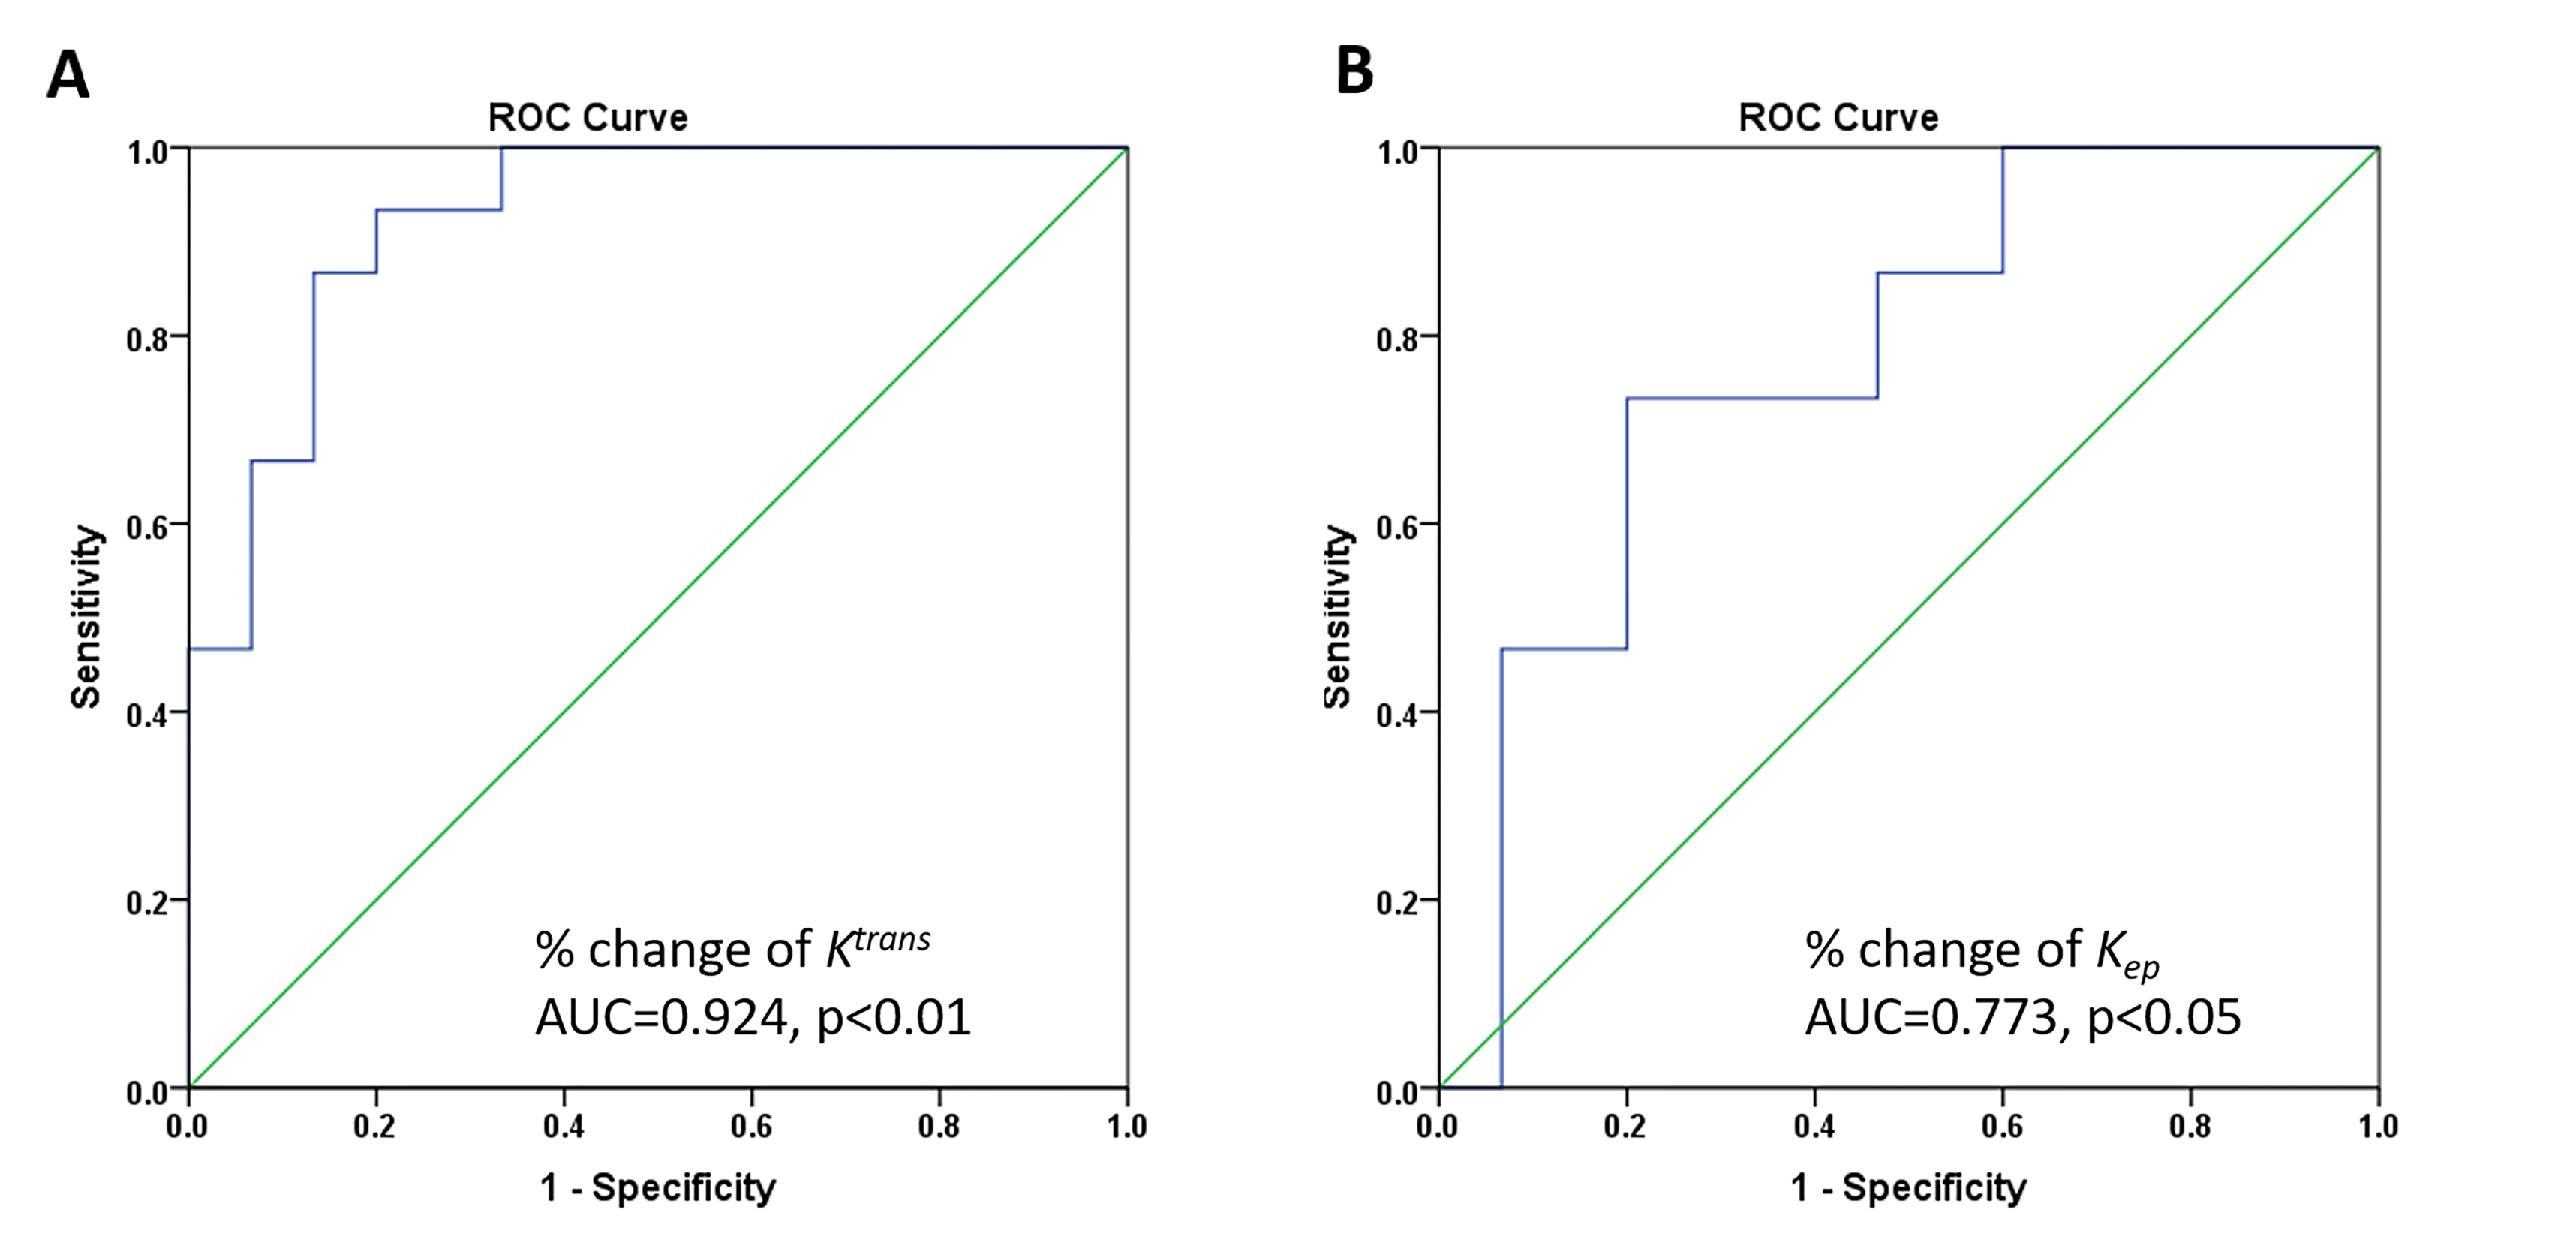
Figure 3 The ROC of Ktrans and kep
The ROC curves for %change of Ktrans (A) and kep (B) with AUC (area under curve) indicated.
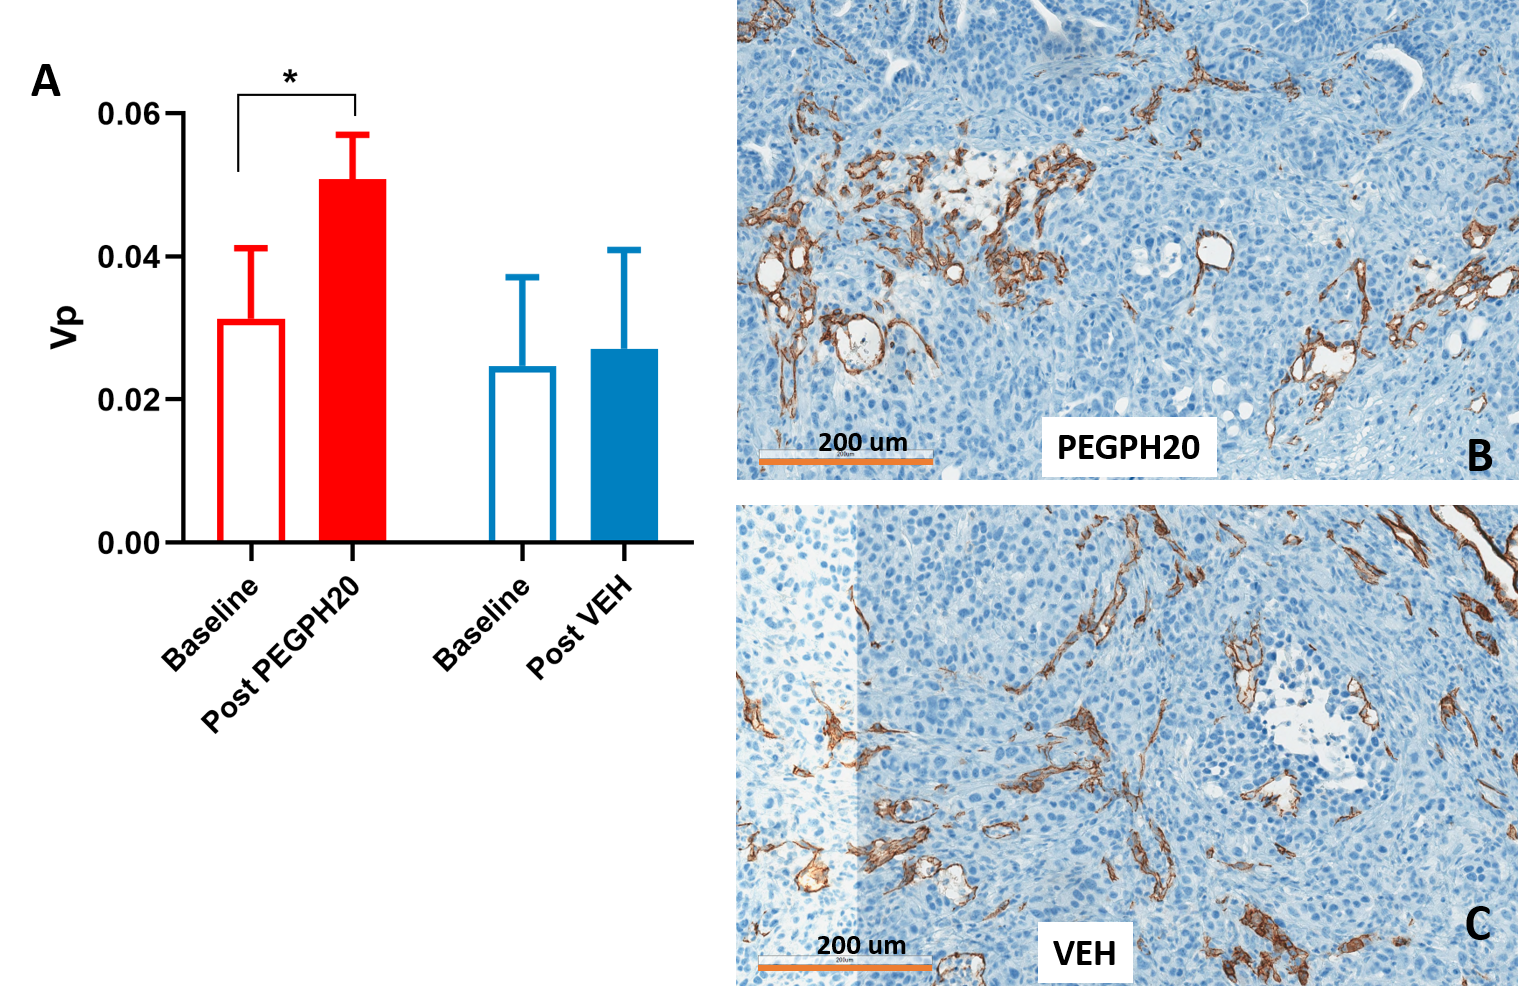
Figure 4 DCE-MRI detects changes in vascular lumen area after stroma-directed drug treatment.
Vp (fractional plasma volume) derived from fitting of M-T model shows a significant increase after PEGPH20 treated (A). Representative CD31-stained micrographs from PEGPH20 treated and VEH treated mouse (B-C).