0140
Investigation of breast cancer microstructure and microvasculature from time-dependent DWI and CEST in correlation with histology1Diagnostic Imaging and Nuclear Medicine, Kyoto University Graduate School of Medicine, Kyoto, Japan, 2Clinical Innovative Medicine, Institute for Advancement of Clinical and Translational Science, Kyoto University Hospital, Kyoto, Japan, 3Kyoto University Graduate School of Informatics, Kyoto, Japan, 4Diagnostic Pathology, Kyoto University Graduate School of Medicine, Kyoto, Japan
Synopsis
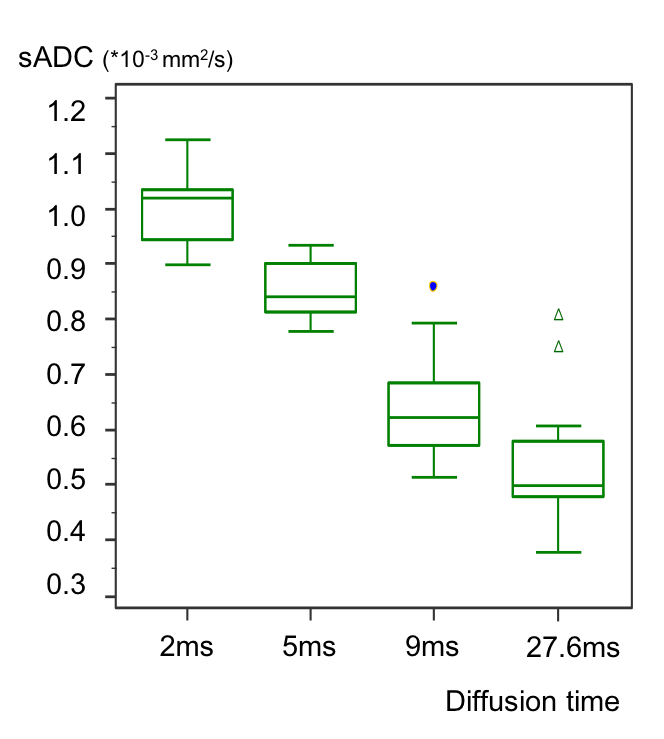
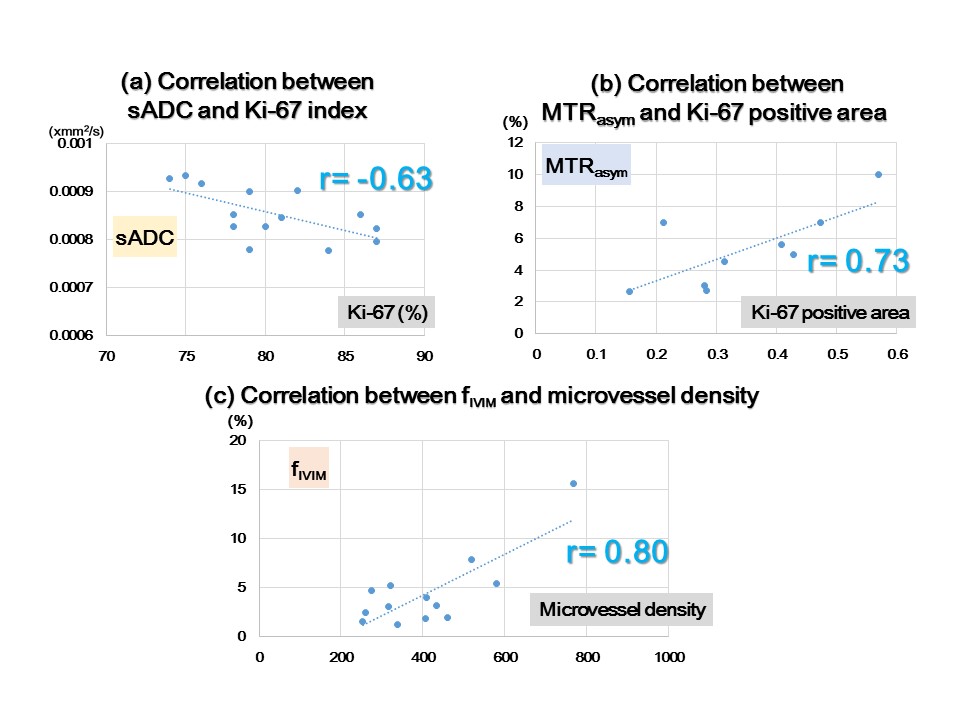
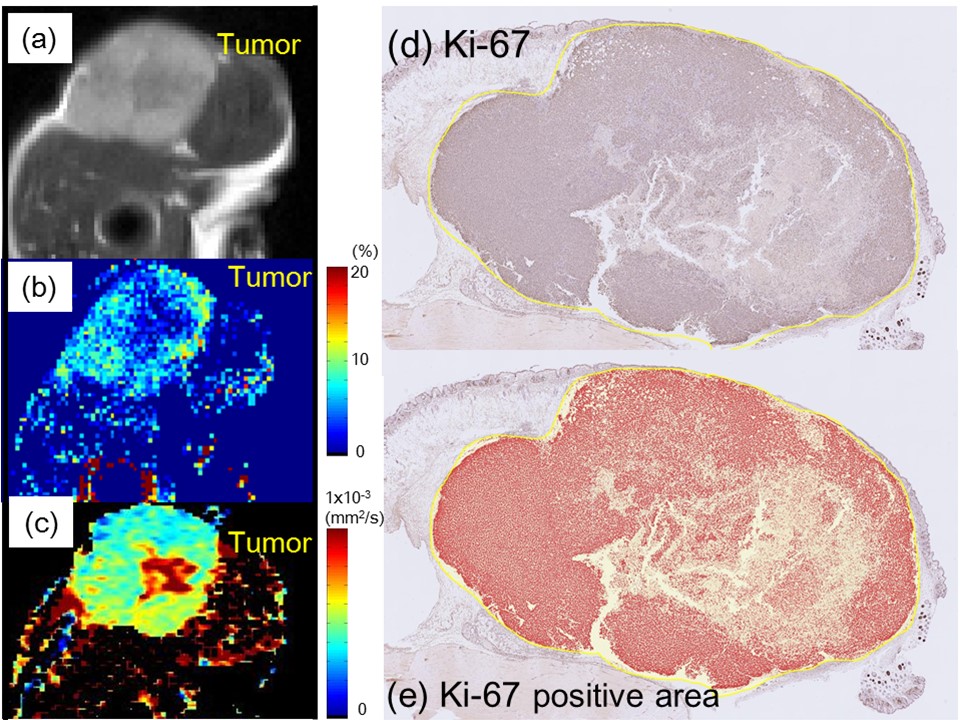
The association of time-dependent DWI (shifted ADC [sADC], IVIM, and non-Gaussian DWI) at different diffusion times and CEST (MTRasym, APT signal intensity) parameters was investigated with histological biomarkers in a breast cancer xenograft model. ADC values decreased with increased diffusion times. sADC values at a diffusion time=5ms had significant negative correlation with Ki-67 (r=−0.63, P<0.05). MTRasym had a significant positive correlation with Ki-67 positive area (r=0.73, P<0.05). Significant association was found between fIVIM and microvessel density (r=0.80, P<0.01). These results indicate their utility for investigating microstructure and microcirculation of breast cancers without using contrast agents.
Introduction
DWI has been widely used for breast tumor characterization as well as monitoring without the need for the contrast agents, and several non-Gaussian DWI or IVIM parameters can be explored which are useful for the differentiation of malignant and benign breast lesions or prognostic factors (1). Their diffusion time dependency has also been extensively explored in various cancers (2-4). CEST might provide complementary molecular information related to cancer metabolism and its utility has been explored in oncology, including breast cancers (5,6). The magnetization transfer ratio asymmetry (MTRasym) values calculated for the frequency of the maximum of MTRasym curve have been reported to have significant correlation with Ki-67, pathological index (5). These parameters might be tools to investigate breast cancer microstructure and without using contrast agents. Our purpose was to investigate the association of time-dependent DWI or CEST parameters obtained from 7T MRI of a murine breast xenograft model with histological biomarkers.Methods
Study population & MRIA total of 16 ICR nu/nu mice inoculated subcutaneously with 1 × 10⁶ MDA-MB-231 human breast cancer cells in the hindlimb were investigated. MRI was conducted on a 7T MRI scanner (Bruker Biospin, Ettlingen, Germany) using a 1H quadrature transmit/receive volume coil.
DWI
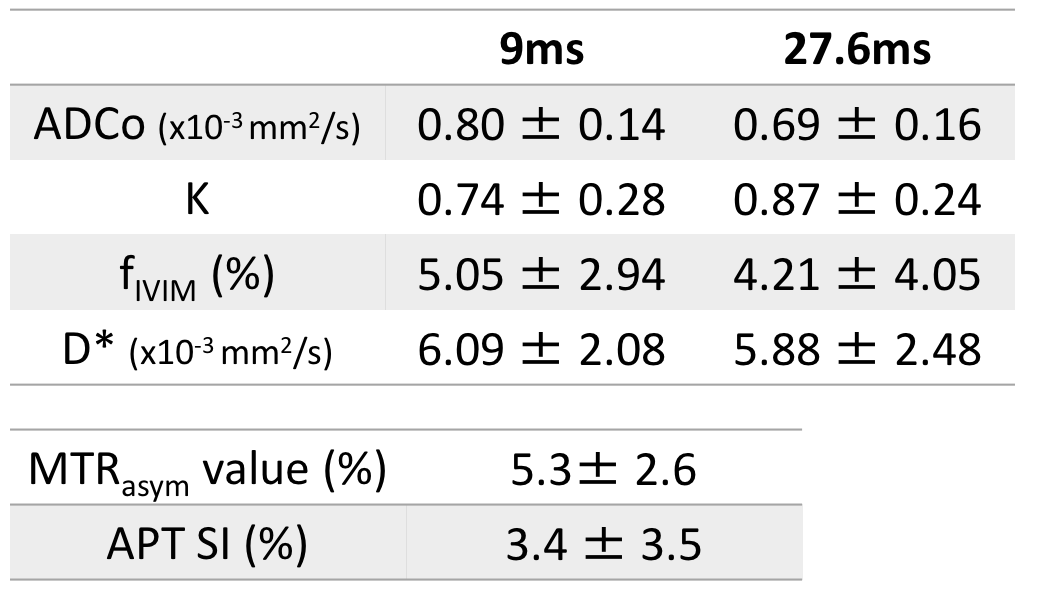
The SE-EPI acquisition parameters were: Resolution 250×250μm², matrix size 100×100, field of view 25×25mm², slice thickness 1.5mm, TE=57ms, TR=2500ms, 8 averages, 4 segments. DW images were acquired using four different diffusion times (2, 5, 9, and 27.6ms) and 11 b values (0–600s/mm2) for 2 and 5 ms, and 17 b values (0–3000s/mm²) for 9 and 27.6ms. The total acquisition time was 14.4 min for 2 and 5 ms, and 22.4 min for 9 and 27.6 ms. Shifted ADC (sADC) values were calculated using b values of 200 and 1500 s/mm2. ADC0 (virtual ADC as b approaches 0) and K values were generated using Kurtosis model (7).
CEST
CEST images were acquired using a RARE sequence with a single continuous wave saturation pre-pulse. The acquisition parameters were: TR=5s, effective TE=12ms, RARE factor=16, a centric ordered phase encoding, slice thickness=2mm, matrix size=96×96 and field of view 25×25mm². The saturation parameters were: saturation time=1s and saturation RF power=5.9μT. Data were acquired at 41 saturation offset frequencies with respect to water resonance with the range of ±5ppm and 0.25ppm steps. The acquisition time for each saturation offset was 30s and the total acquisition time was 20.5 min. Reference images were also acquired at a saturation frequency of 40ppm. The MTRasym values were calculated for the frequency of the maximum of MTRasym curve and amide proton transfer (APT) signal intensity was defined as MTRasym at 3.5ppm. The water frequency offset caused by B0 inhomogeneity was corrected by using water saturation shift referencing (WASSR) method (8).
Histology & Statistics
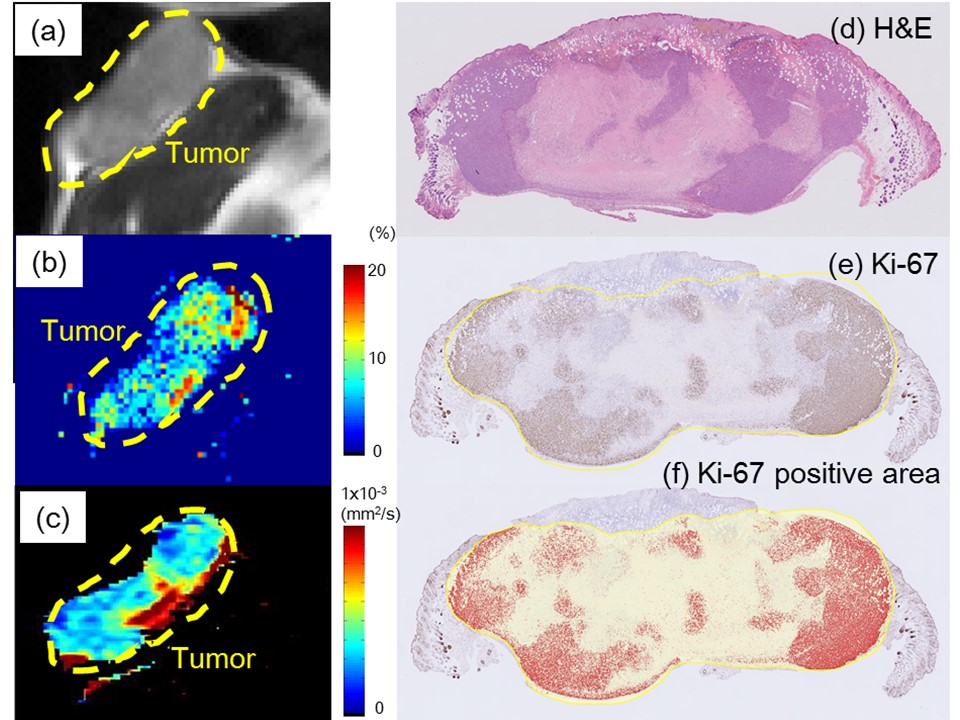
The Ki-67 proliferation index and CD-31 microvessel density (MVD) were measured. The Ki-67 positive area was generated as the percentage of Ki-67 positivity over the whole tumor area using automated histology image analysis software, Halo (Indica labs, Corrales NM, USA). MRI data analysis was performed using a code developed in Matlab (Mathworks, Natick MA, USA). Diffusion parameters at different diffusion times were compared using the Wilcoxon test, and the correlation of DWI or CEST parameters with histological biomarkers was investigated.
Results
Discussion
The observed decrease in ADC values with diffusion time in breast tumors was in agreement with the literature, as was our previous investigation (2-6). This confirms the hypothesis that diffusion hindrance increases with an increase in diffusion time in tumors, as more molecules might hit many obstacles such as cell membranes that are water-permeable, to which ADC is highly sensitive (9). The association of ADC with Ki-67 expression in breast cancer is still controversial with conflicting results (10,11), and further investigation is warranted. The positive correlation of MTRasym with Ki-67 positive area was in line with the literature (5). They might reflect differences in the proliferative activity of some tumors and help to assess prognostic biomarkers for breast cancer. The significant correlation between and MVD (CD-31) was observed in this study, which was in agreement with previous publications (12), suggesting a great potential in evaluating tumor tissue and perfusion without the need for contrast agents.Conclusion
Acknowledgements
This research was supported by MEXT KAKENHI Grant No. 18K15588 and AMED Grant Number JP18ck0106454.References
1) Iima M et al. Diffusion MRI of the breast: Current status and future directions. J Magn Reson Imaging. 2019 Sep 14. doi: 10.1002/jmri.26908
2) Reynaud O et al. Time-Dependent Diffusion MRI in Cancer: Tissue Modeling and Applications. Frontiers in Physics 2017; 58(5)
3) Lemberskiy G et al. Time-Dependent Diffusion in Prostate Cancer. Invest Radiol. 2017 Jul;52(7):405-411
4) Iima M et al. Time-dependent diffusion MRI to distinguish malignant from benign head and neck tumors J Magn Reson Imaging. 2019 Jul;50(1):88-95
5) Zaric O et al. 7T CEST MRI: A potential imaging tool for the assessment of tumor grade and cell proliferation in breast cancer. Magn Reson Imaging. 2019 Jun;59:77-87.
6) Schmitt B et al. A new contrast in MR mammography by means of chemical exchange saturation transfer (CEST) imaging at 3 tesla: preliminary results. Rofo 2011; 183(11):1030-1036.
7) Iima M et al. Intravoxel Incoherent Motion and Quantitative Non-Gaussian Diffusion MR Imaging: Evaluation of the Diagnostic and Prognostic Value of Several Markers of Malignant and Benign Breast Lesions. Radiology. 2018 May;287(2):432-441.
8) Kim M et al. Water saturation shift referencing (WASSR) for chemical exchange saturation transfer (CEST) experiments. Magn Reson Med 2009; 61(6): 1441-1450.
9) Springer CS Jr. Using 1H2O MR to measure and map sodium pump activity in vivo. J Magn Reson. 2018 Jun;291:110-126.
10) Surov A et al. Can diffusion‐weighted imaging predict tumor grade and expression of Ki‐67 in breast cancer? A multicenter analysis. Breast Cancer Res 2018;20:58.
11) Surov, A et al. Apparent diffusion coefficient cannot predict molecular subtype and lymph node metastases in invasive breast cancer: a multicenter analysis. BMC Cancer 2019; 19:1043.
12) Federau C. Intravoxel incoherent motion MRI as a means to measure in vivo perfusion: A review of the evidence. NMR Biomed. 2017 Nov;30(11).
Figures