0137
Characterizing the ADC-microstructure relationship in meningiomas through computational modelling.1CartCasLab at Department of Electronics, Information and Bioengineering, Politecnico di Milano, Milan, Italy, 2National Center Of Oncological Hadrontherapy (CNAO), Pavia, Italy, 3Centre for Medical Image Computing and Dept of Computer Science, University College London, London, United Kingdom
Synopsis
Tumour microstructure can be probed with diffusion-weighted MRI (DW-MRI), but the clinically-adopted apparent diffusion coefficient (ADC) lacks a clear link to microstructure. Aim of this work was to detail the ADC-microstructure relationship using a computational framework. Relying on a sparse representation of simulated DW-MRI data, we estimated diffusivity (D), cell radius (R) and volume fraction (vf) for 27 low and high-grade meningioma patients, which significantly differed in ADC, D and vf. Preliminary results showed the potential of the proposed framework for meningioma grading and proton-therapy response assessment, although extension to richer data and histological validation need to be further addressed.
Introduction
In neuro-oncology microstructural imaging techniques, like diffusion-weighted MRI (DW-MRI), have been widely investigated1. Apparent diffusion coefficient (ADC) is one of the most used DW-MRI parameters due to its acquisition speed and ease of computation. It is directly used as an imaging biomarker2 or correlated to tumour microstructural features, like cellularity3. Studies4 reported the ADC effectiveness in grading meningiomas, which can be divided into low- (meningothelial and others) and high-grade (atypical or anaplastic), with different histological features5,6.However, no clear relationship links the non-specific but sensitive ADC to the underlying microarchitecture, making its microstructural interpretation challenging and prone to ambiguity. While advanced DW-MRI techniques, as CODIVIDE7 or VERDICT8, improved specificity of MRI measurements to tumour microstructure, ADC is still the most clinically used DW-MRI metric.
The aim of this work is to develop a computational framework that exploits numerical simulations of tissue microstructure to infer the relationship between ADC and the underlying tumour microstructure, thus aiding the ADC contrast interpretation.
We demonstrate the framework’s potential by separating different sources of contrast (i.e. cell density, size and bulk diffusivity) in the measured ADC for meningioma grading. Moreover, we show how it can help describe tissue rearrangement following proton-therapy. The long-term aim is to enable the robust usage of ADC to non-invasively investigate the impact of radiation therapies on tumour microstructure and drive treatment personalization and tumour response evaluation9.
Methods
DW-MRI acquisition. 27 meningioma patients, enrolled for proton-therapy at CNAO (Pavia) and with biopsy-verified tumour grades (15 meningothelial, 12 atypical), were retrospectively selected. DW-MRI (2DTRSE; TE/TR=76/6000ms; α=90°; b-values=0,200,400,1000s/mm2; resolution=0.975x0.975x4mm; GRAPPA factor=2) images were acquired on a 3T scanner (Magnetom Verio, Siemens) before treatment. ADC was computed after averaging along three orthogonal directions and applying 2D within-volume rigid motion correction. Tumour contours were rigidly registered from anatomical images and manually adjusted.Numerical simulation. DW-MRI signals (N=3928) were simulated with CAMINO10 from ellipsoidal packings11 with well-defined microstructural features (range: eccentricity:0-0.9, radius (R):2.5-10.0µm, volume fraction (vf):0.3-0.6, diffusivity (D):0.5-3.0µm2/ms). DW-MRI parameters for the simulated sequence matched those from patients’ acquisitions.
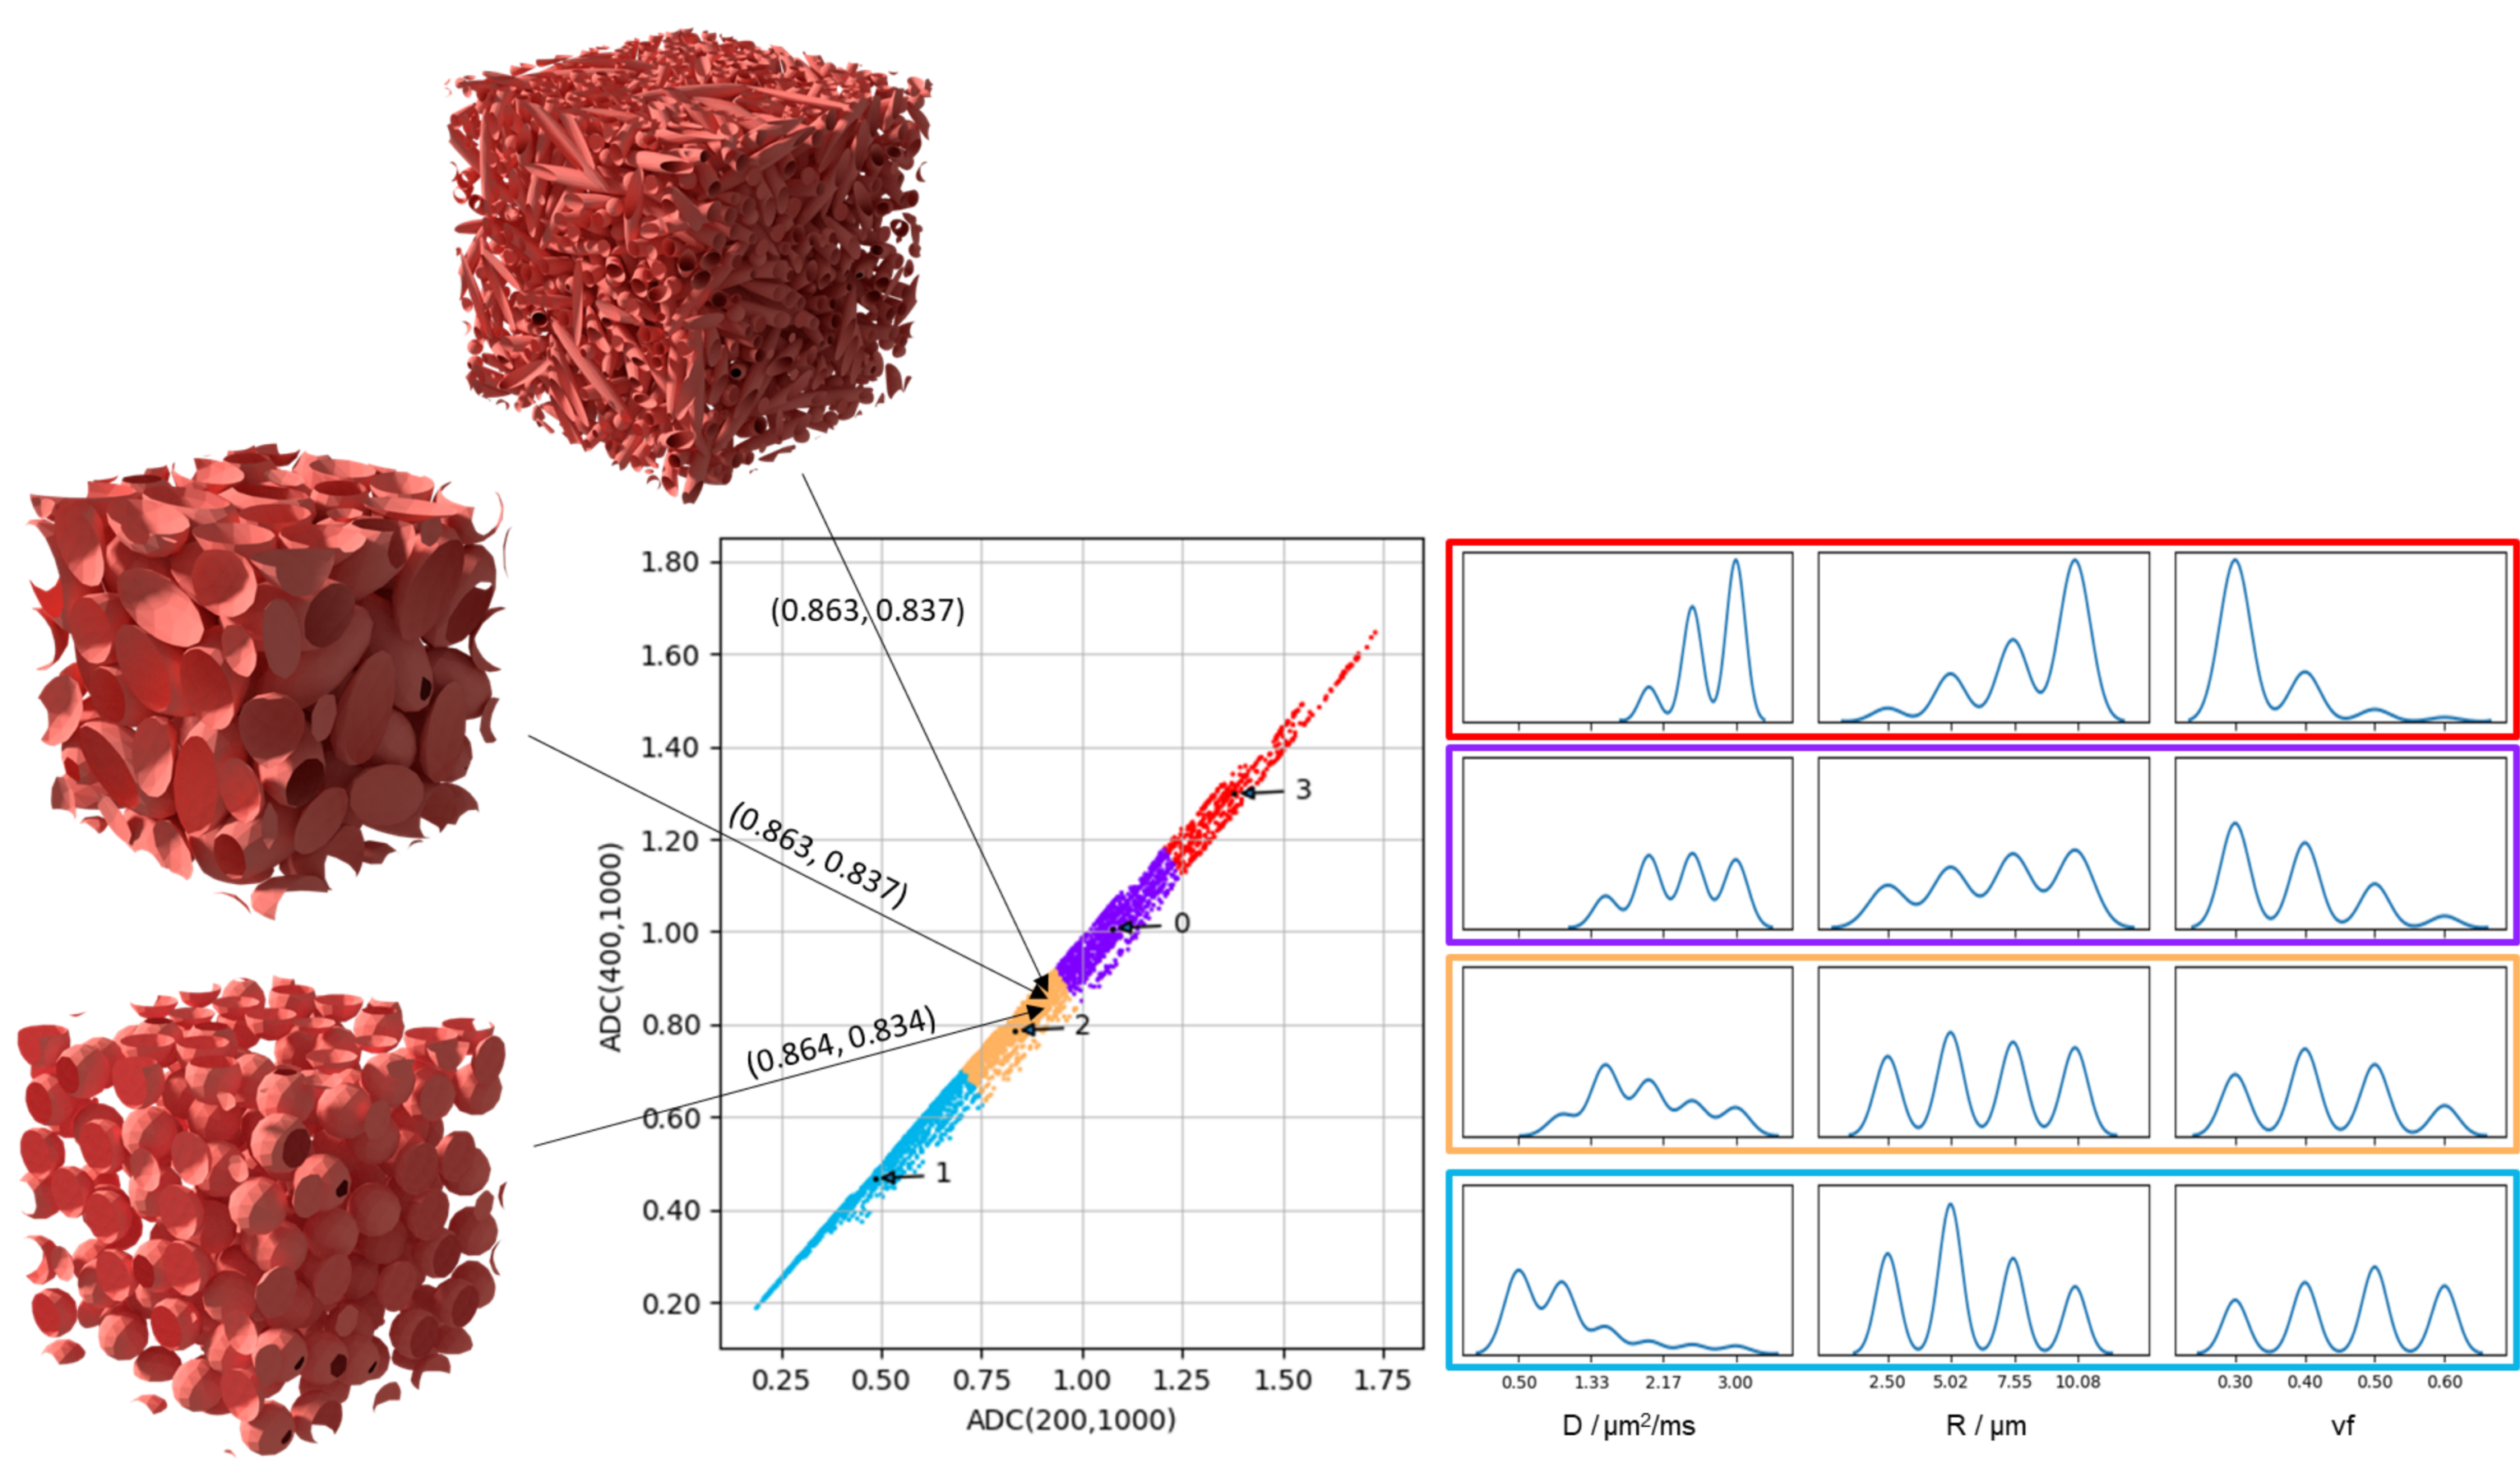
Sparse approximation. To retain a sparse and tractable representation of simulated microstructures providing similar ADCs, simulations were partitioned applying k-means to three ADCs (computed using b=200,1000, b=400,1000 and b=200,400,1000 s/mm2); k was chosen to maximize the pairwise separation (Mann-Whitney U-test) of microstructural feature distributions, characterizing the combinations of microstructural parameters that lead to similar ADC values, across clusters.
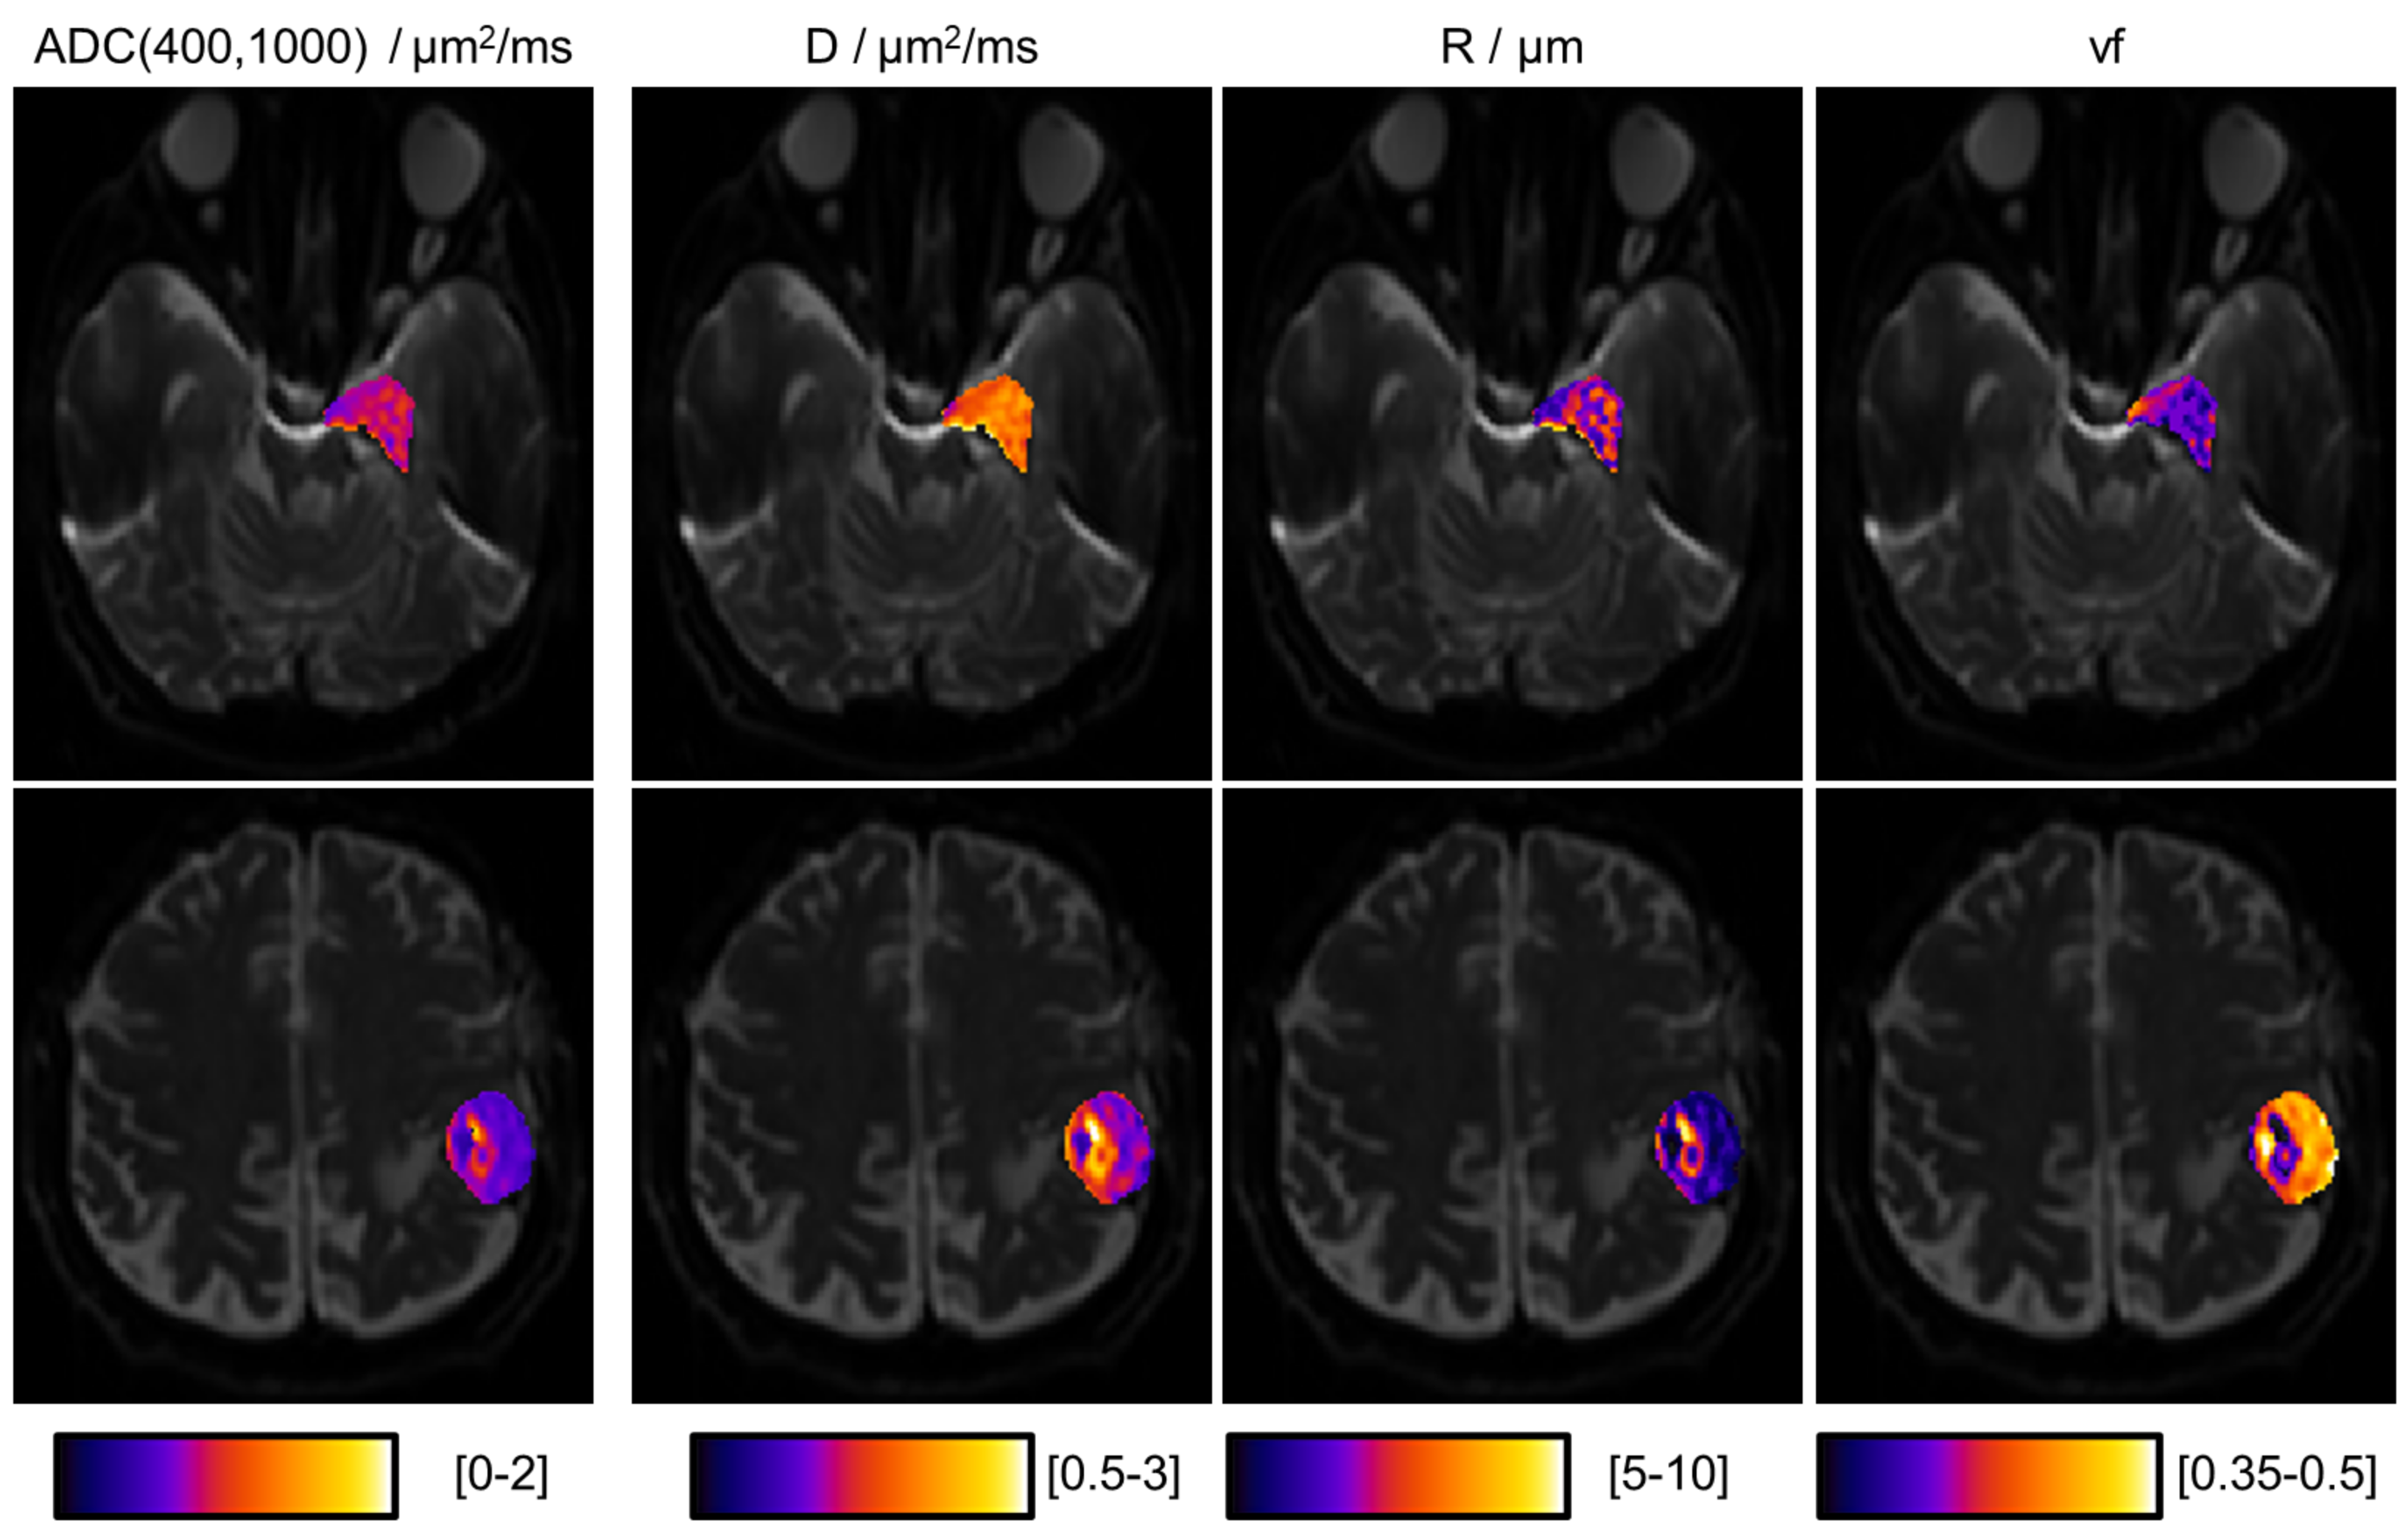
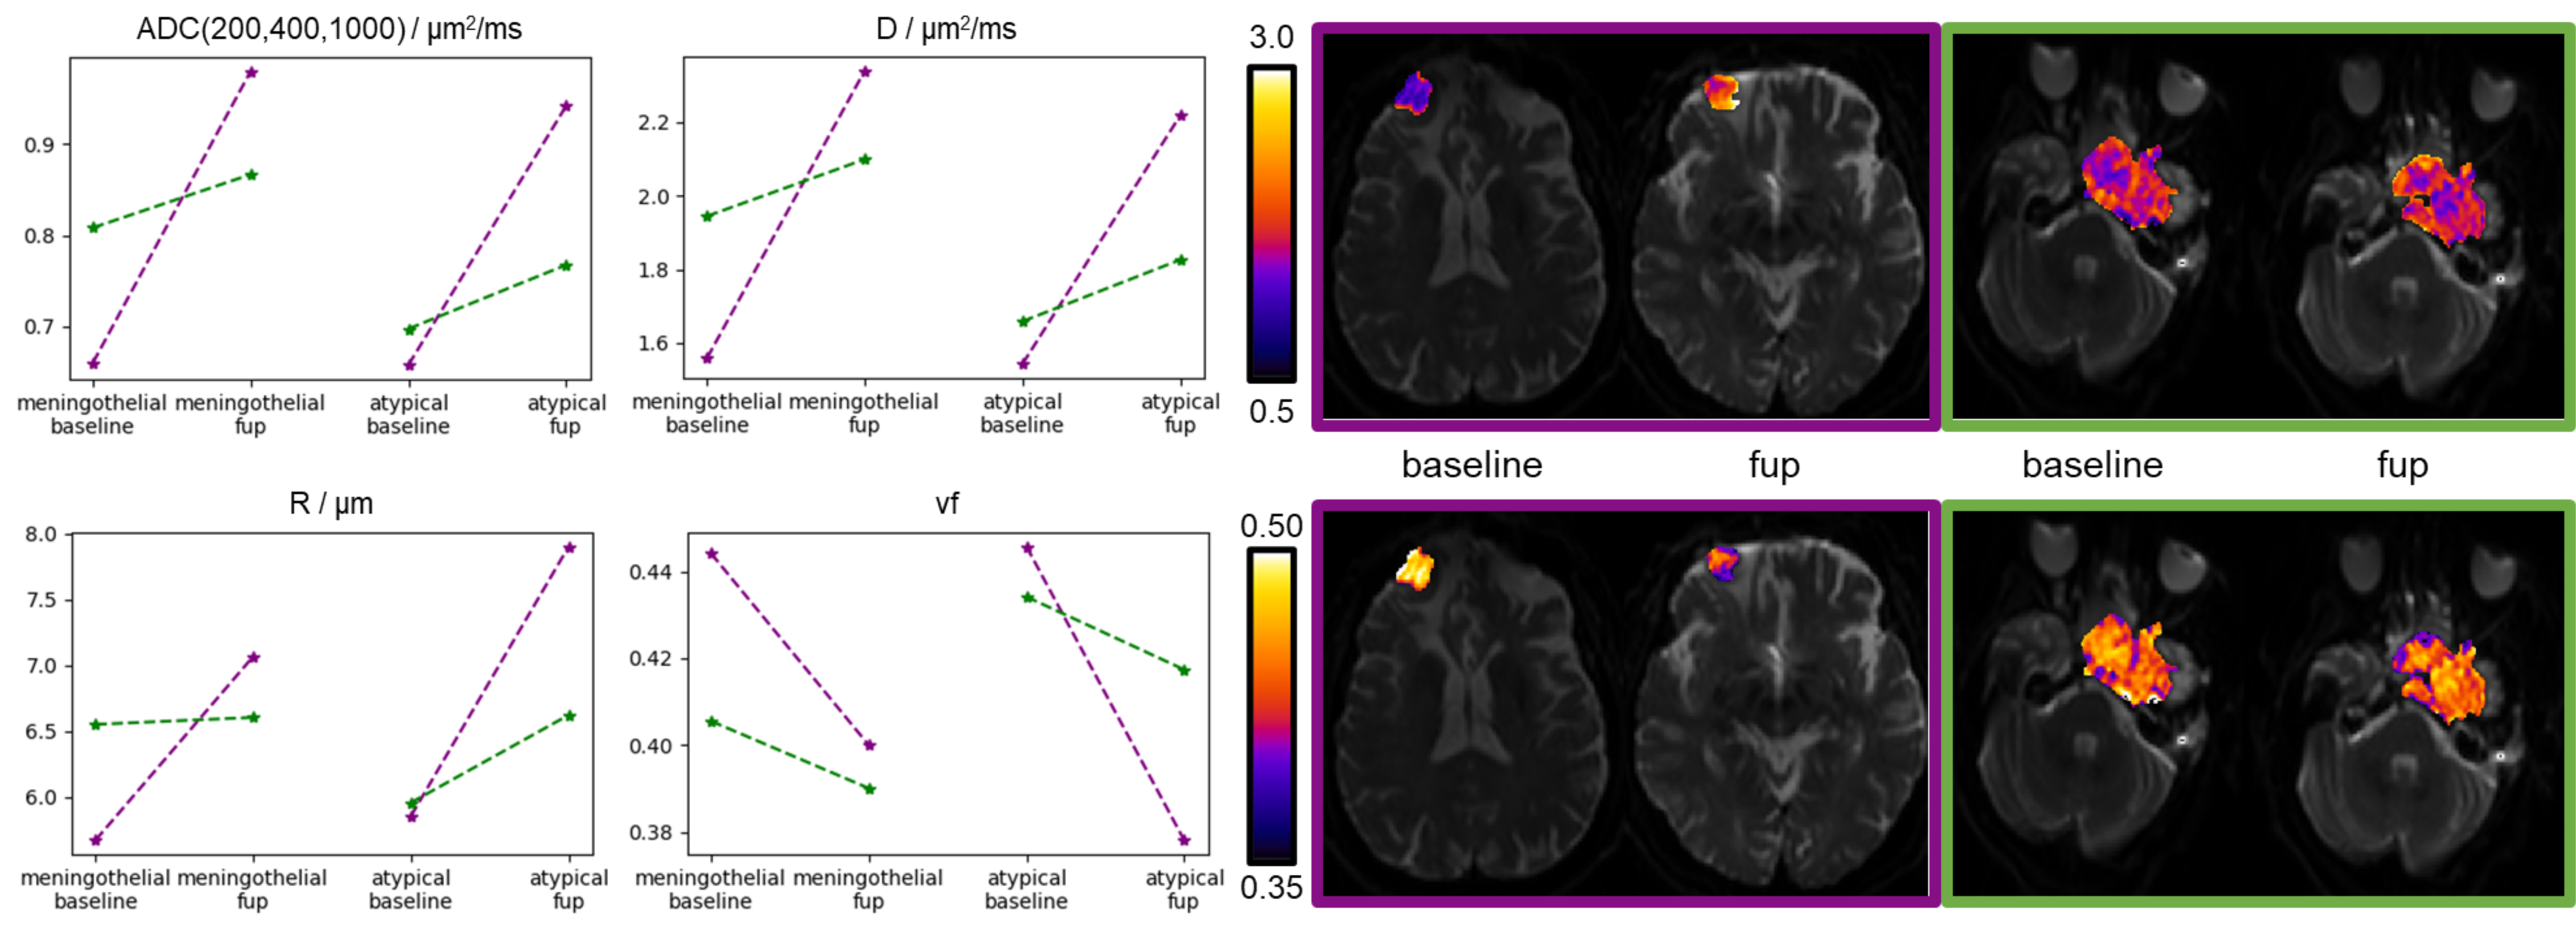
From ADC to microstructure. A LASSO-regularized optimization yielded the best sparse weights to combine the k clusters of simulated signals into the observed ADC. To provide a summary metric, these weights weighted the sum of the median values of the microstructural features of each cluster. Therefore, starting from ADC, a weighted median value of D, vf and R, respectively, was computed for each patient (Fig.1). Differences in microstructural features observed before treatment between meningothelial and atypical meningiomas were assessed through a Mann-Whitney U-test (α=0.05). This procedure was also applied voxel-wise and to 3-months follow-up imaging of four patients, as a preliminary longitudinal analysis of DW-related changes against treatment-induced volumetric changes.
Results
The optimal k was 4 (Fig.2), for which ADC and microstructural feature (D,R,vf) values for meningothelial and atypical meningiomas are shown (Fig.3). The two groups significantly differed for ADC, D and vf, but not for R. The voxel-wise analysis provided the decomposition of spatial ADC heterogeneity into microstructural features heterogeneity (Fig.4). The preliminary longitudinal analysis suggested that changes in ADC can be interpreted as diverse combined changes in D, R and vf with time (Fig.5).Discussion and Conclusion
In this work, microstructural features that agreed with biopsy-verified meningioma grades were inferred from ADC data, by using computational models to characterize the ADC-microstructure relationship in terms of pre-defined relevant tissue features (D,R,vf).Meningothelial and atypical meningiomas were distinguished by ADC (Fig.3). The relative contribution of estimated R, vf and D to the measured ADC was quantified and vf and D were those contributing the most (Fig.3). This suggests that the ability of ADC to grade meningiomas in our experiments is mostly due to diffusivity and cell density, rather than cell size. In proton-therapy, estimating microstructural features maps (Fig.4) could drive dose boosting during treatment planning, whereas the non-invasive analysis of tissue microstructure could allow for dividing stable and progressive tumours (Fig.5) early after treatment.
Key limitations, that future work will address, of this study are: (i) only few pre-defined microstructural features (D,R,vf) were investigated, disregarding others (e.g. permeability, vasculature); (ii) no histological data12 was available for validation; (iii) much richer MRI data could be acquired to better discriminate the ADC-microstructure relationship; (iv) larger and heterogeneous cohorts should be investigated to increase robustness.
Nevertheless, our novel framework may already enable retrospective microstructure interpretation from previously acquired ADC data and support clinical practice under limited resources (e.g. time) by extracting complex information from ADC. This approach supports the use of microstructural imaging in neuro-oncology and helps to detail the ADC-microstructure relationship when invasive examinations are to be avoided, such as in proton-therapy. Its potentially large clinical impact is given by its flexibility: from tumour grading (Fig.3), to dose planning (Fig.4) and tumour response assessment (Fig.5).
Acknowledgements
This project has received funding from Engineering and Physical Sciences Research Council (EPSRC EP/N018702/1) and was supported by the NIHR UCLH Biomedical Research Centre.References
1. Nilsson, M., Englund, E., Szczepankiewicz, F., van Westen, D. & Sundgren, P. C. Imaging brain tumour microstructure. Neuroimage 182, 232–250 (2018).
2. Gihr, G. A. et al. Diffusion Profiling via a Histogram Approach Distinguishes Low-grade from High-grade Meningiomas, Can Reflect the Respective Proliferative Potential and Progesterone Receptor Status. Mol. Imaging Biol. 20, 632–640 (2018).
3. Chen, L. et al. The correlation between apparent diffusion coefficient and tumor cellularity in patients: A meta-analysis. PLoS One 8, (2013).
4. Aslan, K., Gunbey, H. P., Tomak, L. & Incesu, L. The diagnostic value of using combined MR diffusion tensor imaging parameters to differentiate between low- and high-grade meningioma. Br. J. Radiol. 20180088 (2018). doi:10.1259/bjr.20180088
5. Zhang, T., Yu, J., Wang, Y., Yin, D. & Fang, L. WHO grade I meningioma subtypes: MRI features and pathological analysis. Life Sci. 213, 50–56 (2018).
6. Rogers, L., Gilbert, M. & Vogelbaum, M. A. Intracranial meningiomas of atypical (WHO grade II) histology. J. Neurooncol. 99, 393–405 (2010).
7. Lampinen, B. et al. Neurite density imaging versus imaging of microscopic anisotropy in diffusion MRI: A model comparison using spherical tensor encoding. Neuroimage 147, 517–531 (2017).
8. Panagiotaki, E. et al. Noninvasive Quantification of Solid Tumor Microstructure Using VERDICT MRI. Cancer Res. 74, 1902–1912 (2014).
9. Durante, M., Orecchia, R. & Loeffler, J. S. Charged-particle therapy in cancer: clinical uses and future perspectives. Nat. Rev. Clin. Oncol. 14, 483–495 (2017).
10. Hall, M. G. & Alexander, D. C. Convergence and Parameter Choice for Monte-Carlo Simulations of Diffusion MRI. IEEE Trans. Med. Imaging 28, 1354–1364 (2009).
11. Donev, A., Torquato, S. & Stillinger, F. Neighbor list collision-driven molecular dynamics simulation for nonspherical hard particles.II. Applications to ellipses and ellipsoids. J. Comput. Phys. 202, 765–793 (2005).
12. Pećina-Šlaus, N., Kafka, A. & Lechpammer, M. Molecular Genetics of Intracranial Meningiomas with Emphasis on Canonical Wnt Signalling. Cancers (Basel). 8, 67 (2016).
Figures