0135
Perfusion Measurement in Brain Gliomas Using Velocity-Selective Arterial Spin Labeling: Comparison with PCASL and DSC Perfusion1Imaging diagnostic department, Zhujiang hospital of southern medical university, Guangzhou, China, 2The Russell H. Morgan Department of Radiology and Radiological Science, Johns Hopkins University School of Medicine, Baltimore, MD, United States, 3F.M. Kirby Research Center for Functional Brain Imaging, Kennedy Krieger Institute, Baltimore, MD, United States
Synopsis
Velocity-selective arterial spin labeling (VSASL) employing Fourier-transform based velocity-selective pulse trains is an emerging method for quantifying cerebral blood flow (CBF) with high sensitivity to perfusion signal. Its utility was assessed for glioma patients at 3T by a comparison between pseudo-continuous ASL with DSC-PWI. We demonstrated the existence of various and prolonged arterial transit time (ATT) in high-grade gliomas. Detecting by the dependence of the CBF based on Tmax, lesser sensitivity to ATT in VSASL was reported. VSASL showed great promise for accurate quantification of CBF and could potentially improve the diagnostic performance of ASL in preoperative grading of gliomas.
Introduction
Pseudo-continuous arterial spin labeling (PCASL)1 has been shown to be an effective alternative to dynamic susceptibility contrast-enhanced perfusion weighted imaging (DSC-MRI) for evaluating vascularity in brain tumors2. Spatially selective ASL is known to be sensitive to prolonged arterial transit time (ATT)3,4. Velocity-selective (VS) ASL has minimal time-delay sensitivity5,6. VSASL employing Fourier-transform based velocity-selective pulse trains is an emerging perfusion imaging method7 with high sensitivity to perfusion signal. The purpose of this work is to evaluate the performance of VSASL on preoperative patients with gliomas by comparing with PCASL and DSC-PWI.Methods
Patients with newly diagnosed brain tumors were recruited to undergo preoperative MRI between Nov. 2017 and Feb. 2019 using a 3T Philips Ingenia scanner. In additional to anatomic sequences, each MRI consists of DWI and 3 perfusion sequences including VSASL, PCASL and DSC-PWI. 47 cases of glioma (Grade IV, N=17, 54.47±12.72yo; Grade III, N=6, 50.50±9.33yo; Grade II, N=24, 39.54±11.99yo) with a histopathological diagnosis of primary gliomas based on the 2016 WHO brain tumor classification8 were included in this analysis. Meanwhile, 14 cases of high-grade gliomas (HGG, Grade III, N=3, 53.00±10.39yo, 2 anaplastic astrocytoma, 1 anaplastic oligodendroglioma; Grade IV, N=11, 50.27±10.79yo, 11 glioblastomas ) were investigated in the sub-study of evaluating the hemodynamics states in glioma. 19 ROIs (fixed at 3×3 pixels) were chosen in tumor zone (TZ) showing maximum signal enhancement on Gd-T1WI. The ROIs were corregistered to maps of DSC and ASL maps. Tmax on DSC-PWI has been considered as a normalized bolus arrival time9, and may contain microvascular information on brain tumors10. According to the Tmax values of 0-2s, 2-4s and > 4s, 266 ROIs in TZ were divided into three groups. The mean relative CBF (rCBF) measurement errors between ASL and DSC-PWI in the TZ were calculated to evaluate the sensitivity of ASL methods to ATT.Then, three representative 3×3 pixel ROIs were manually chosen from all cases of glioma regions showing the maximal perfusion signal on CBF maps. The ratio of tumor blood flow (TBF) and contralateral normal-appearing grey matter blood flow were compared. Mann-Whitney U test was used to assess group differences in rTBF between LGG and HGG. The area under the receiver-operating characteristic (ROC) curves were constructed to determine the diagnostic accuracy of rTBF parameters derived from both ASL and DSC-PWI methods for differentiating LGG from HGG when including or excluding oligodendrogliomas (OD). Linear regression and Bland-Altman analyses were performed to evaluate the correlation and agreement between PCASL or VSASL and DSC-PWI.
Results
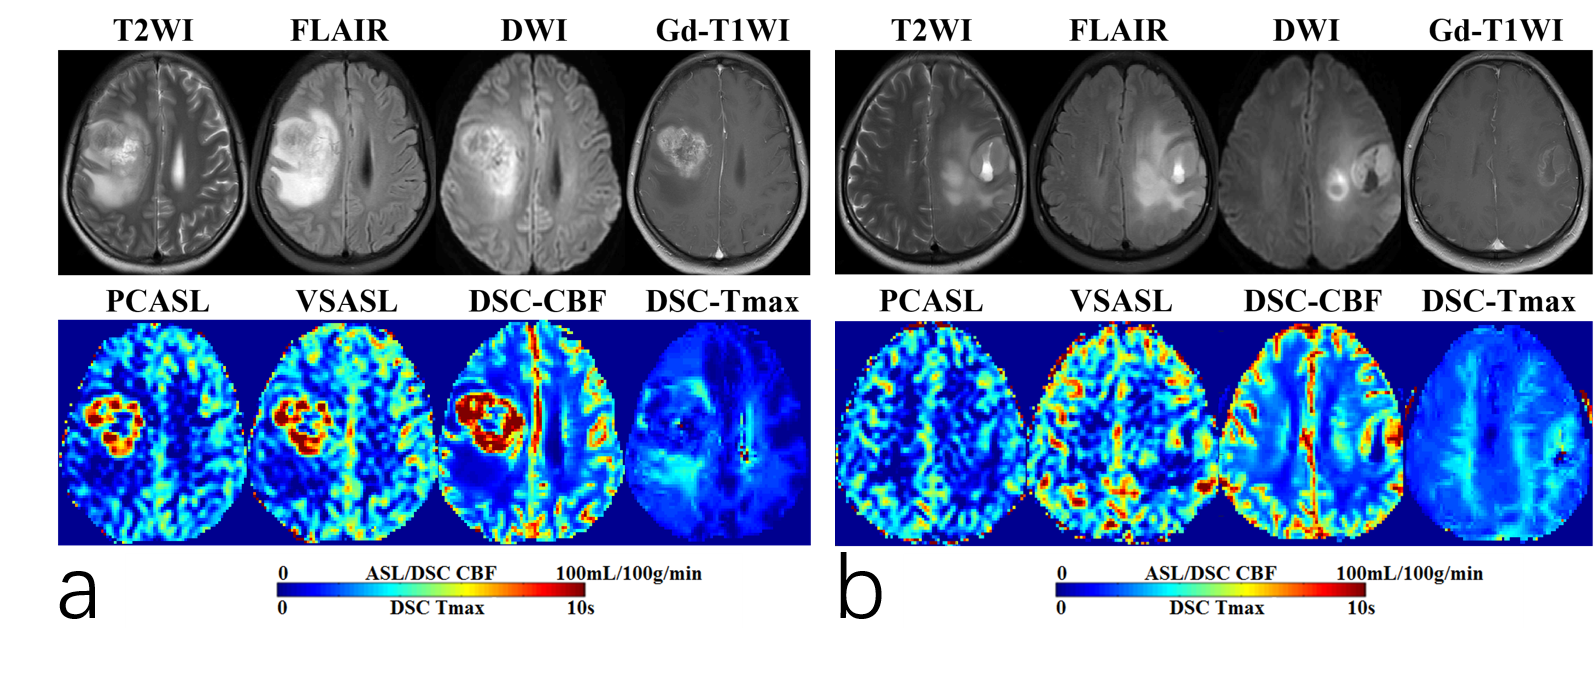
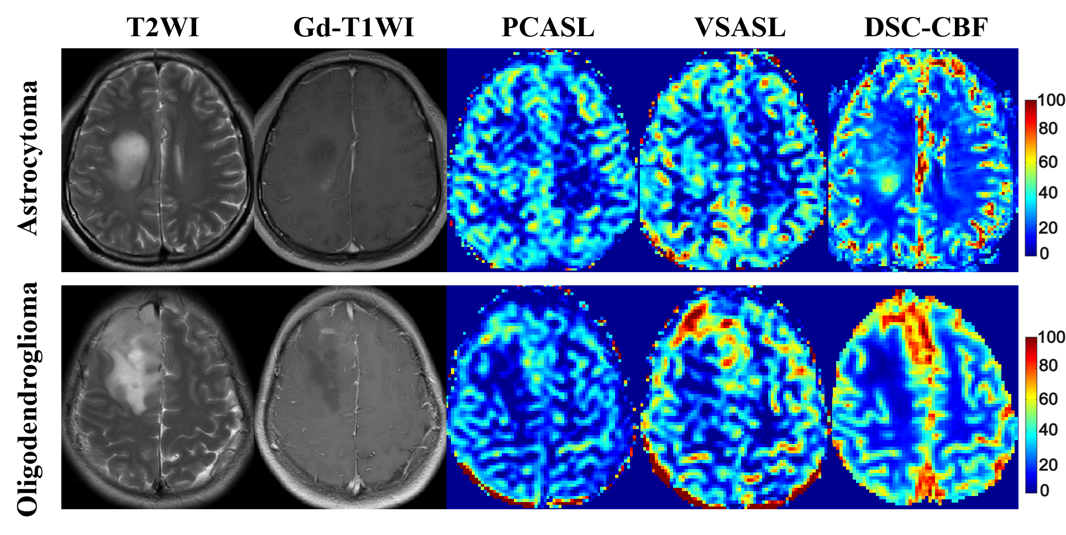
Fig.1(a, b) showed the typical cases in glioblastoma without (a) and with (b) various, prolonged ATT in TZ. For Tmax grouping, 136 ROIs (51.1%) fall in Tmax values of 0-2s, 115(43.2%) in 2-4s, and 15 (5.6%) in>4s. With the increase of Tmax, the rCBF value of three perfusion methods monotonously decreased. For PCASL, it performed stable in Tmax0-2s, but underestimated in prolong Tmax regions(18.8% and 42.9% lower than rDSC CBF in Tmax 2-4s and >4s, respectively). For VSASL, it overestimated the rCBF value in the region of Tmax 0-2s (22.2% higher than DSC CBF) and consistent with DSC in Tmax group of 2-4s and >4s. Lesser sensitivity to ATT in VSASL was found. (Fig.2).The rTBF parameter of HGGs were significantly than that in LGGs (P<0.001). Without respect to tumor grade, the low-grade ODs tended to be higher tumor blood flow11. VSASL images seem largely more comparable in patients of OD on visual inspection than PCASL as Fig.3 presented, which may confuse the reliability of the VSASL parameter in preoperative grading. For the ROC curve including OD, the rTBF of PCASL yielded a higher AUC of 0.909 with a sensitivity of 86.96% and a specificity of 91.67% comparing to VSASL (AUC of 0.900 with a sensitivity of 95.65% and a specificity of 87.50%). When excluding OD, the AUC of VSASL increased to 0.973 with a sensitivity of 95.24% and a specificity of 100%, better than PCASL (AUC, sensitivity and specificity of 0.963, 85.71% and 100%, respectively).
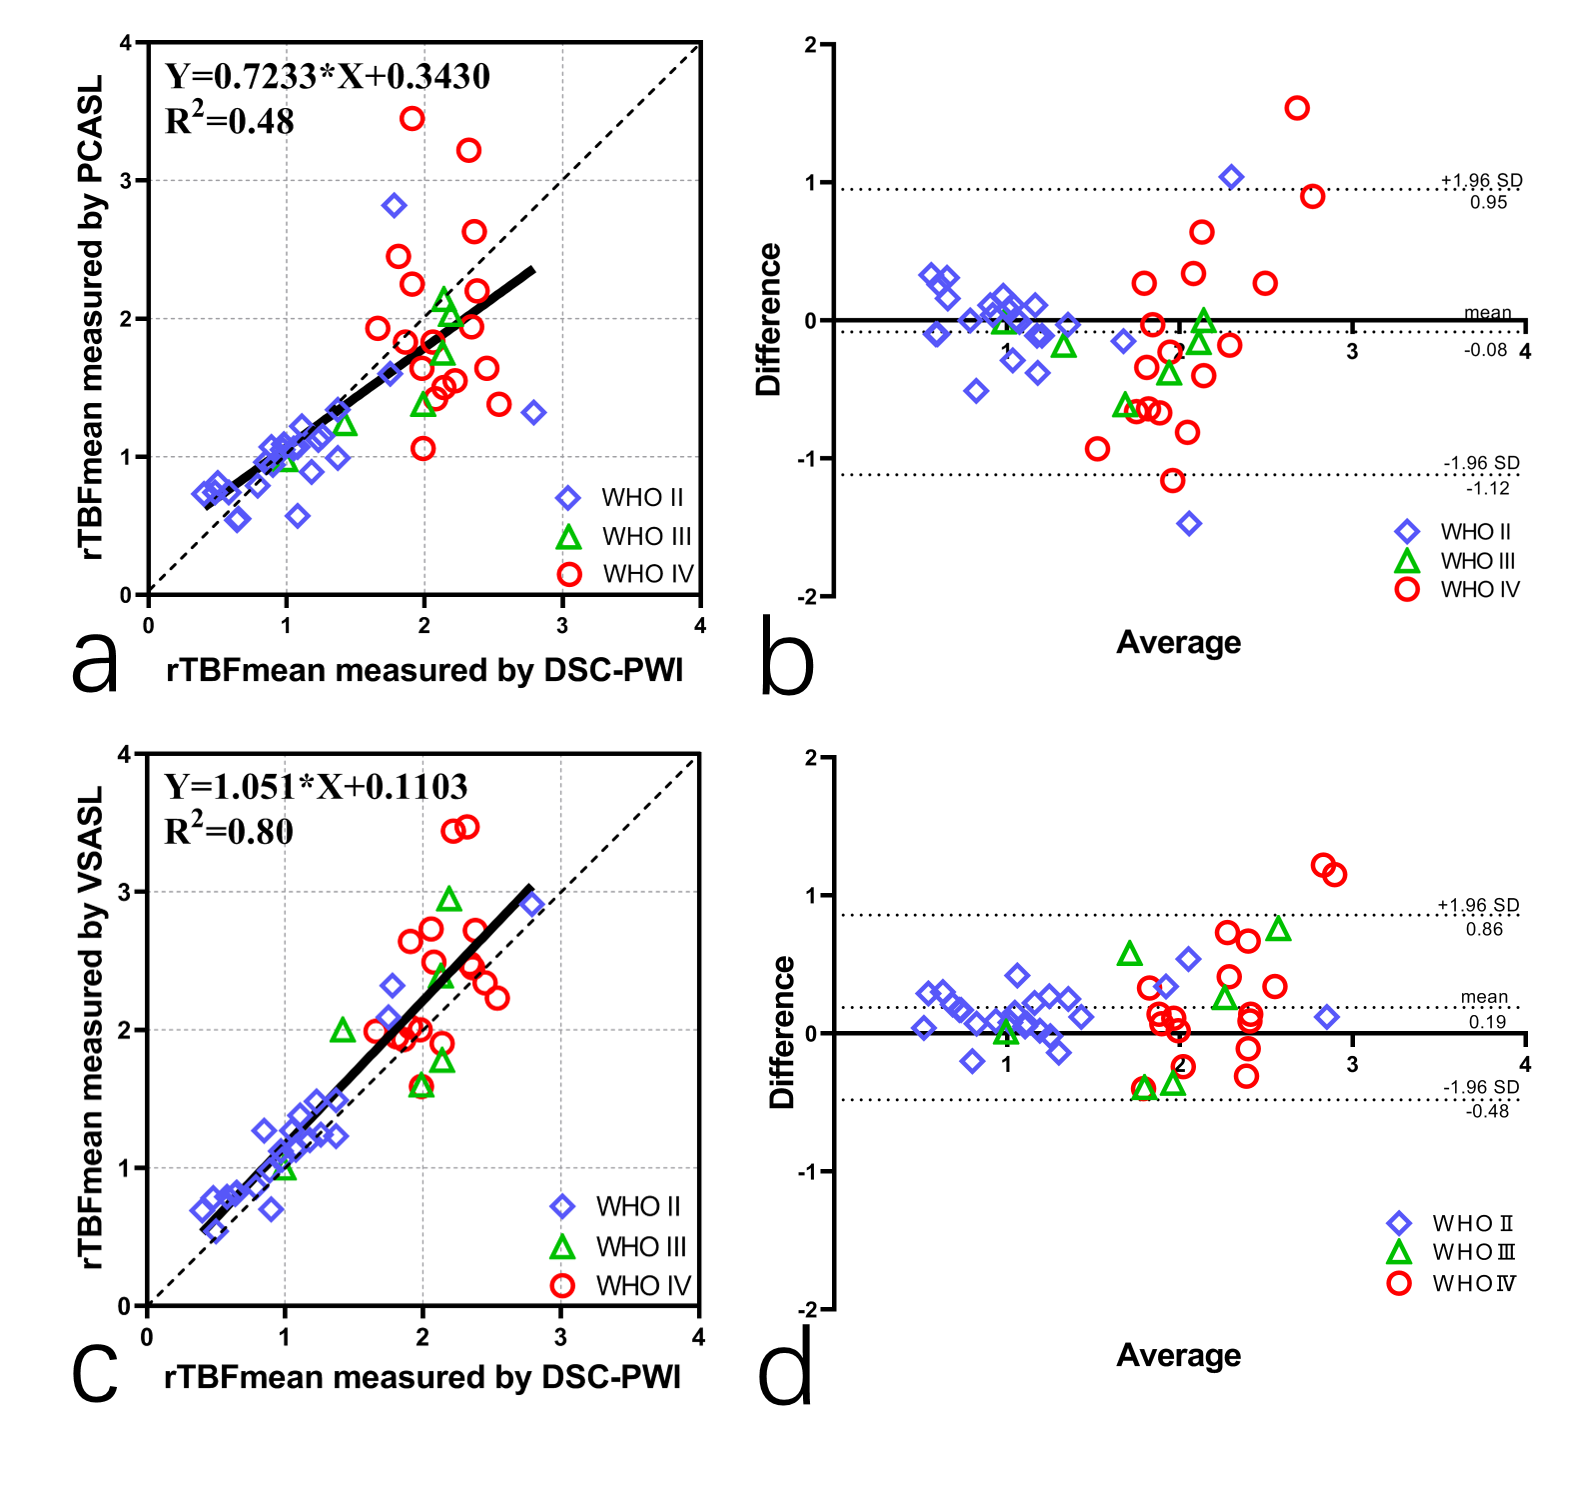
Fig.4 shows linear regression and Bland-Altman analyses of the ratios of TBF over CBFGM, between PCASL, VSASL with DSC-PWI, respectively. Compared to PCASL (a,b), VSASL (c,d) demonstrated better correlation (R2=0.8000 vs 0.48) and agreement with DSC-PWI. Both methods show good separation between low grade (grade II) and high grade (grade III & IV) tumors based on differences in tumor perfusion.
Conclusions
A study using FT-VSASL was compared to PCASL and DSC-PWI approach for subjects of glioma at 3T, demonstrating the existence of various and prolonged ATT in brain glioma patients which may lead to misestimation of conventional ASL quantification. Detecting by the dependence of the CBF levels based on Tmax, lesser sensitivity to ATT for VSASL than PCASL was reported, further demonstrating the robustness of this technique in the quantitative assessment and preoperative grading of brain gliomas.Acknowledgements
Qu gratefully acknowledge professor Qin Qin and my supervisor professor Zhibo Wen for their supportin conducting this study.References
1. Alsop DC, Detre JA, Golay X, et al. Recommended implementation of arterial spin-labeled perfusion MRI for clinical applications: A consensus of the ISMRM perfusion study group and the European consortium for ASL in dementia. MAGN RESON MED 2015;73(1):102-116.
2. Cebeci H, Aydin O, Ozturk-Isik E, et al. Assesment of perfusion in glial tumors with arterial spin labeling; comparison with dynamic susceptibility contrast method. EUR J RADIOL 2014;83(10):1914-1919.
3. Alsop DC, Detre JA. Reduced transit-time sensitivity in noninvasive magnetic resonance imaging of human cerebral blood flow. J Cereb Blood Flow Metab 1996;16(6):1236-1249.
4. Hendrikse J, van Osch MJ, Rutgers DR, et al. Internal carotid artery occlusion assessed at pulsed arterial spin-labeling perfusion MR imaging at multiple delay times. RADIOLOGY 2004;233(3):899-904. 5. Wong EC, Cronin M, Wu WC, Inglis B, Frank LR, Liu TT. Velocity-selective arterial spin labeling. MAGN RESON MED 2006;55(6):1334-1341.
6. Qiu D, Straka M, Zun Z, Bammer R, Moseley ME, Zaharchuk G. CBF measurements using multidelay pseudocontinuous and velocity-selective arterial spin labeling in patients with long arterial transit delays: comparison with xenon CT CBF. J MAGN RESON IMAGING 2012;36(1):110-119.
7. Qin Q, van Zijl PC. Velocity-selective-inversion prepared arterial spin labeling. MAGN RESON MED 2016;76(4):1136-1148.
8. Louis DN, Perry A, Reifenberger G, et al. The 2016 World Health Organization Classification of Tumors of the Central Nervous System: a summary. ACTA NEUROPATHOL 2016;131(6):803-820.
9. Calamante F, Christensen S, Desmond PM, Ostergaard L, Davis SM, Connelly A. The physiological significance of the time-to-maximum (Tmax) parameter in perfusion MRI. STROKE 2010;41(6):1169-1174.
10. Khashbat MD, Abe MT, Ganbold MM, et al. Correlation of 3D Arterial Spin Labeling and Multi-Parametric Dynamic Susceptibility Contrast Perfusion MRI in Brain Tumors. J Med Invest 2016;63(3-4):175-181.
11. Lev MH, Ozsunar Y, Henson JW, et al. Glial tumor grading and outcome prediction using dynamic spin-echo MR susceptibility mapping compared with conventional contrast-enhanced MR: confounding effect of elevated rCBV of oligodendrogliomas [corrected]. AJNR Am J Neuroradiol 2004;25(2):214-221.
Figures