0133
Identification of pancreatic intraepithelial neoplasia in the mouse pancreas with MR Microscopy1Champalimaud Research, Champalimaud Centre for the Unknown, Lisbon, Portugal, 2Department of Biomedical Engineering, Vanderbilt University, Nashville, TN, United States
Synopsis
Survival in pancreatic cancer resides on an early diagnosis, for which current imaging methods are insufficient. Here, we investigated which MRI contrast can reflect pancreatic pre-neoplastic lesions, particularly, pancreatic intraepithelial neoplasia (PanIN). To this end, we developed an ultrafast DWI-MGE pulse sequence and performed MR microscopy on pancreas extracted from transgenic mice with PanIN lesions (along with controls), and validated our findings using histology. PanIN lesions were clearly detected in the transgenic mice and differentiated from inflammatory changes at b=1000 sec/mm2 and long TE. Our findings are encouraging for future detection of PanIN in vivo.
Introduction
Pancreatic cancer is the 3rd leading cause of cancer-related death in the US, with an 8% survival rate at 5 years1. Its frequent late diagnosis in advanced stages precludes the only curative therapeutic option – surgery, making early diagnosis key for an effective treatment. However, patients are usually asymptomatic early on, and medical care is only sought at advanced stages of the disease1. Furthermore, current cross-sectional imaging is unable to reliably diagnose one of the main pre-neoplastic lesions responsible for the disease - pancreatic intraepithelial neoplasia (PanIN), due to its microscopic size2.The use of genetically engineered mouse models for pancreatic cancer research is now well established3. Pdx1-Cre, KrasG12D mice are known to develop PanIN and pancreatic ductal adenocarcinoma, serving as a good model for PanIN detection.
Since it remains unknown how imaging could detect PanIN, the aim of this pre-clinical study was to identify these lesions, probably amenable to treatment in the clinical setting, harnessing state-of-the-art MR Microscopy.
Methods
All experiments were preapproved by the institutional and national authorities and in accordance with European Directive2010/63.In vivo MRI
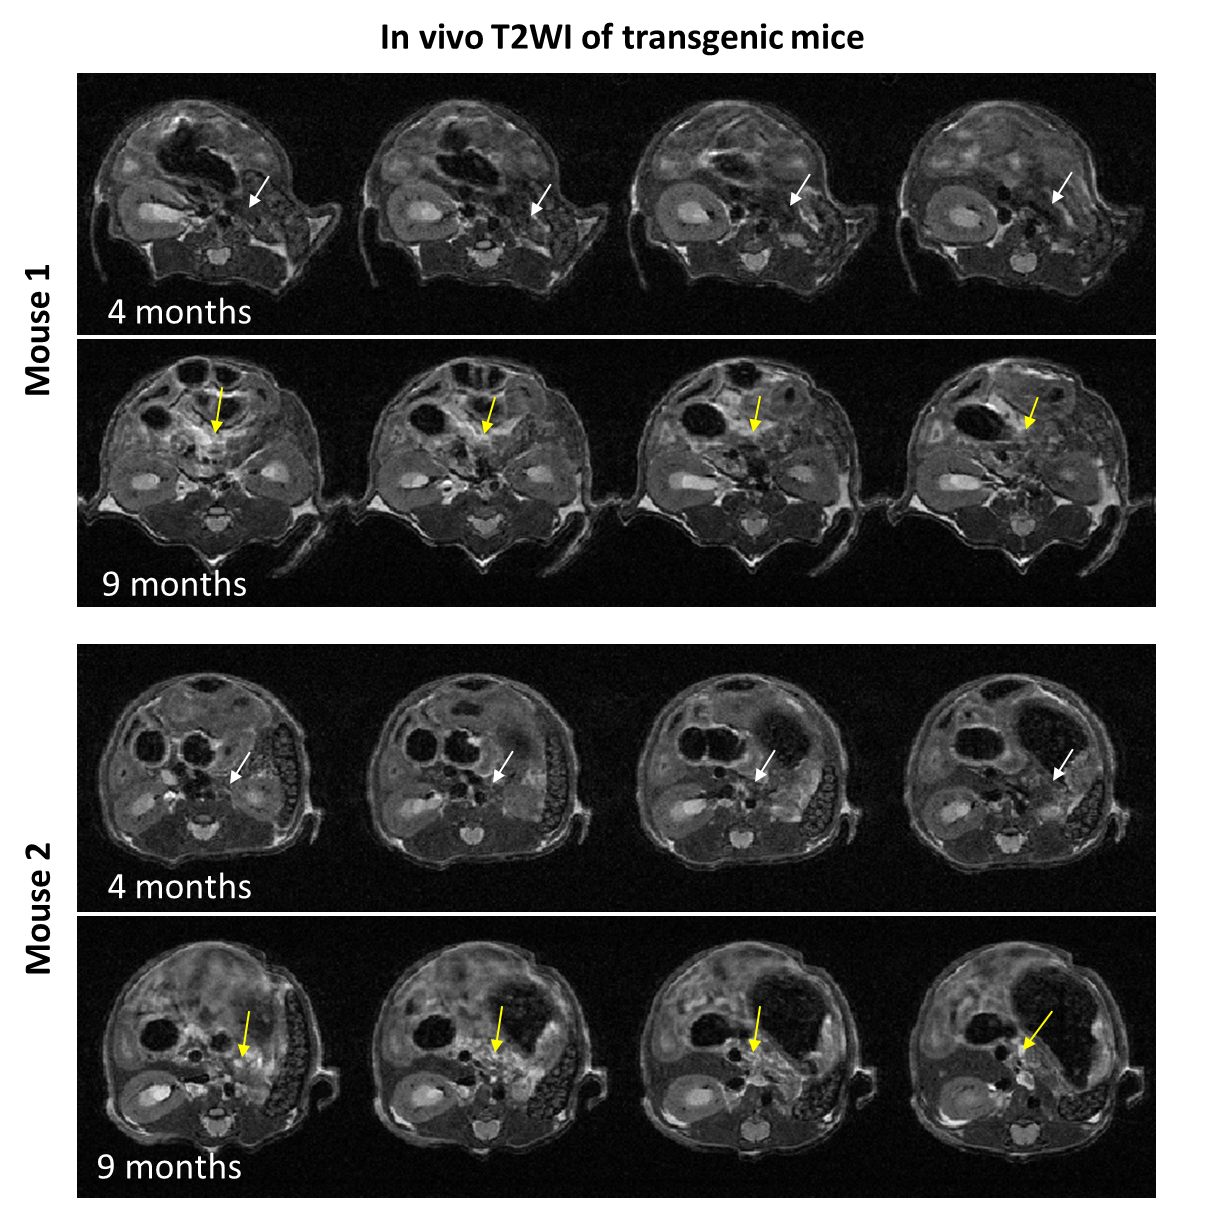
N=10 Pdx1-Cre; KrasG12D mice4 (C57BL/6J background; founders obtained from JAX-USA via CharlesRiver-France) underwent abdominal imaging once every 3 weeks from 14-weeks-old, on a 1T scanner (IconTM, Bruker, Germany) with TSE-T2WI (TR/TE=3825/60 ms; averages=30; RARE factor=8; slice thickness=0.7mm; resolution=150x150µm2; respiratory triggered). Two animals showed pancreatic signal change at 9-months-old (Figure 1), coinciding with the expected timing of PanIN and pancreatic ductal adenocarcinoma occurrence in the model5. Both mice were sacrificed for post-mortem analyses, together with a 9-months-old C57BL/6J healthy control.
Tissue extraction
The mice’s pancreases were removed by median laparotomy and immersed in 4%-PFA for 48 hours, followed by immersion in PBS for 24 hours. The samples were then immersed in Flourinert® within a 10mm NMR tube for ex vivo MRI.
MR Microscopy
Pancreatic samples were imaged in a 16.4T scanner (Ascend AeonTM, Bruker, Germany) using a unique 10mm CryoprobeTM (Bruker, Germany).
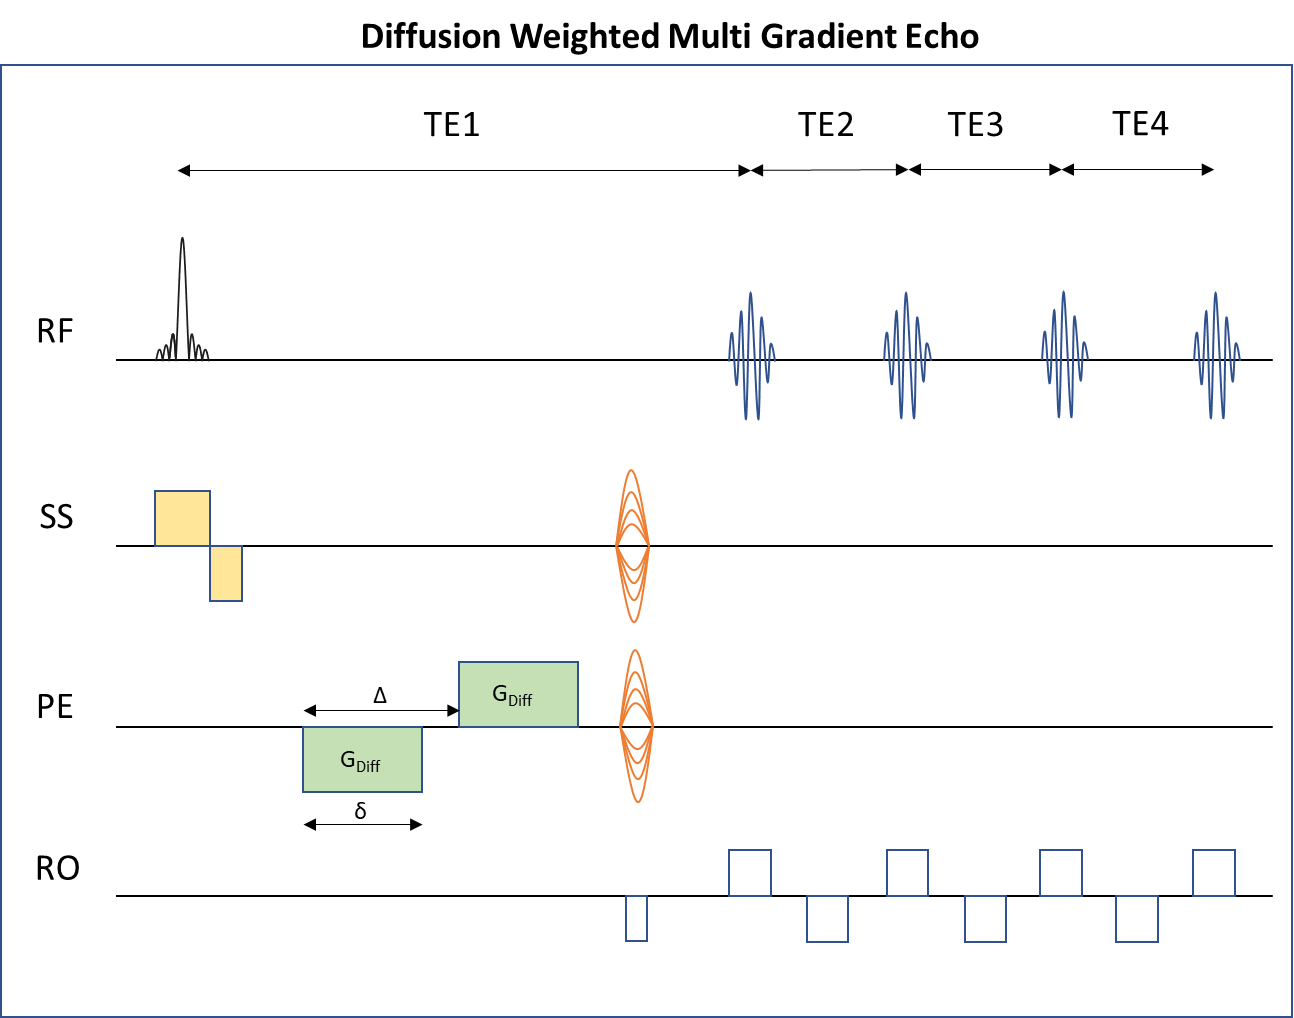
A novel pulse sequence – DWI-MGE (Figure 2) was designed to provide ultrahigh-resolution 3D images with both diffusion and T2* contrast. The sequence includes a small flip-angle slab-selective excitation followed by diffusion gradients and phase encoding, and a multiple-gradient-echo readout echo-train (TE=9.2ms; TR=125ms; number of echoes=4; resolution=80x80x80µm3; b values=0 and 1000s/mm2; δ=2ms; Δ=7ms; DWI represents powder average from 10 directions).
The datasets were analyzed using MATLAB™ (MathWorks Inc., Natick, MA) and ImageJ (US National Institutes of Health).
Histology
Following MRI scans, formalin-fixed paraffin blocks of the whole pancreas were produced and histopathological evaluation was performed. Specimens were sliced with 0.5mm intervals and 5-µm thick sections were stained with hematoxylin and eosin (H&E). The slides were digitalized on a high-resolution scanner (Ultra-Fast Scanner™, Philips), visualized using the IntelliSite Pathology Solution™ (Philips), evaluated by a gastrointestinal pathologist (17 years of experience) and correlated with MRI by a gastrointestinal radiologist (6 years of experience).
Results
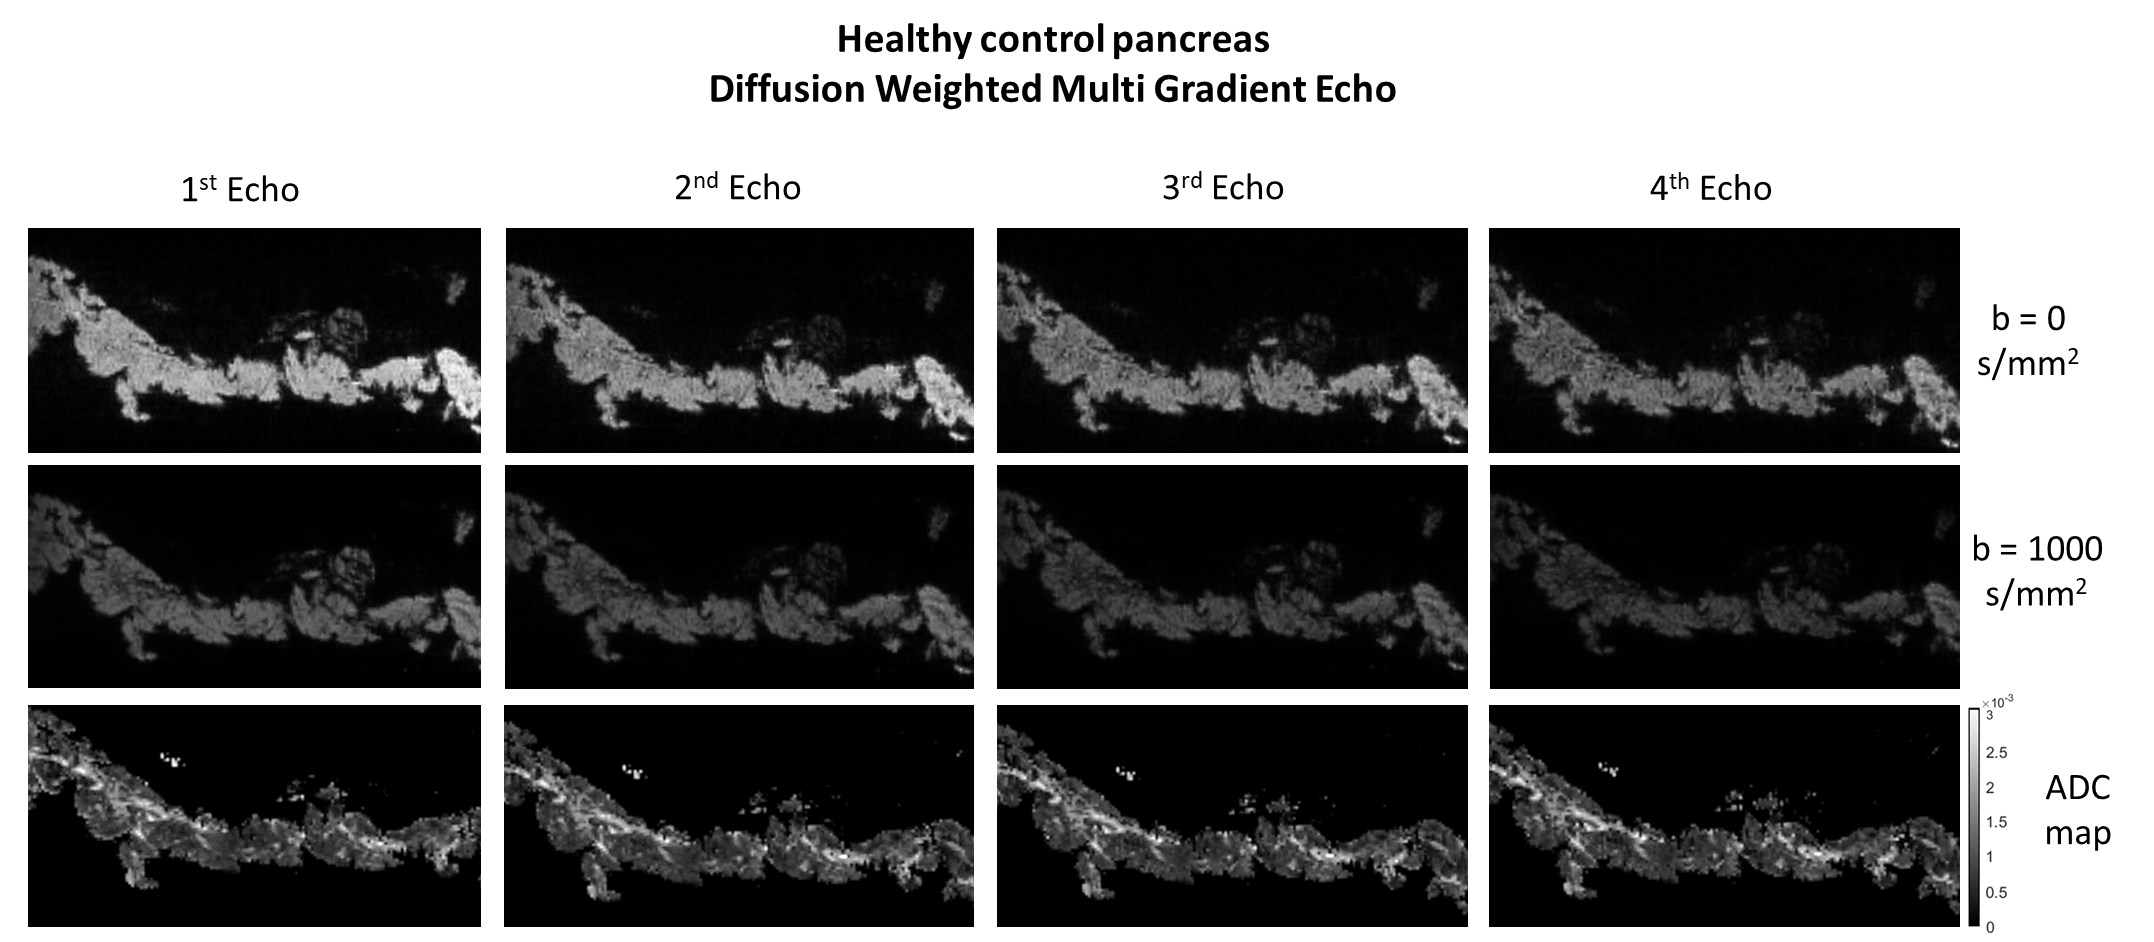
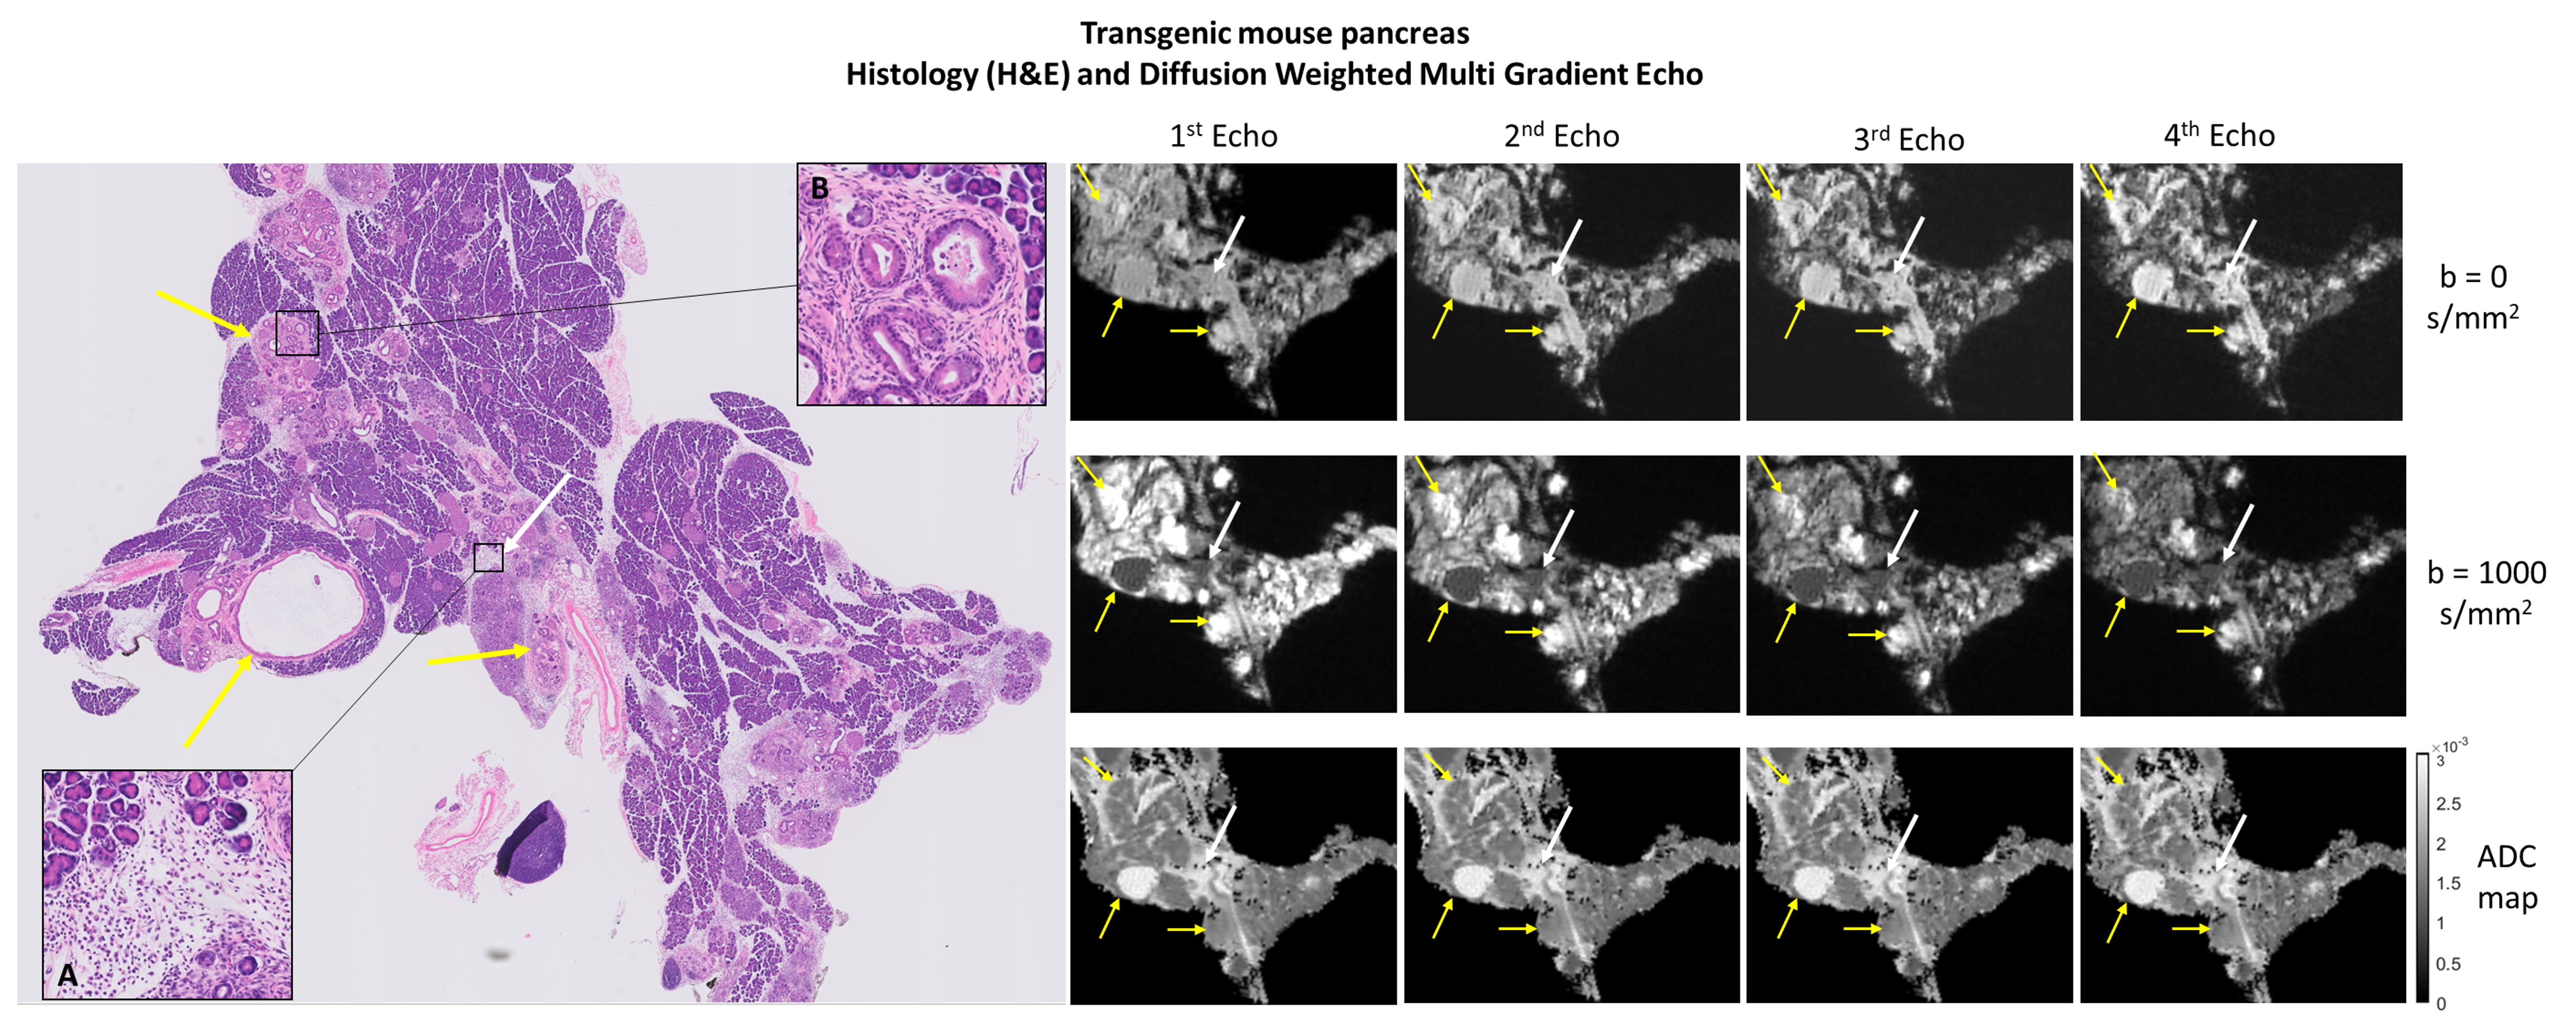
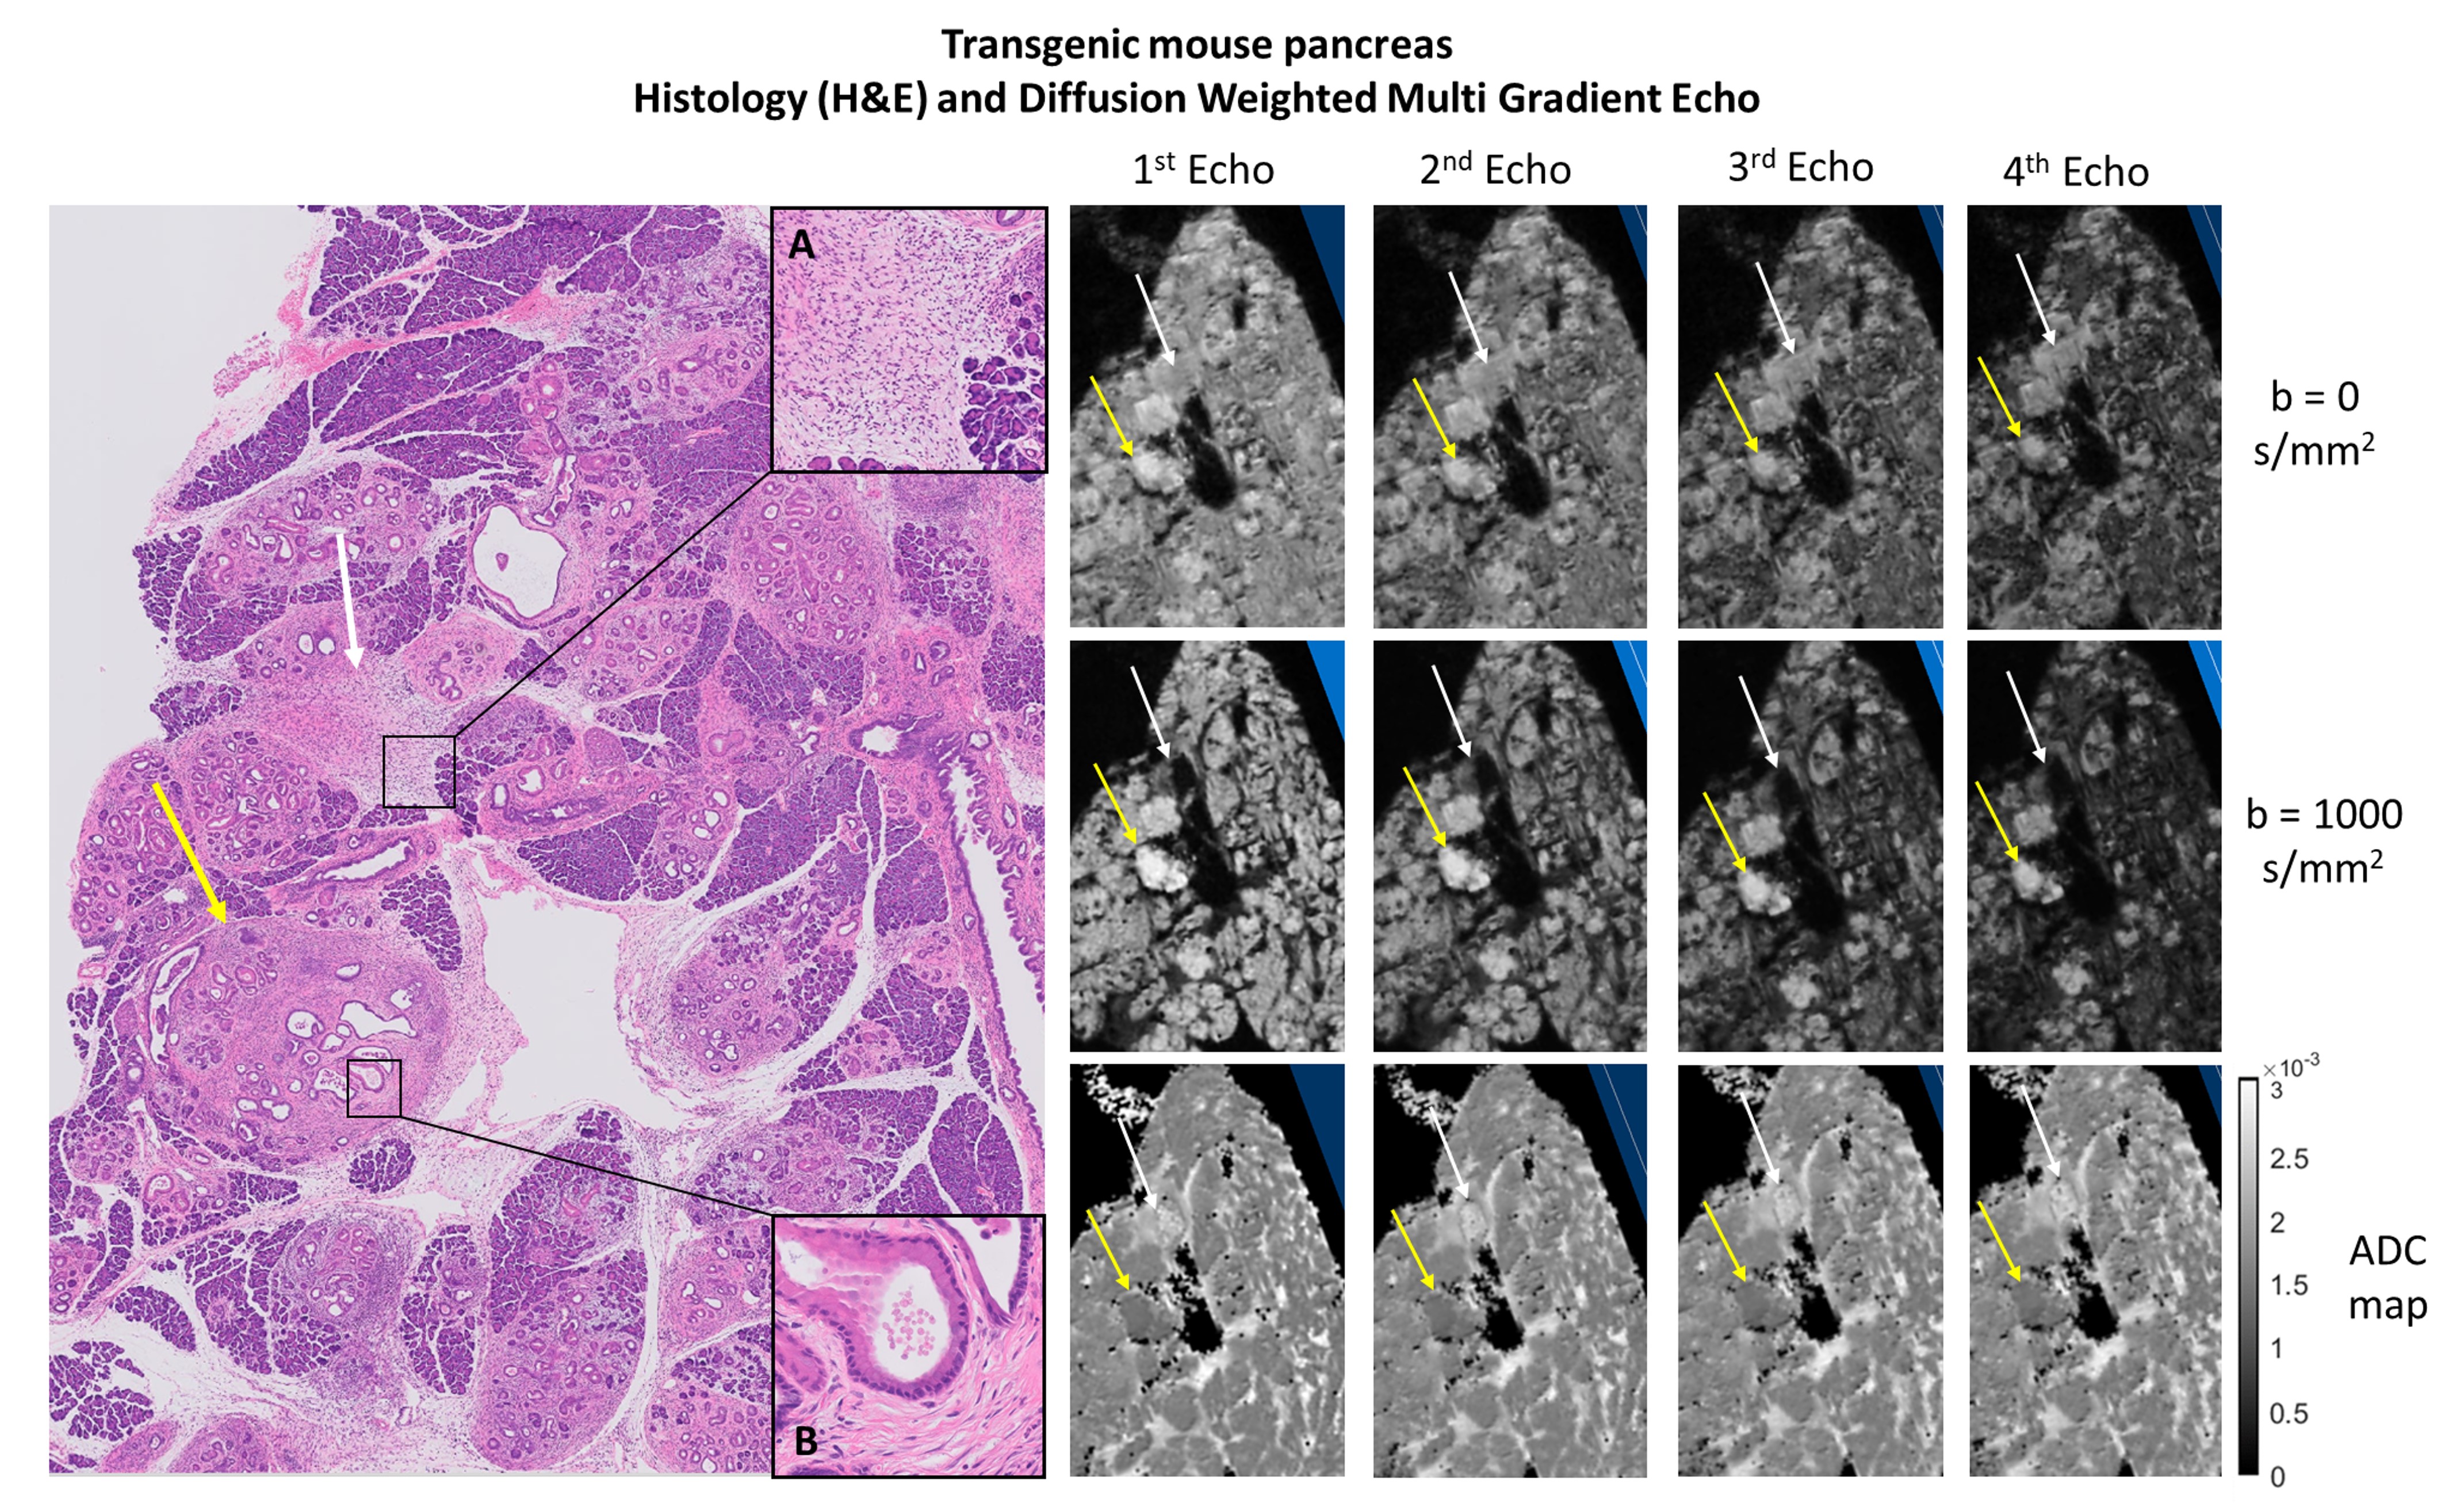
The control mouse pancreas was diffusely homogeneous in all sequences, without focal lesions or parenchymal abnormalities (Figure 3).Figures 4 and 5 depict histological pancreatic slices from the transgenic mice alongside DWI-MGE MR-microscopy (80µm isotropic). The images showed multiple nodules with varying size, distributed throughout the pancreas of the transgenic mice, most conspicuous with b=1000s/mm2 and TE=15.5ms, where the contrast between these nodules and the background parenchyma was highest. These nodules were histologically found to correspond to PanIN, with surrounding fibrosis and variable proportions of lymphocytes and fibroblasts - desmoplastic reaction (Figures 4B and 5B, yellow arrows). No lesions of invasive pancreatic ductal adenocarcinoma were found in both specimens.
Histopathological analysis also evidenced inflammatory infiltrates with polymorphonuclear leukocytes, lymphocytes and parenchymal atrophy in several areas of the specimen, interpreted as acute pancreatitis (Figures 4A and 5A, white arrows). The DWI-MGE with TE=15.5ms and b=1000s/mm2 showed PanIN with high signal intensity, allowing differentiation from inflammatory changes, which presented with low signal intensity.
Discussion
Our findings show, for the first time, that PanIN can be clearly identified with mixed diffusion/T2* contrast. The increased contrast at b=1000s/mm2 and longer TEs can be attributed to high cellularity in pre-neoplastic lesions, which restricts diffusion of water molecules6, and potentially creates internal gradient distributions, which together contrast well with background parenchyma. In other words, the microstructural complexity of PanIN is more robustly highlighted when diffusion and susceptibility weighting act as mutual contrast filters.The distinction between inflammation and pre-neoplastic lesions with DWI-MGE (b=1000s/mm2; TE=15.5ms) is another important finding. Indeed, distinguishing pancreatic inflammation from neoplastic tissue has been a difficult task for radiologists in the clinical setting7.
These new contrasts are an encouraging first step towards imaging an important target in pancreatic cancer: PanIN, which could probably be subjected to early therapeutic interventions, changing the usual course of the disease. MR-microscopy will not be available in the clinic but we are now in the process of iteratively degrading spatial resolution to infer on how the contrasts observed here would translate to the clinical setting8.
Conclusion
PanIN can be detected in ex vivo mouse pancreas with MRI. The combination of high b-values and long TEs also appears to distinguish parenchymal inflammatory changes from pre-neoplastic lesions. These first results represent an encouraging step towards establishing early biomarkers in pancreatic cancer.Acknowledgements
The first two authors contributed equally to this work.
The authors thank Ms. Susana Dias, Histopathology Platform of the Champalimaud Foundation.
Funding Support: Champalimaud Foundation; H2020-MSCA-IF-2018, ref:844776; NIH EB019980.
References
1. Siegel RL, Miller KD, Jemal A. Cancer statistics, 2017. CA Cancer J Clin. 2017;67(1):7-30. doi:10.3322/caac.21387
2. Vullierme M-P, Menassa L, Couvelard A, et al. Non-branched microcysts of the pancreas on MR imaging of patients with pancreatic tumors who had pancreatectomy may predict the presence of pancreatic intraepithelial neoplasia (PanIN): a preliminary study. Eur Radiol. April 2019. doi:10.1007/s00330-019-06154-3
3. Colvin EK, Scarlett CJ. A historical perspective of pancreatic cancer mouse models. Semin Cell Dev Biol. 2014;27:96-105. doi:10.1016/j.semcdb.2014.03.025
4. Hingorani SR, Petricoin EF, Maitra A, et al. Preinvasive and invasive ductal pancreatic cancer and its early detection in the mouse. Cancer Cell. 2003;4(6):437-450. doi:10.1016/S1535-6108(03)00309-X
5. Guerra C, Barbacid M. Genetically engineered mouse models of pancreatic adenocarcinoma. Mol Oncol. 2013;7(2):232-247. doi:10.1016/j.molonc.2013.02.002
6. Kartalis N, Lindholm TL, Aspelin P, Permert J, Albiin N. Diffusion-weighted magnetic resonance imaging of pancreas tumours. Eur Radiol. 2009;19(8):1981-1990. doi:10.1007/s00330-009-1384-8
7. Barral M, Taouli B, Guiu B, et al. Diffusion-weighted MR imaging of the pancreas: Current status and recommendations. Radiology. 2015;274(1):45-63. doi:10.1148/radiol.14130778
8. Santiago I, Santinha J, Ianus A, et al. Susceptibility perturbation MRI maps tumor infiltration into mesorectal lymph nodes. Cancer Res. 2019;79(9):2435-2444. doi:10.1158/0008-5472.CAN-18-3682
Figures