0132
Differentiation of Murine Pancreatic Tumours at 7 T with Hyperpolarized 13C-Pyruvate-Lactate MRSI, 18F-FDG PET, and DWI1Department of Nuclear Medicine, Klinikum rechts der Isar, Technical University of Munich, Munich, Germany, 2Institute of Radiology, Klinikum rechts der Isar, Technical University of Munich, Munich, Germany, 3Institute of Pathology, Technical University of Munich, Munich, Germany, 4Internal Medicine II, Klinikum rechts der Isar, Technical University of Munich, Munich, Germany
Synopsis
Multimodal imaging for characterization of pancreatic tumour cellularity and metabolism has potential to guide treatment. Murine orthotopically transplanted tumours were imaged with DWI, 13C-pyruvate CSI, and 18F-FDG PET, and endogenous tumours with DWI and CSI. Transplanted epithelial and mesenchymal tumours had similar cellularity, shown by ADC, but different metabolism, with higher mesenchymal AUC ratios and SUV. Compared with other endogenous tumour growth patterns, classical ductal had lower tumour cellularity (higher ADC), while solid had higher and more-variable AUC ratios. The combination of these methods can characterize tumour metabolism, including correcting for tumour cellularity, better than CSI alone.
Introduction
Pancreatic ductal adenocarcinoma (PDAC) has poor clinical survival, with urgent need for biomarkers for tumour differentiation. Multimodal imaging, including measures of glucose metabolism and cellularity, has the potential to non-invasively assess tumour metabolic subtype and intra- and inter-tumoural heterogeneity to guide and monitor treatment.Methods
Murine PDAC tumours were imaged with diffusion weighted MRI (DWI) and hyperpolarized 13C-pyruvate-lactate spectroscopic imaging (CSI), and with 18F-FDG PET.Tumour models: Murine epithelial (N=3) and mesenchymal (N=4) PDAC cell lines were orthotopically transplanted in mice (CrTac:NCr-Foxn1nu). Separately, CKPlox mice (Ptft1awt/cre; Kraswt/G12D; p53fl/fl) developed endogenous PDAC tumours (N=23 mice, with 29 histologically correlated regions classified epithelial by histology, with mesenchymal and anaplastic excluded from analysis due to low numbers in this cohort).
Imaging Systems: Small animal 7 T preclinical scanner (Agilent/GE magnet, Bruker AVANCE III HD electronics) using a dual-tuned 1H/13C volume coil (31 mm ID; RAPID Biomedical). Small animal PET/CT scanner (Siemens Inveon).
MR Imaging: For all tumours, T2-weighted anatomical RARE, DWI, and 13C CSI were acquired. DWI used an EPI readout with 12 b-values up to 1528 s/mm2 and 0.25x0.25x1.0 mm3 voxels and fit for the apparent diffusion coefficient (ADC) in MatLab. [1-13C]pyruvate was hyperpolarized (Oxford instruments HyperSense DNP), injected (80 mM), and imaged with multi-frame CSI with 2x2x3 mm3 voxels and 5 s / frame. Ratios of the area under the curves (AUCr) of lactate to pyruvate spectral peak time-courses were calculated.
PET Imaging: For orthotopic tumours, 15 min static [18F]-FDG PET images were acquired 1 hour post-injection. Mean standardized uptake values (SUV) were calculated within ROIs derived from coregistered anatomical MRI.
Analysis: Mean ADC, AUCr, and SUV were calculated within regions of interest (defined manually based on histopathological evaluation of H&E staining). Necrotic areas were excluded. Statistical group comparisons and correlations were calculated in GraphPad PRISM.
Histology: Endogenous tumours were extracted, fixed in formalin, and H&E stained and classified as epithelial, mesenchymal, or anaplastic by experienced pathologist (KS). Epithelial tumours were characterized by growth pattern1 (classical ductal, papilliform, small ductal, or solid squamous-like) and by tumour cellularity (low, medium, or high)2.
Results
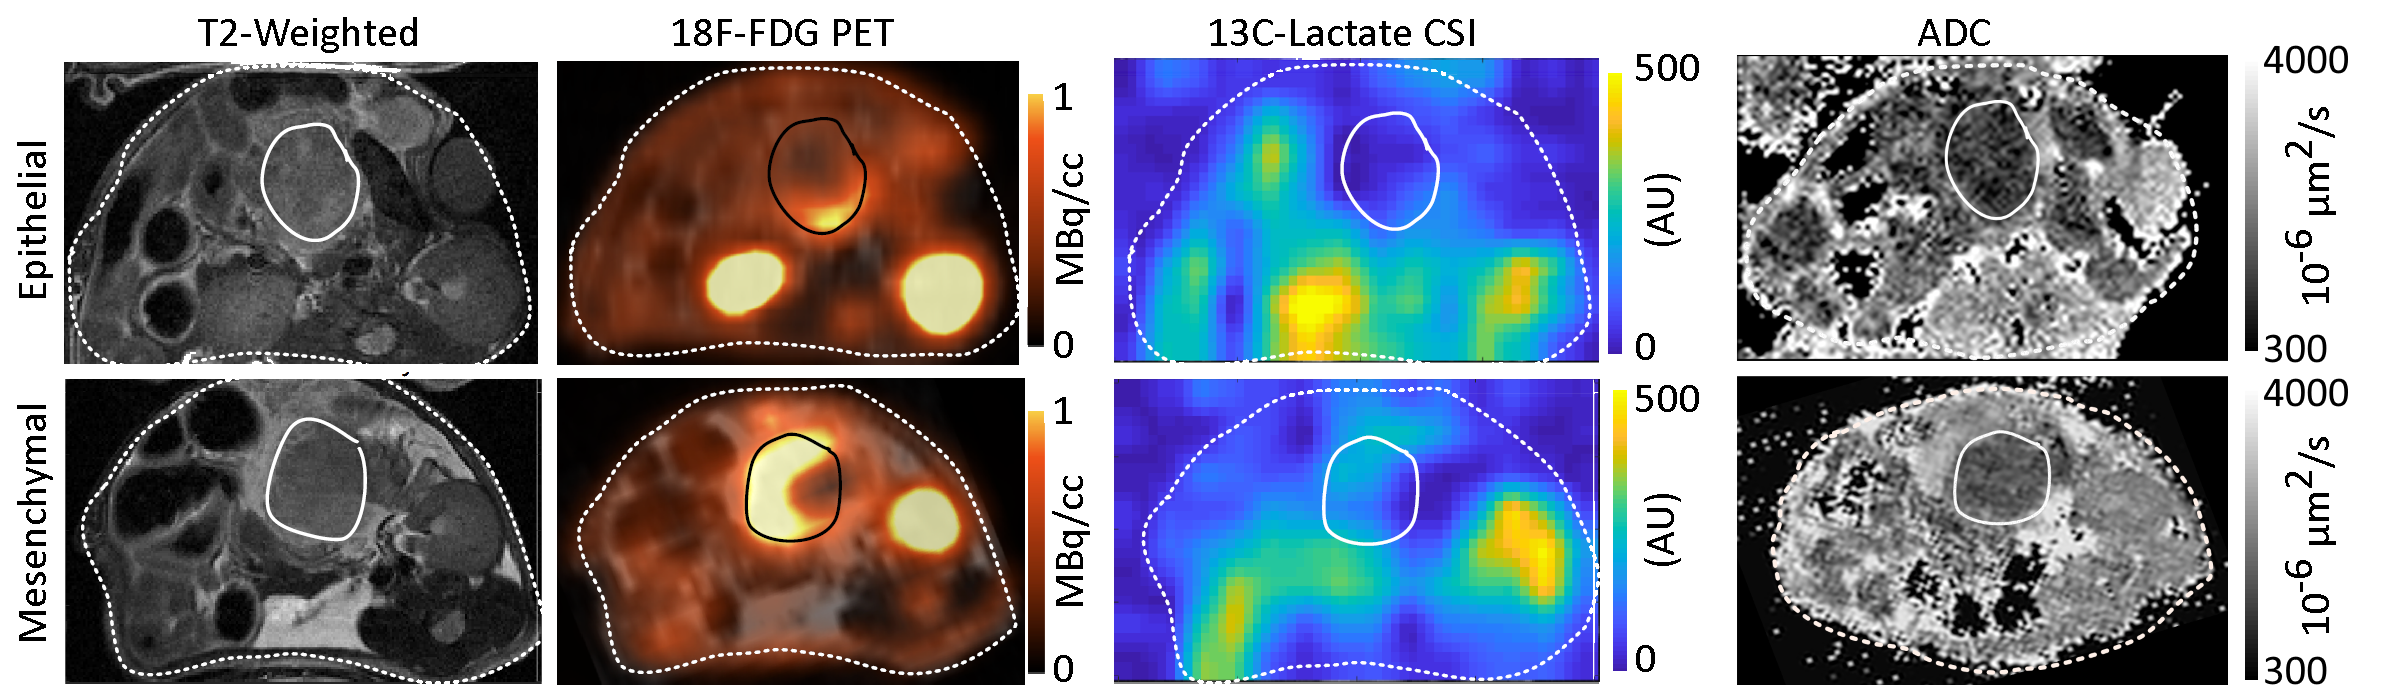
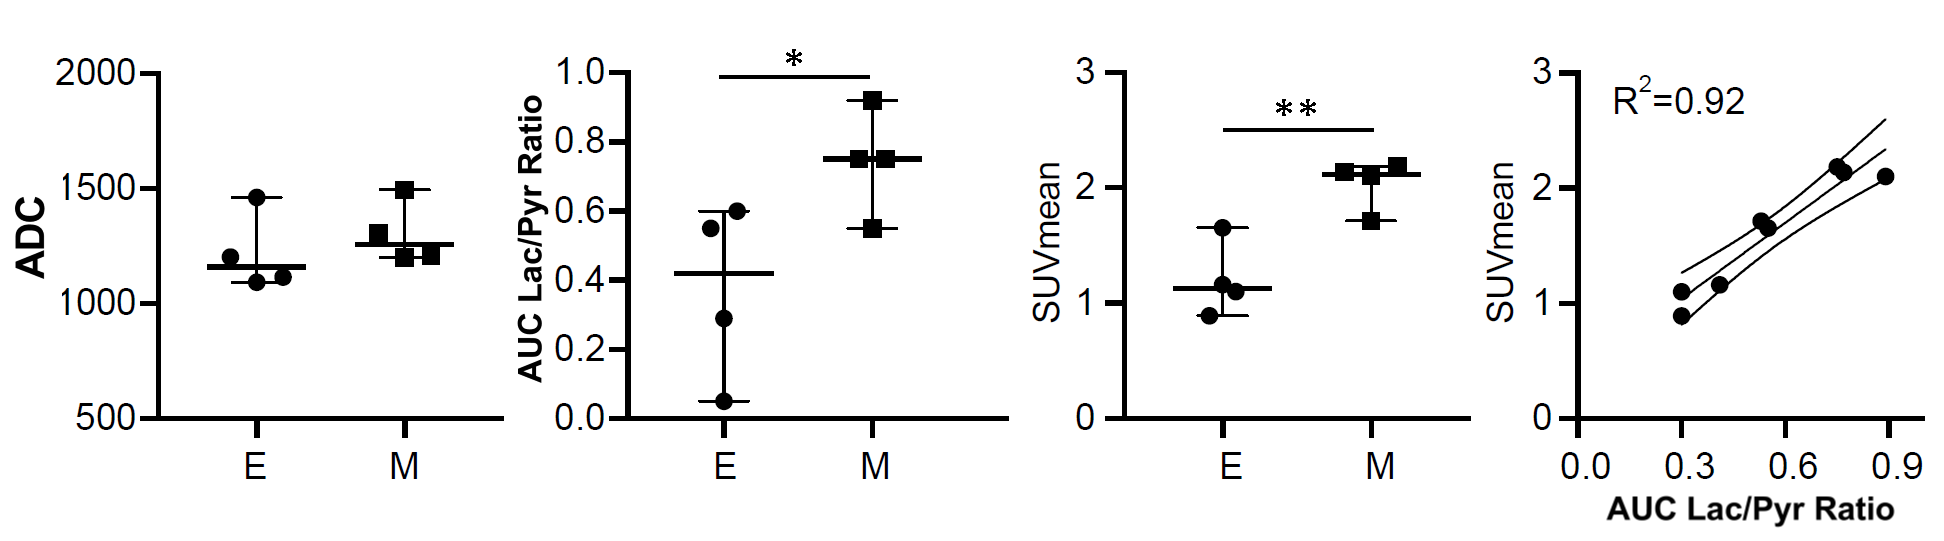
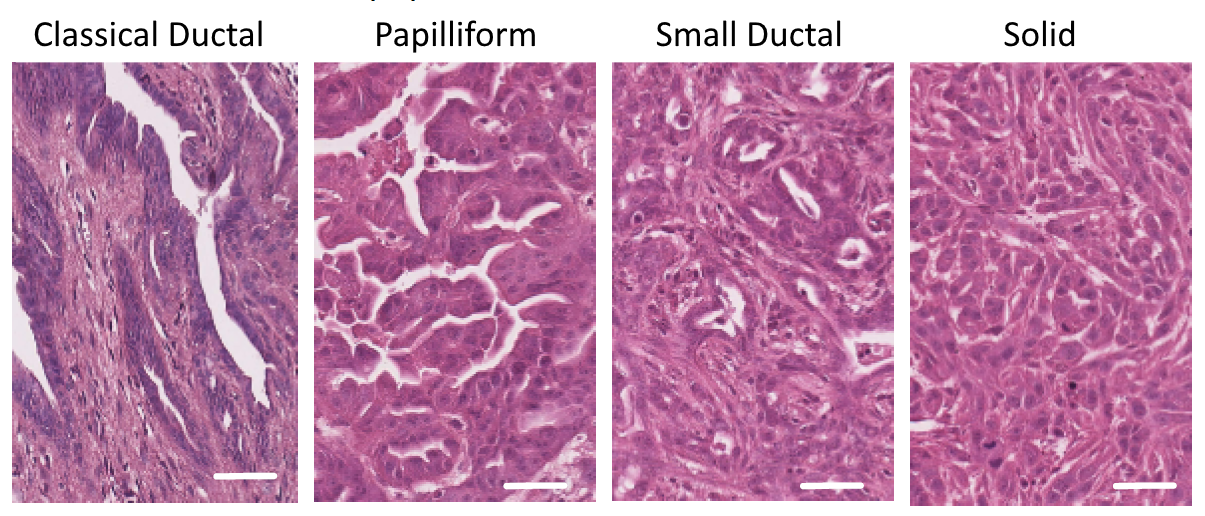
Orthotopic tumour imaging (Fig. 1) showed no significant differences in ADC between epithelial and mesenchymal groups (Fig. 2). Mean SUV and 13C AUCr were significantly different and positively correlated (Fig. 2).Endogenous epithelial tumours were grouped as classical ductal with low tumour cellularity, papilliform with medium tumour cellularity, or small ductal or solid with medium or high tumour cellularity. Tumour histology examples are shown in Figure 3.
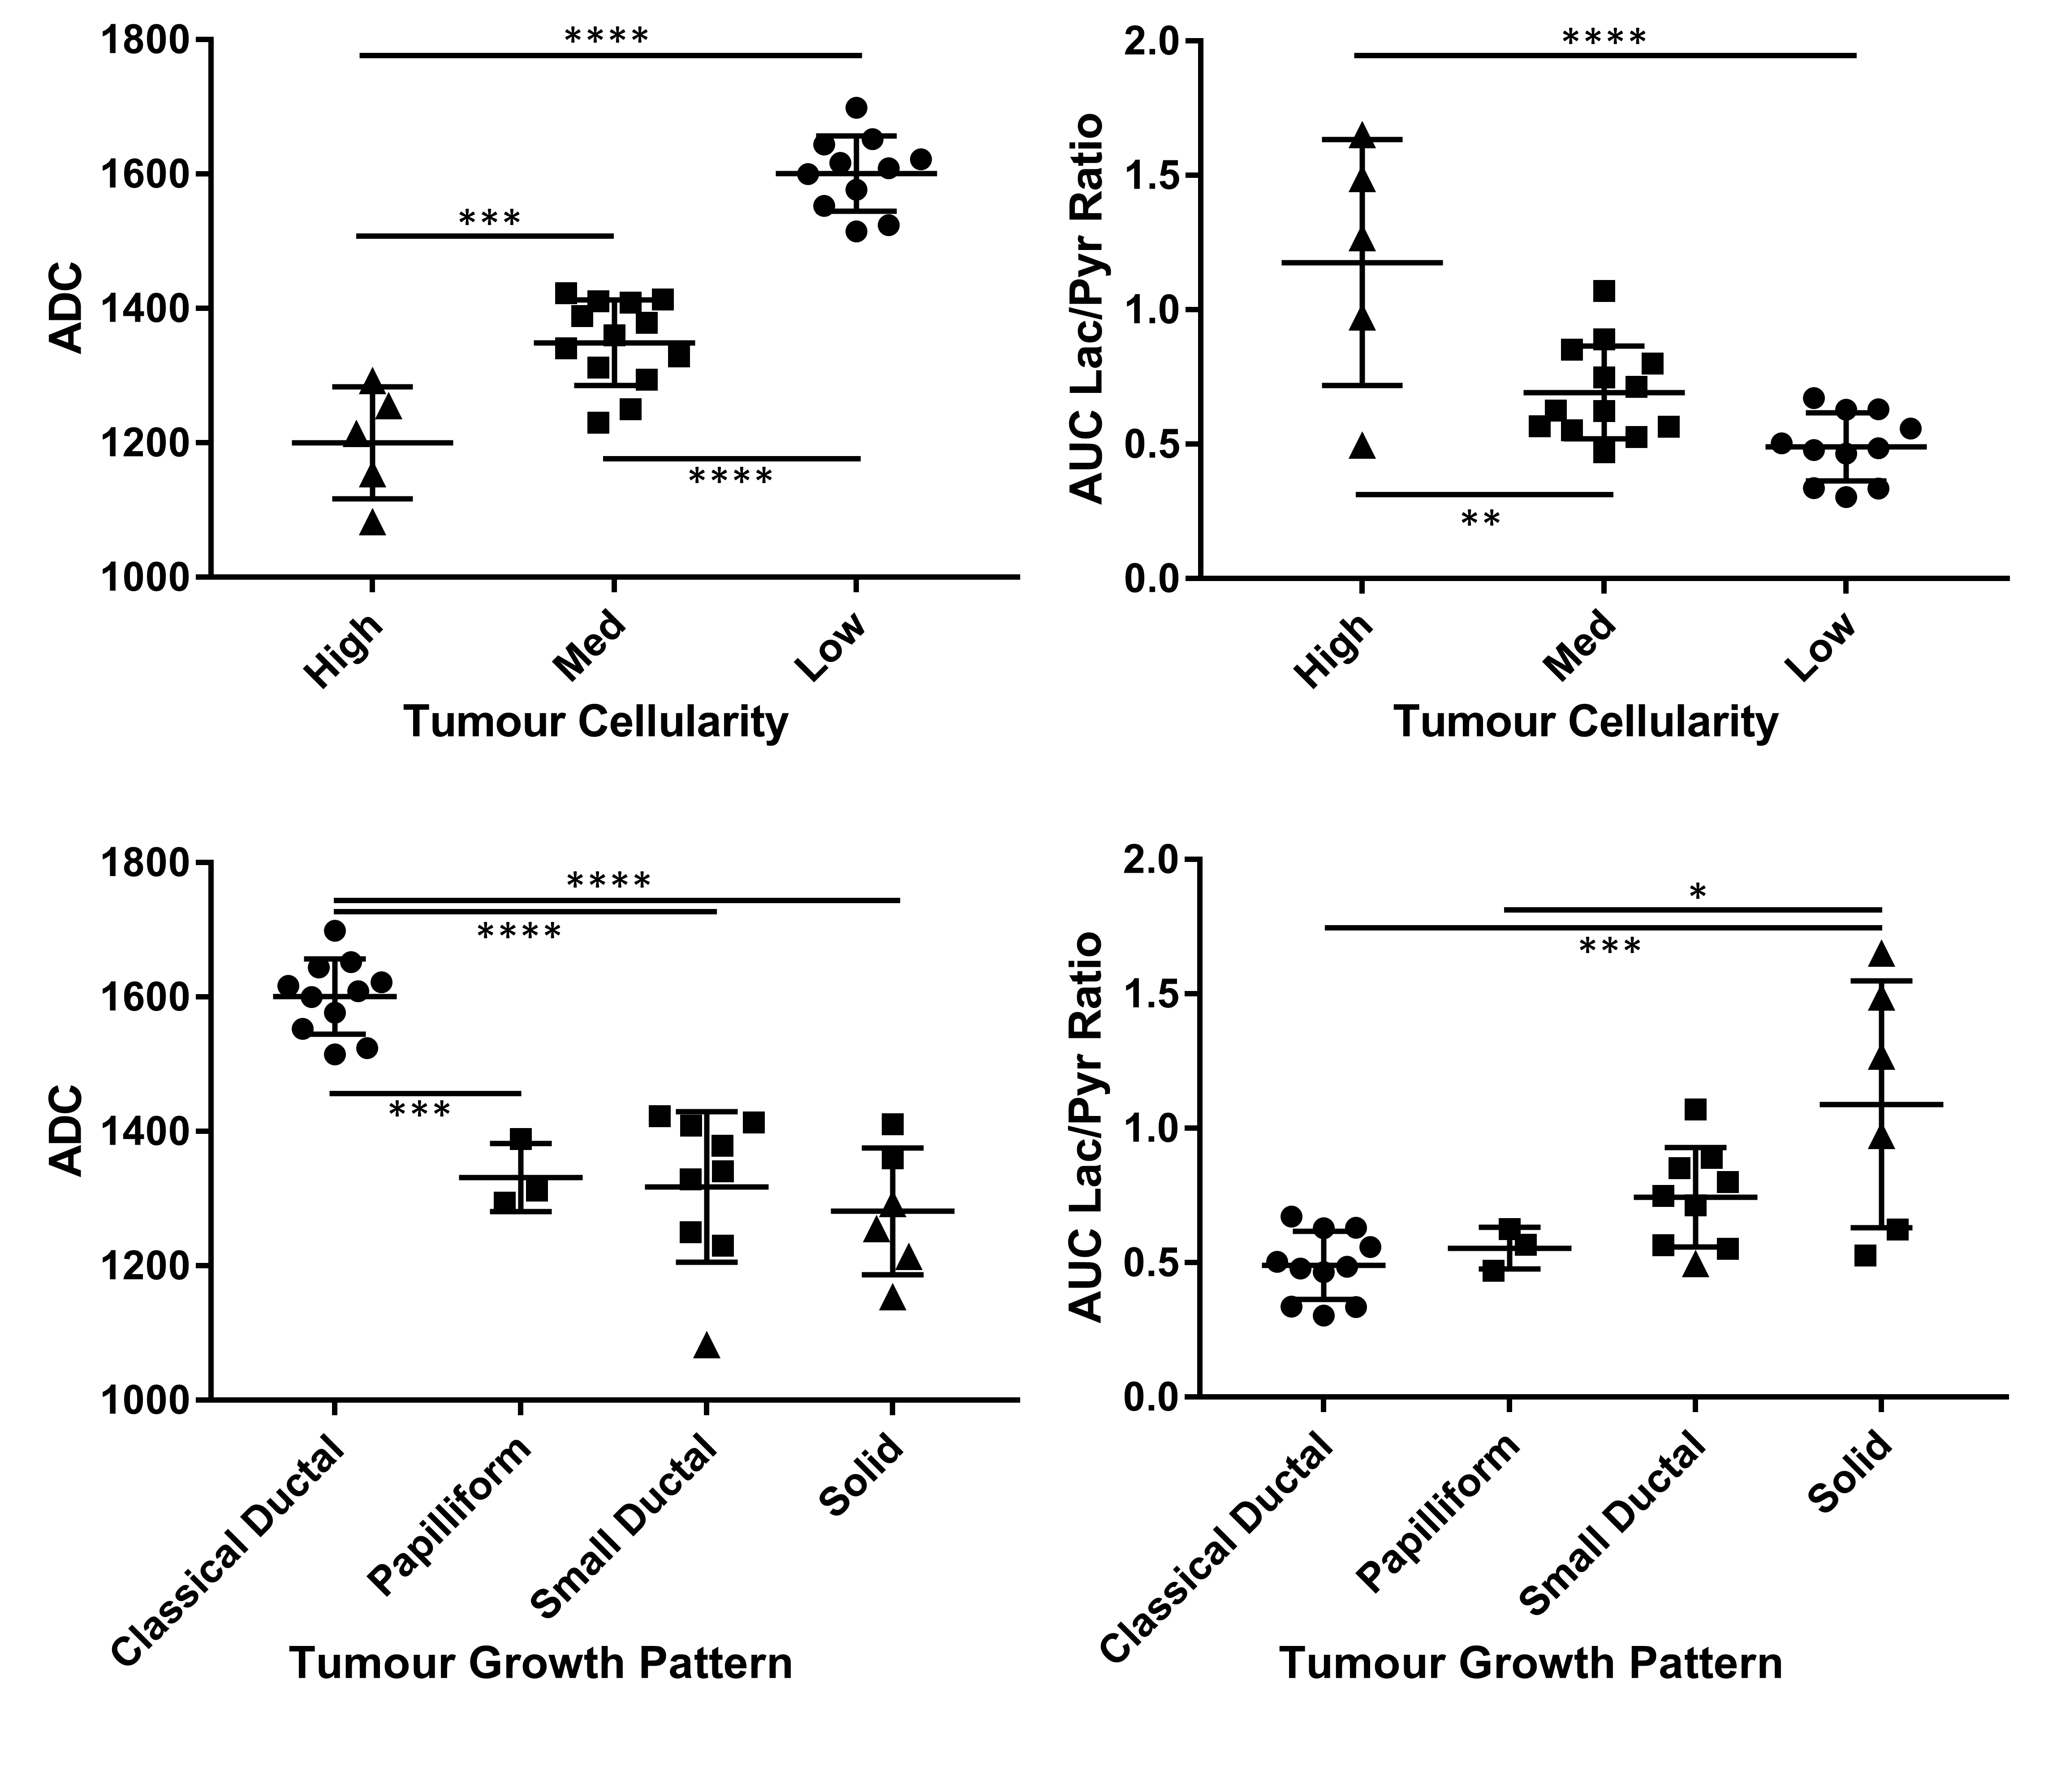
ADC and AUCr values grouped by tumour cellularity and growth pattern and compared with ANOVA or t‑tests are shown in Figure 4. Considering all tumours, ADC was separated well by tumour cellularity, and between classical ductal and papilliform, small ductal, or solid tumours, but not between the latter three. AUCr was separated between high and med or high and low tumour cellularity, between solid and classical ductal, and marginally between solid and papilliform, but not between other pairs.
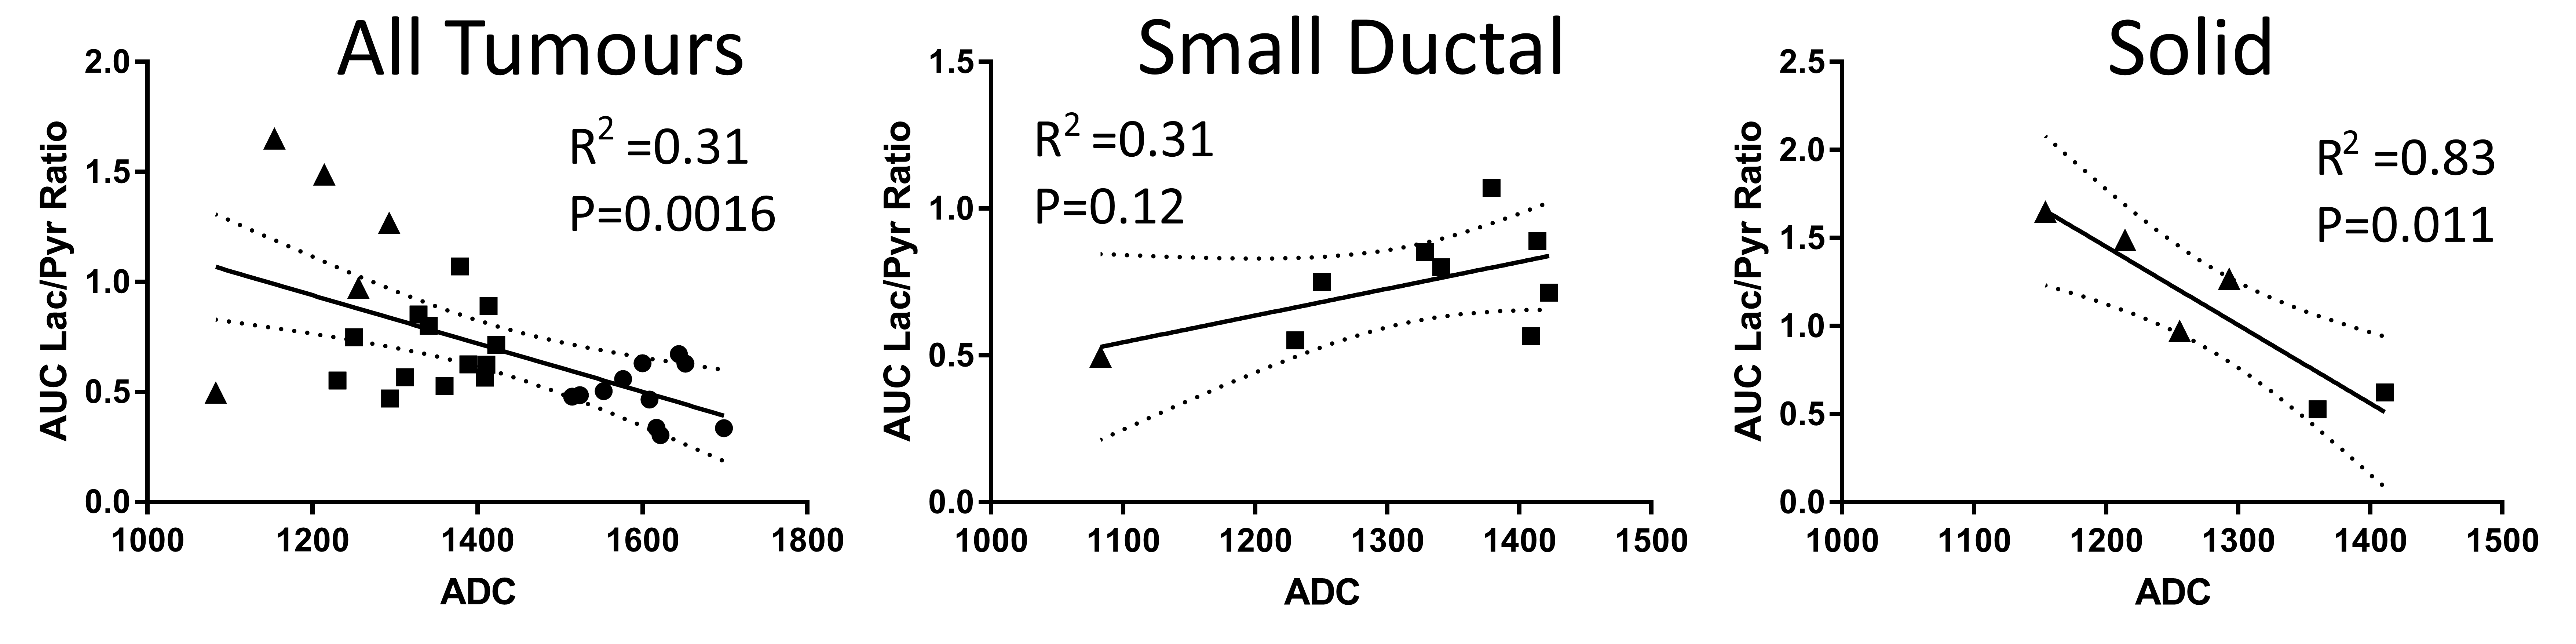
Endogenous tumour ADC and AUCr values are also correlated (Fig. 5). Plotting separately the small ductal and solid tumour data (those with substantial variation within the growth pattern group in Fig. 4) shows correlation within the solid tumour group as well.
Discussion
These results indicate that mesenchymal tumors rely more on glucose metabolism than do epithelial tumours. The positive correlation of SUVmean and AUCr in orthotopically implanted tumours suggests that these methods provide similar information about tumour glucose metabolism. The variation of AUCr (and SUVmean) indicate that 13C metabolic imaging has potential to distinguish between tumours of similar cellular density.Combined DWI and hyperpolarized 13C CSI differentiates between endogenous PDAC tumours of different tumour cellularity and growth pattern classification. Classical ductal tumours have distinctly low AUCr and higher ADC, while solid and small ductal tumours have low ADC and may have high AUCr. Particularly within solid tumours, ADC and AUCr are inversely correlated, suggesting combined DWI and 13C metabolic imaging may help correct metabolic results for variations in tumour cellularity.
Not all tumour types observed could be separated with ADC and AUCr; papilliform and small ductal tumours had similar presentation, and may require additional or alternative biomarkers to identify.
PET imaging was omitted for endogenous tumours in part because the orthotopic results were highly correlated, indicating minimal additional benefit to acquiring both modalities.
Conclusions
Mesenchymal tumors strongly rely on glucose metabolism in comparison with epithelial tumors. The combination of diffusion-weighted and 13C-pyruvate-lactate spectroscopic imaging can characterize endogenous mouse pancreatic tumours better than either method alone. Classical ductal tumours are well separated from others by their high ADC and low lactate to pyruvate AUC ratio. Solid tumours have an inverse correlation between ADC and AUC ratio, suggesting the combination of these imaging methods can be used to correct metabolic results for cell density.Acknowledgements
We acknowledge support from the Deutsche Forschungsgemeinschaft (DFG, German Research Foundation – 391523415, SFB 824).
Sybille Reder and Markus Mittelhäuser performed PET measurements.
Iryna Skuratovska processed tissues for histology.
References
1. Schlitter AM, Segler A, Steiger K, Michalski CW, Jäger C, Konukiewitz B, Pfarr N, Endris V, Bettstetter M, Kong B, Regel I, Kleeff J, Klöppel G, Esposito I. (2017) Molecular, morphological and survival analysis of 177 resected pancreatic ductal adenocarcinomas (PDACs): Identification of prognostic subtypes. Scientific Reports 7:41064
2. Heid I, Steiger K, Trajkovic-Arsic M, Settles M, Eßwein MR, Erkan M, Kleeff J, Jäger C, Friess H, Haller B, Steingötter A, Schmid RM, Schwaiger M, Rummeny EJ, Esposito I, Siveke JT, Braren RF. (2017) Co-clinical Assessment of Tumor Cellularity in Pancreatic Cancer. Clinical Cancer Research 23(6):1461-1470
Figures