0131
Metabolomic Characterization of Human Prostate Cancer with Tissue from MRI/US Fusion Biopsy
Leo L Cheng1, Lindsey Vandergrift1, Andrew Gusev1, Shulin Wu1, Mukesh Harisinghani1, Chin-Lee Wu1, and Adam Feldman1
1MGH/Harvard, Boston, MA, United States
1MGH/Harvard, Boston, MA, United States
Synopsis
Prostate cancer (PCa) clinic is challenged by heterogeneously distributed and clinical insignificant diseases. Multiparametric (mp)-MRI, with a PI-RADS score, correlated to clinically significant cancer and its morphological variations to establish a biopsy Target, and ultrasound fusion-guided biopsy guided to the targeted area has increased detection of clinically significant cancer. We studied PI-RADS score according to tissue MRS-based metabolomics. Metabolic differences between Target and contralateral cores, regardless if Targets were Ca-positive or not, support the assumption that targeted areas fundamentally and metabolomically differ from non-targeted areas.
Introduction
Prostate cancer (PCa) is the most frequently diagnosed male malignancy in the US1, and the second most common cause of cancer-related death2. However, clinical insignificance of many prostate cancer lesions challenges diagnosis and disease management. Introduction of the multi-parameter (mp)-MRI with Prostate Imaging Reporting and Data System (PI-RADS) score/ultrasound fusion-guided biopsy increased the cancer detection rate from 18 to 41%3, and also improved detection of clinically significant PCa4,5. During the biopsy, the MRI image is overlaid with the live ultrasound image to guide biopsy from the targeted area (Figure 1). PI-RADS score has been correlated with clinical significance of cancer and both morphological4-6 and microscopic variations in PCa lesions7. Here, we investigated PCa MRS-based metabolomics for tissue cores obtained from fusion biopsy.Methods
Mp-MRI/TRUS fusion biopsy cores. Patients who have suspicion for PCa underwent mp-MRI/ultrasound fusion biopsy. Three or four biopsy cores were taken from the target, followed by the traditional 12-core template biopsies. Seventy-three consecutive patients were included in the study. Among them, seven cases were excluded due to poor spectral qualities. For each case, one core from the target (T) and one non-targeted core from the contralateral side of the target (C) underwent spectroscopic analysis. MR Spectroscopy. Both cores were analyzed by high-resolution magic angle spinning MRS on a Bruker 600MHz spectrometer, at 4ºC with a rotor-synchronized Min(A,B) protocol with spinning at 600 and 700Hz8. Spectra were processed with curve fitting and transformed into statistical matrices using a MatLab-based program. Metabolic spectral regions (n=35, normalized by creatine peak at 3.03ppm) with >85% of samples presenting detectable values were analyzed. Principal components (PC) were calculated using these 35 regions. Histopathology. Following MRS, volume percentage (vol%) of histological features (epithelia, cancer, stroma) of biopsy cores were read by a pathologist. Tissue pathology calibration. Due to the pathology heterogeneity of each measured core, a least squares regression-overdetermined linear model was used to calibrate the intensities of spectral regions according to pathology variability and reported unless specified otherwise. All significant p-value for spectral regions and PCs reported were results after False Discovery Rate (FDR) corrections.Results
Among 66 targets identified in 66 patients, 35 T-cores were positive for cancer pathology (Ca-positive), while 12 C-cores were also Ca-positive and among them 4 of their T-cores were Ca-negative. A higher PI-RADS score resulted in greater likelihood of detecting a Ca-positive Target core: among PI-RADS score 2 cores, 1 out of 3 was Ca-positive (1/3, 33%); score 3 (4/17, 24%); 4 (14/27, 52%) and 5 (16/19, 84%).Metabolomic Differences between Target and Contralateral Cores according to PI-RADS scores Figure 2 demonstrates that tissue metabolomic profiles represented by PC2 measured from T-cores can significantly differentiate among PI-RADS 3, 4, and 5 groups. Although results in this figure seemed to indicate the significance of Ca-positive samples in differentiating target from contralateral groups. Close examination of the PI-RADS 5 group after corrections for pathological variations presented significant differentiations between T and C groups that are independent from presence of Ca in the cores, as illustrated in by the radar plot, where T normalized by C for each region, in Figure 3, where 7 out of 35 (20%) regions presented significant differences between T- and C-core groups with 19 PI-RADS 5 cases in each group.
Observations of PCa Metabolomic Fields Data observed in Figure 3 indicate the existence of PCa metabolomic field effects, based on which tissue metabolomic values measured from histologically benign tissues, or from Ca-positive tissues but after corrections for the amount of Ca pathologies, resemble malignancy in correlation with patients’ clinical presentations. To further verify observation, we divided both T- and C-cores (n=132) into groups: 1) Ca-positive cores (n=47); Ca-negative cores but Ca was found to be positive in, 2) the same quadrant (n=15), or 3) the distant quadrant (n=39); 4) cores from patients who are still Ca-free (n=28); and 5) Ca-negative cores with locations to Ca un-certain (n=3). Multiple spectral regions can differentiate among these groups. Most interestingly, after corrections for the presented amounts of PCa pathologies, Figure 4 demonstrates the ability of phosphocholine (P-Chol) and glycerylphosphorylcholine (GPC) in differentiating among these groups. Furthermore, by analyzing histo-benign tissues (the above groups 2 and 3) alone, PCa prognostic grade group (PGG)9 1 and 2 (PGG1&2, n=45) can be significantly differentiated from those 3 and 4 (PGG3&4, n=10), as shown in Figure 5 for all significant regions, where the mean for PGG1&2 was normalized by those of PGG3&4.
Discussion and Conclusion
Our results demonstrating improved PCa detection with fusion biopsy procedure when compared with that of random biopsy agreed well with literature. Advanced from the current literature data, our results demonstrated the intrinsic metabolomic foundations that may explain the observation and identification of these MRI targets. Such metabolomic identifications are more evident with lesions of high PI-RADS scores than those with lower ones. These metabolomic differentiations may extend beyond the histological definitions of PCa lesions to create PCa metabolomic fields that may advance in vivo imaging for PCa detection and characterization through the enlarged PCa metabolomic lesions. With metabolic evidence, these results support the fusion biopsy assumption that targeted areas are fundamentally different from non-targeted areas.Acknowledgements
We acknowledge and thank NIH grant CA115746 and the A. A. Martinos Center for Biomedical Imaging.References
1 Prostate Cancer Statistics, 2017). 2 Jemal, A. et al. Cancer statistics, 2009. CA: a cancer journal for clinicians 59, 225-249, doi:caac.20006 [pii] 10.3322/(2009). 3 Hoeks, C. M. et al. Prostate cancer: multiparametric MR imaging for detection, localization, and staging. Radiology 261, 46-66, doi:10.1148/radiol.11091822 (2011). 4 Pinto, P. A. et al. Magnetic resonance imaging/ultrasound fusion guided prostate biopsy improves cancer detection following transrectal ultrasound biopsy and correlates with multiparametric magnetic resonance imaging. J Urol 186, 1281-1285, doi:10.1016/j.juro.2011.05.078 (2011). 5 De Visschere, P. J. et al. Role of multiparametric magnetic resonance imaging in early detection of prostate cancer. Insights into imaging 7, 205-214, doi:10.1007/s13244-016-0466-9 (2016). 6 Dianat, S. S. et al. Association of quantitative magnetic resonance imaging parameters with histological findings from MRI/ultrasound fusion prostate biopsy. The Canadian journal of urology 22, 7965-7972 (2015). 7 Faiella, E. et al. Analysis of histological findings obtained combining US/mp-MRI fusion-guided biopsies with systematic US biopsies: mp-MRI role in prostate cancer detection and false negative. La Radiologia medica, doi:10.1007/s11547-017-0814-y (2017). 8 Burns, M. A. et al. Reduction of spinning sidebands in proton NMR of human prostate tissue with slow high-resolution magic angle spinning. Magnetic resonance in medicine 54, 34-42 (2005). 9 Epstein, J. I. et al. The 2014 International Society of Urological Pathology (ISUP) Consensus Conference on Gleason Grading of Prostatic Carcinoma: Definition of Grading Patterns and Proposal for a New Grading System. The American journal of surgical pathology 40, 244-252, doi:10.1097/(2016).Figures
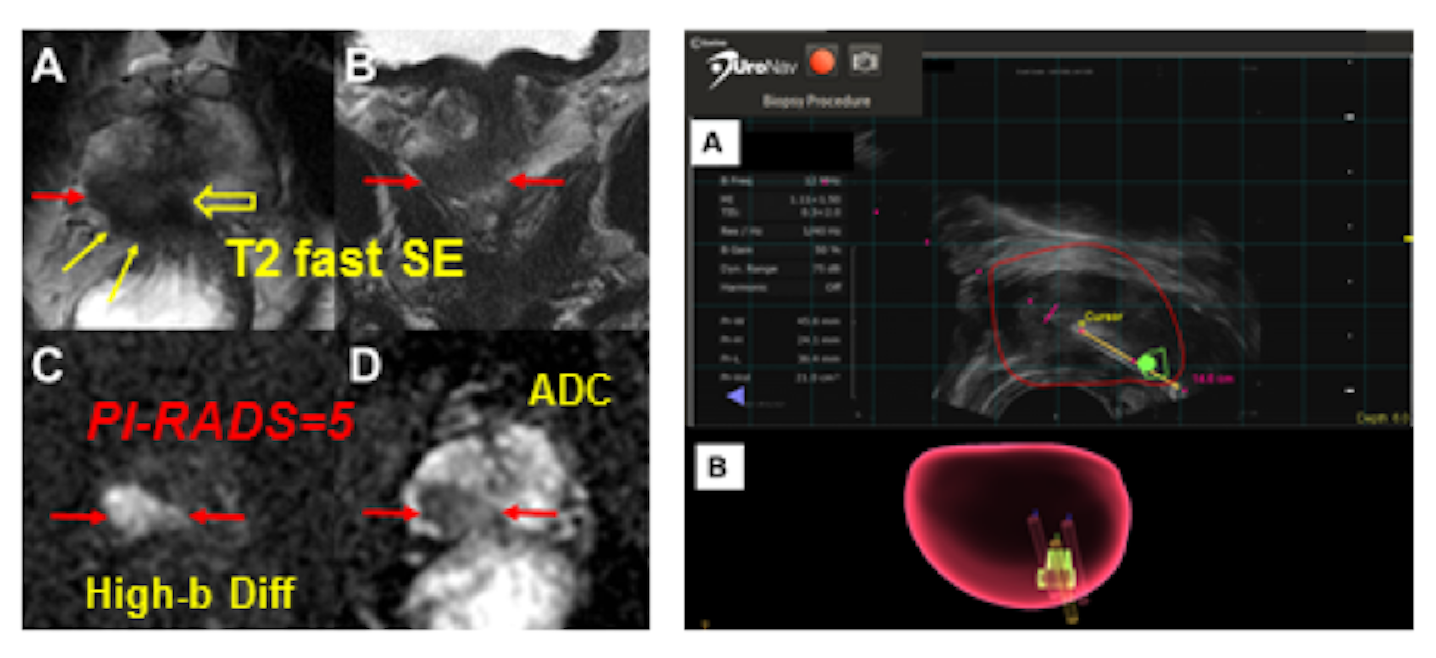
Figure 1. An
illustration of mpMRI/US fusion biopsy UroNav system interface. MRI (left) and
identified target region(s) are uploaded into the UroNav system (right), where
a urologist aligns the MRI with the live ultrasound image. (A) The red spheroid outlines the
prostate and is the result of the MRI-ultrasound image fusion. (B) Needle tracking during the procedure
maps the location from where each targeted biopsy was taken. Images are from a
74-year old man with GS 4+3 identified in the target.

Figure 2. Targets
differentiating PI-RADS 3, 4, and 5 groups. Tissue
metabolomic profiles represented by PC2 measured from T-cores can significantly
differentiate among PI-RADS 3, 4, and 5 groups, while such differentiations
diminished in the C-core groups, as well as by removing the Ca-positive cases
among the T-cores.
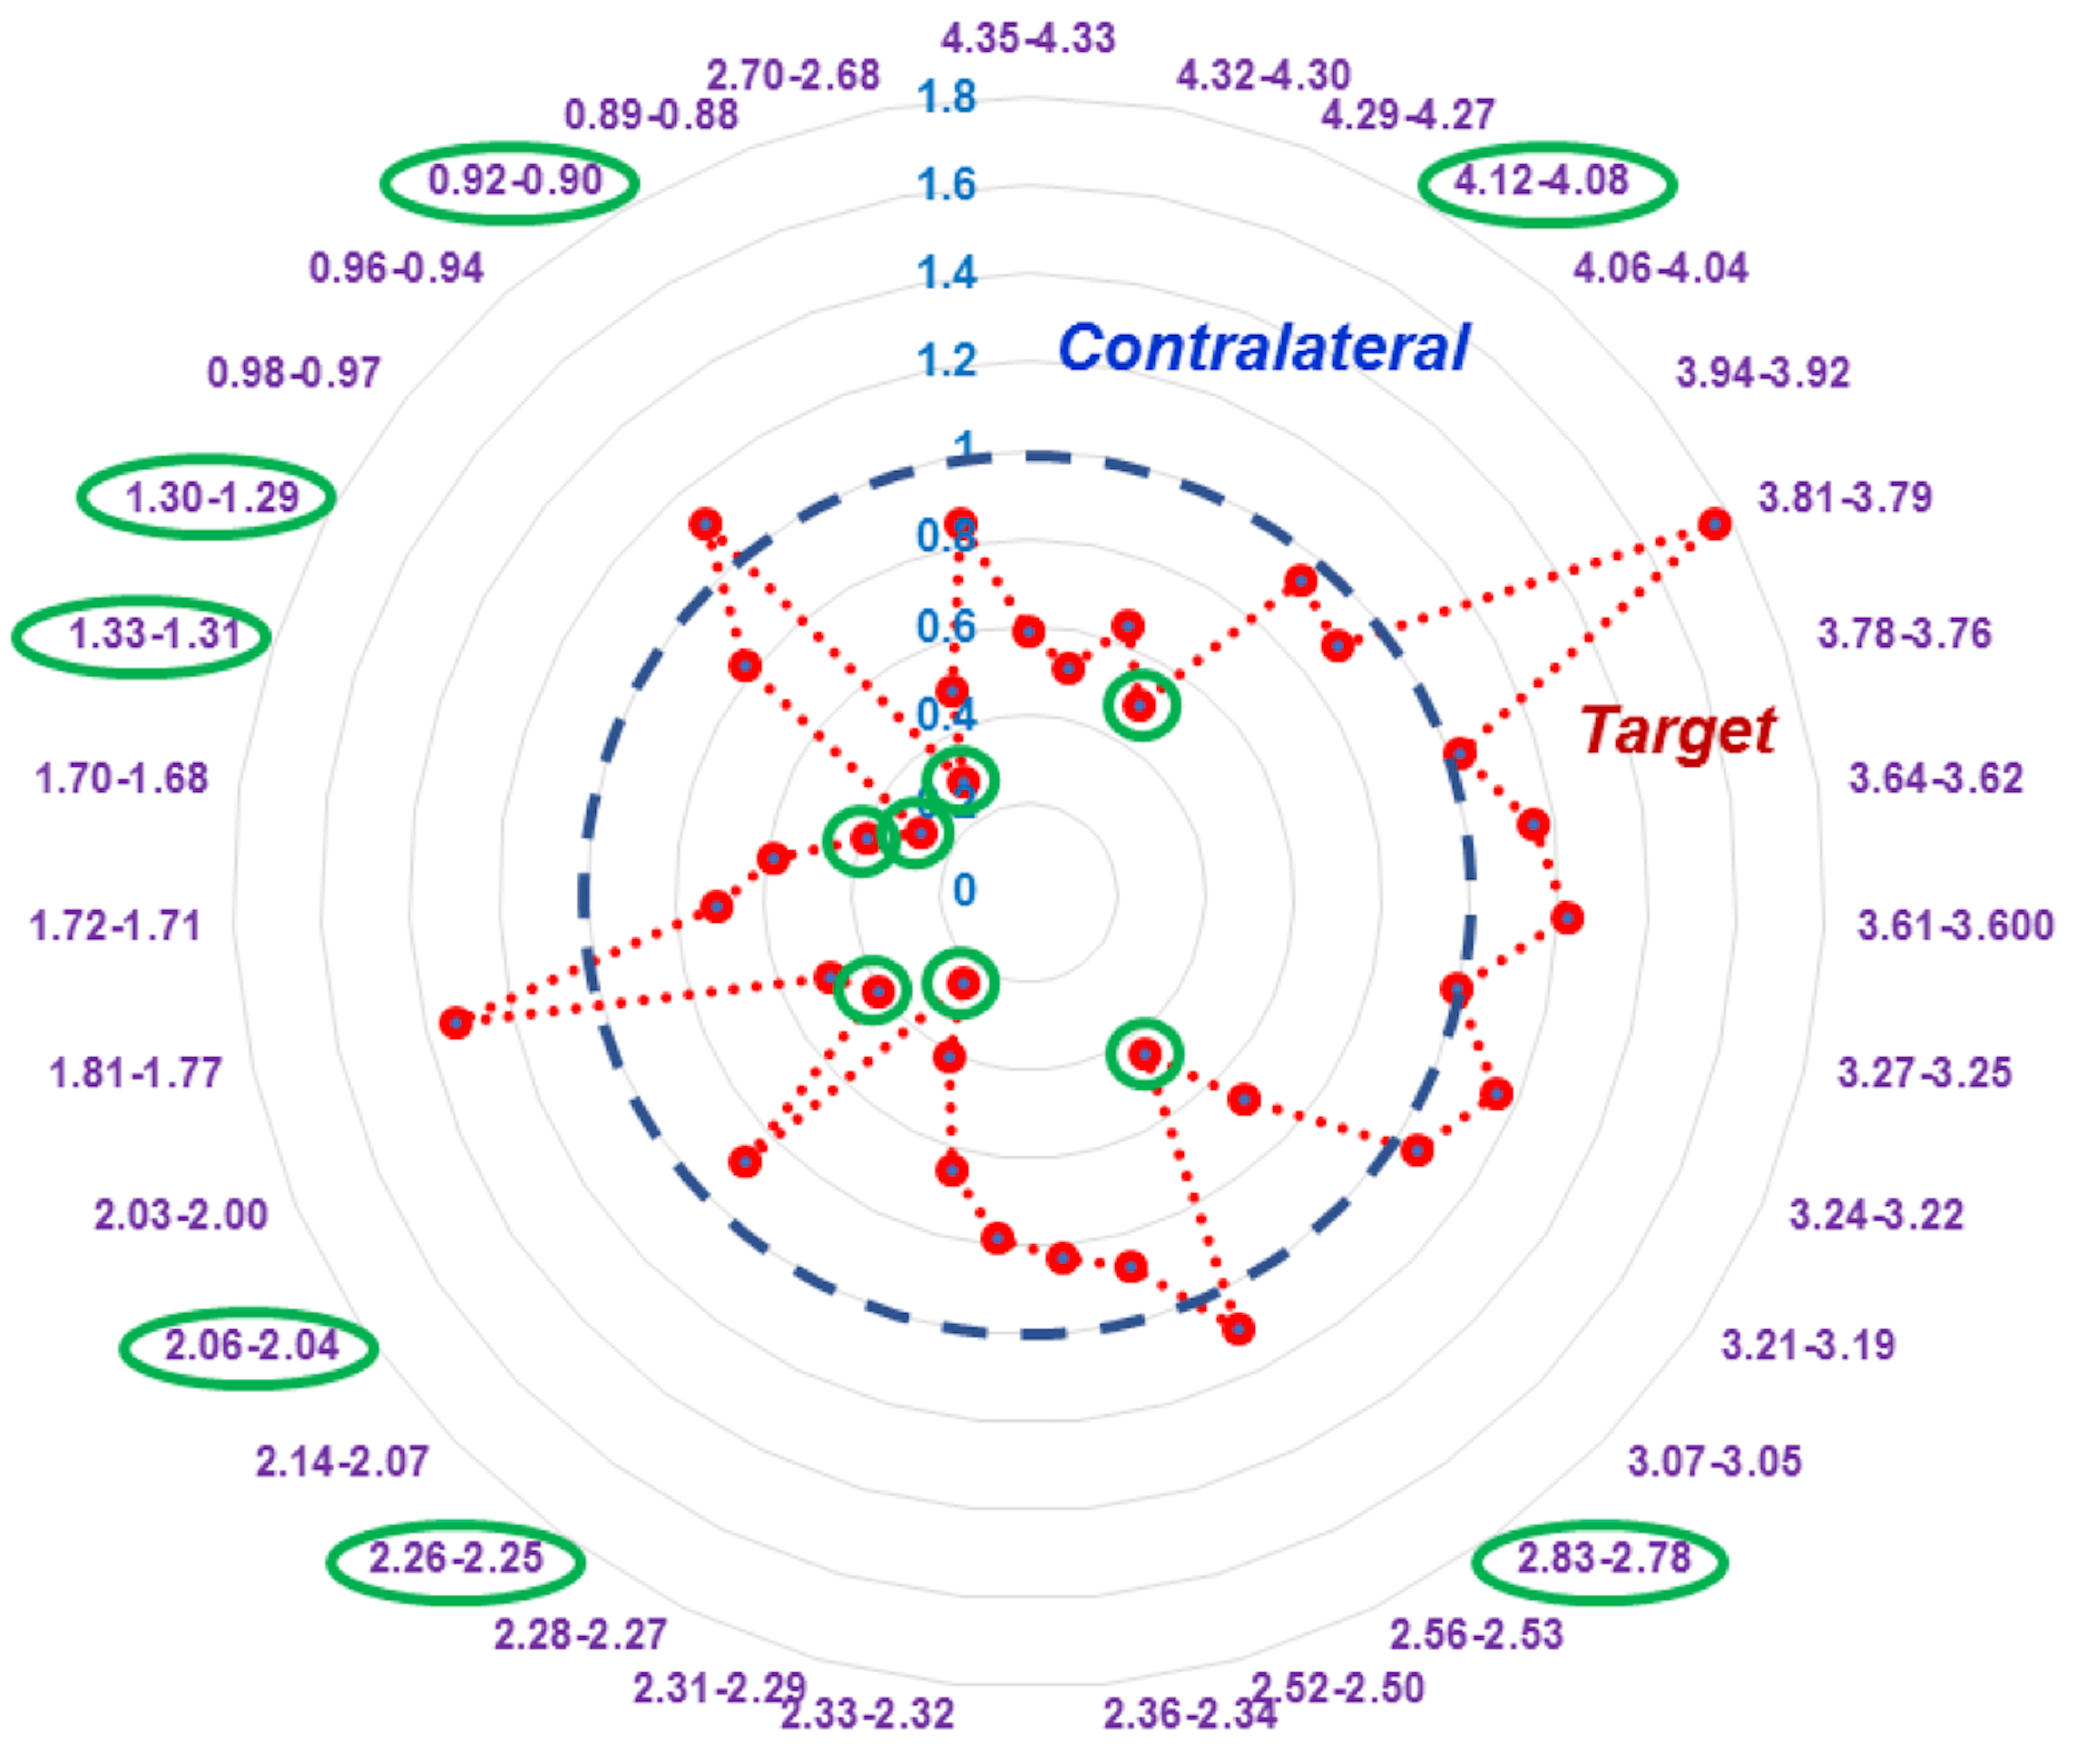
Figure 3. Differentiation between T- and C-core
groups for PI-RADS 5 cases. Seven out of 35 (20%) regions (green) can
significantly differentiate T- from C-core groups for 19 PI-RADS 5 cases.
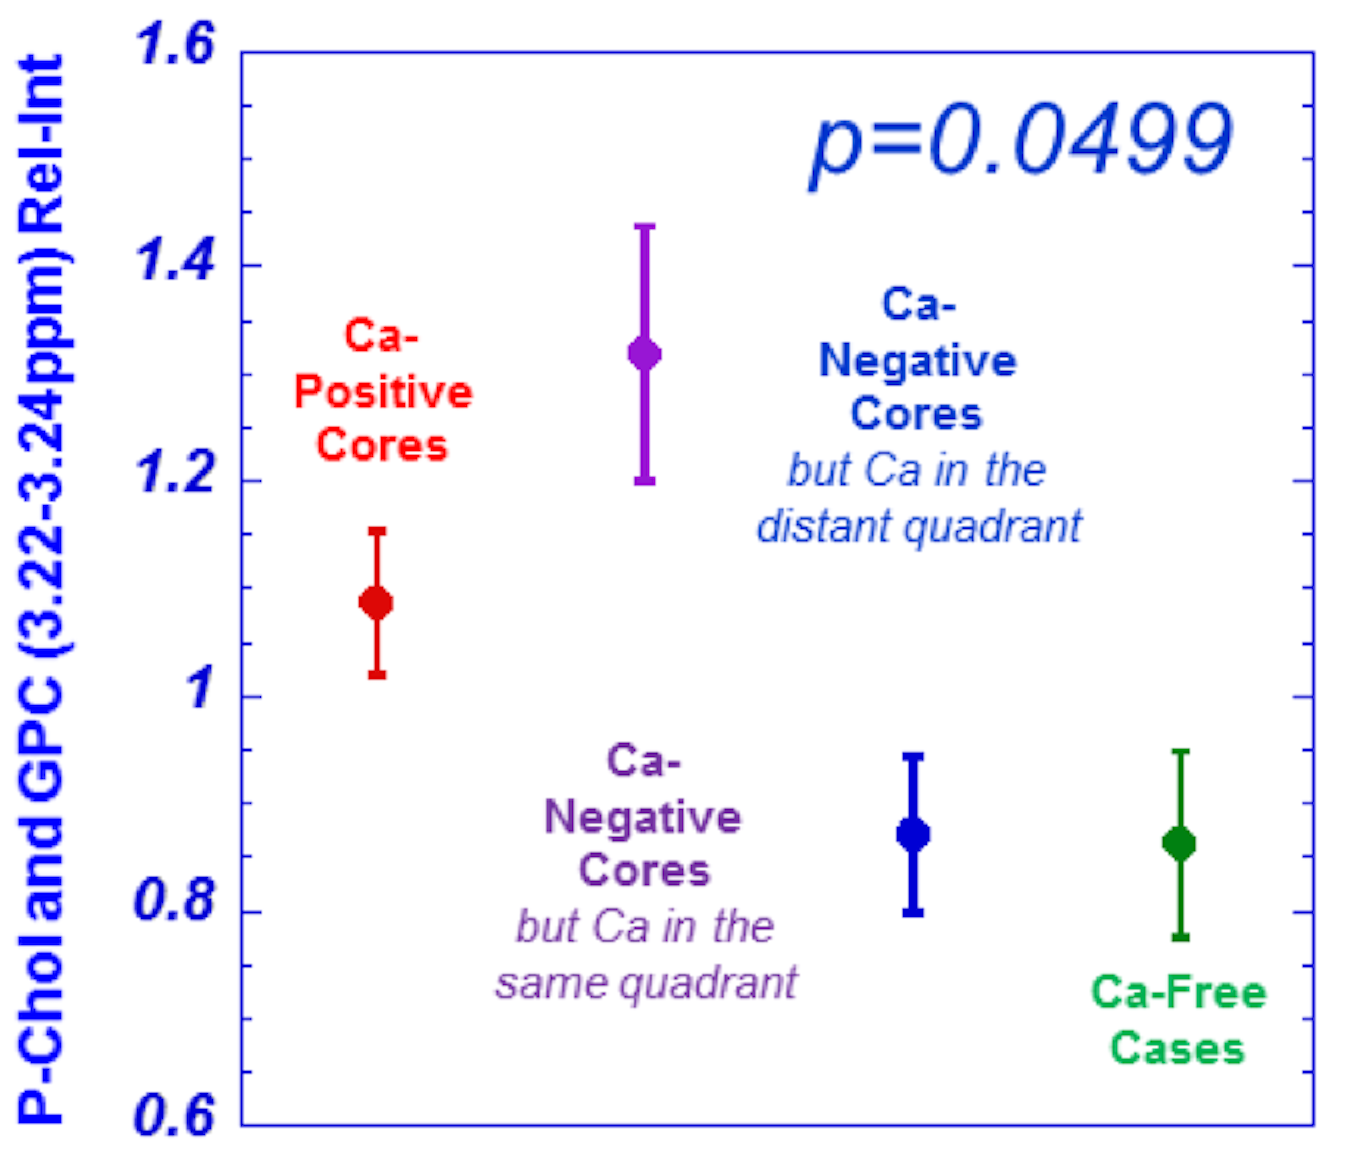
Figure 4. Phosphocholine (P-Chol) and glycerylphosphorylcholine
(GPC) differentiations among measured groups.
Statistically significant differentiations among the measured groups (detailed
in the text) by multiple regions were observed. An example from P-Chol and GPC
is given here.
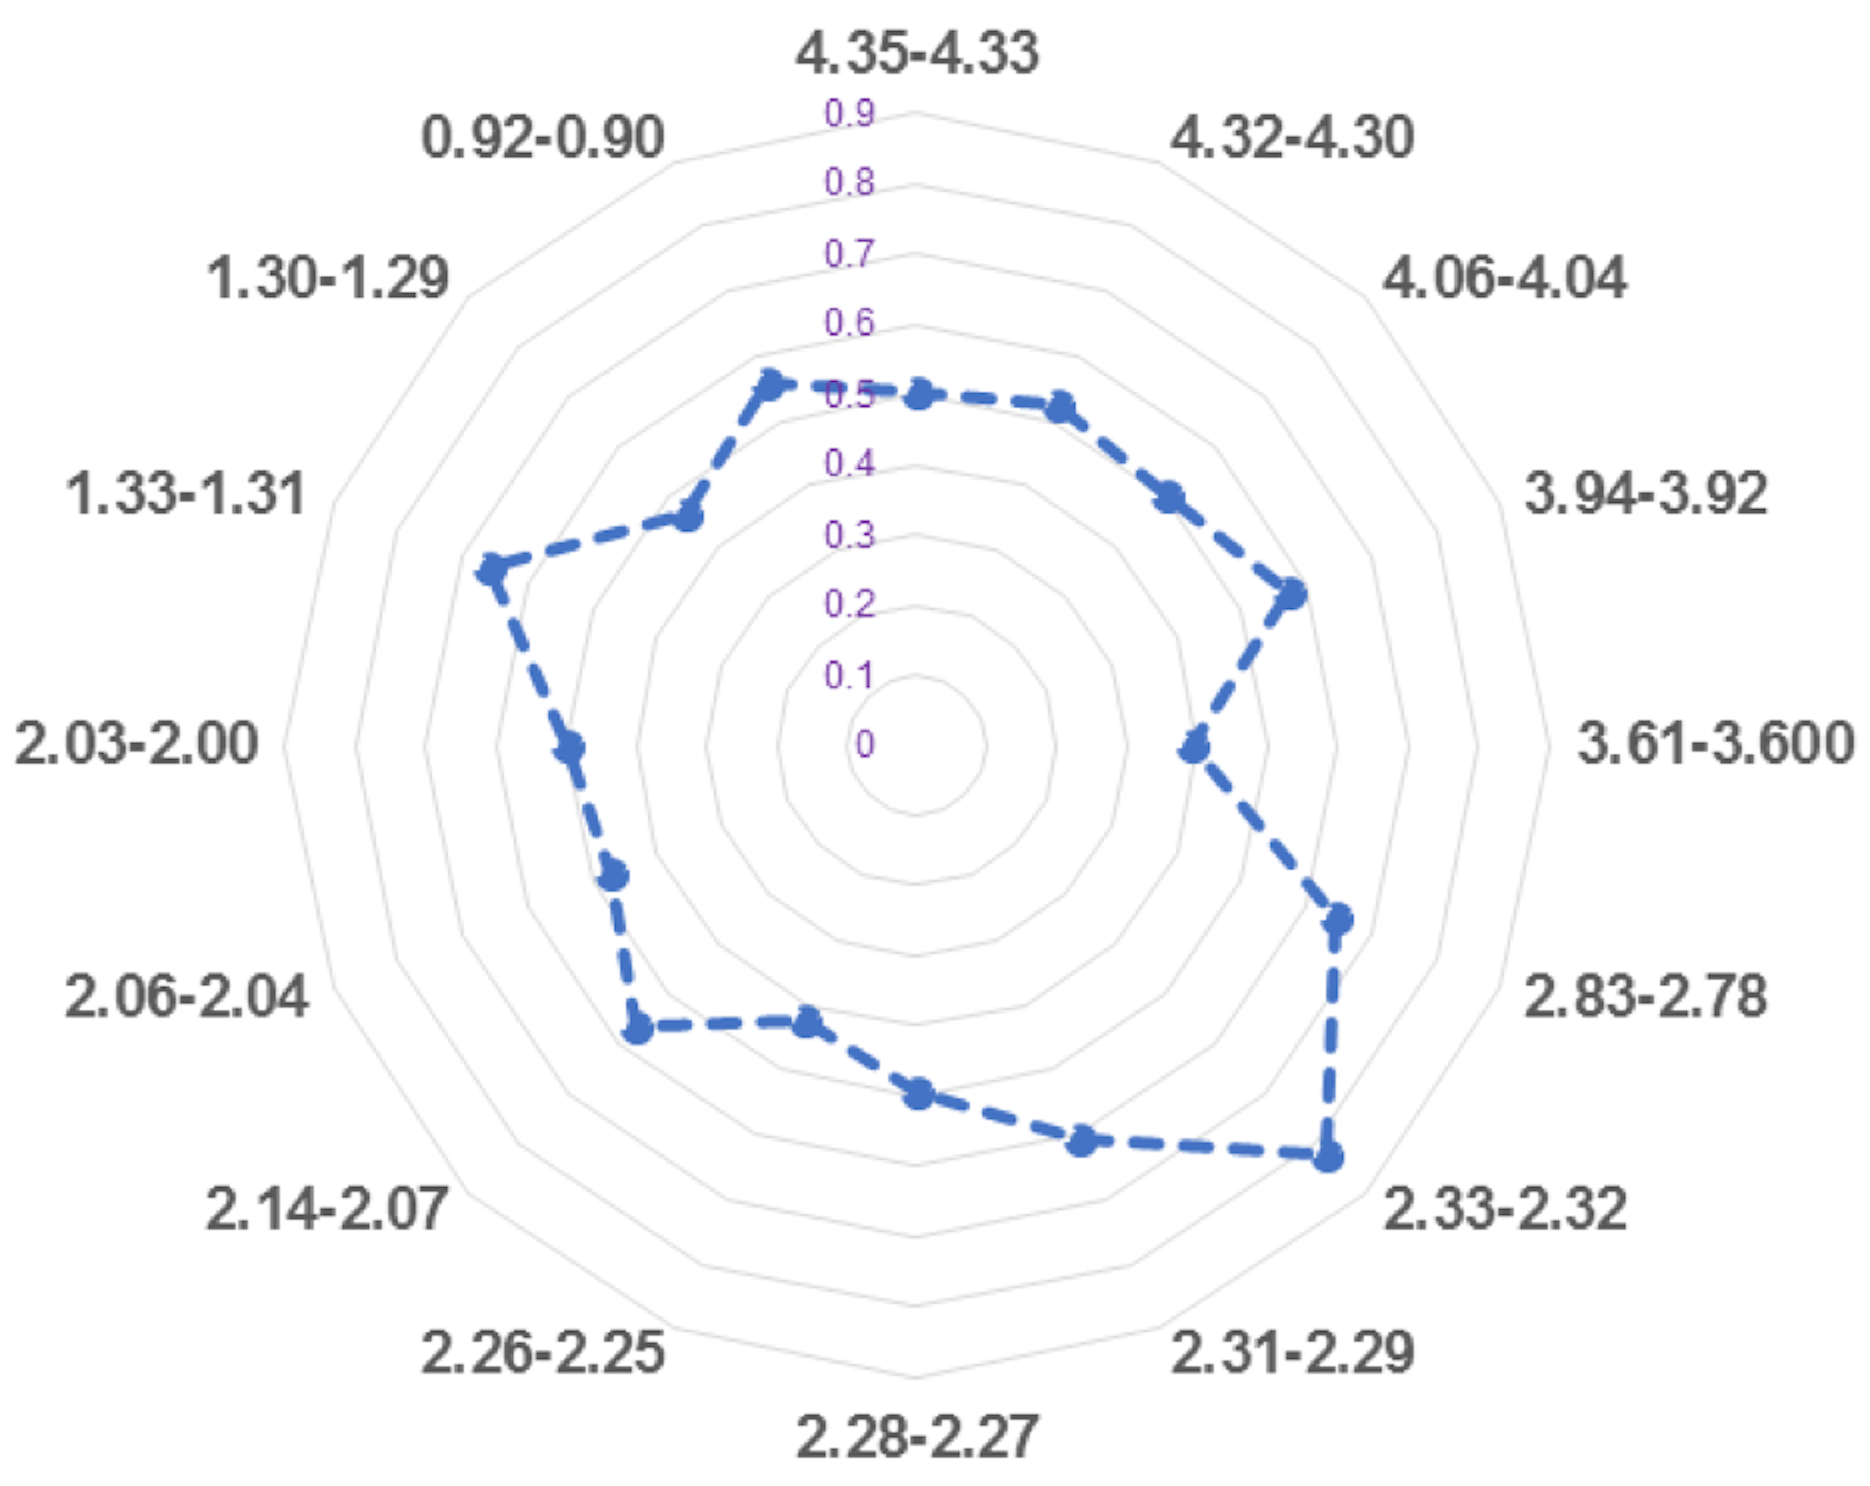
Figure 5. Metabolomic
profiles measured from histo-benign tissues of cancerous prostates can
differentiate among PGG groups. PGG1&2 can be significantly differentiated
from those of PGG3&4 with only significant regions presented in the plot.