0130
Hyperpolarized 13C-glucose MRS: a potential biosensor to visualize the infiltrative front in GBM1Laboratory for Functional and Metabolic Imaging (LIFMET), Ecole Polytechnique Fédérale de Lausanne (EPFL), Lausanne, Switzerland, 2Department of Clinical Neurosciences, Lausanne University Hospital and University of Lausanne, Lausanne, Switzerland, 3Centre d'Imagerie Biomédicale (CIBM), Ecole Polytechnique Fédérale de Lausanne (EPFL), Lausanne, Switzerland, 4General Electric Healthcare, Chalfont St Giles, United Kingdom, 5Department of Radiology, University of Geneva (UNIGE), Geneva, Switzerland, 6Department of Radiology, University of Lausanne (UNIL), Lausanne, Switzerland
Synopsis
Glioblastoma (GBM) is the most malignant primary brain tumor in adults. Aberrant glucose metabolism is considered a hallmark of cancer, via the so-called ‘Warburg Effect’, however recent studies show distinct metabolic profile associated with the invasive phenotype in GBM, indicating active glucose oxidation. Hyperpolarized (HP) endogenous compounds, provides real-time metabolic information which is related to enzymatic activity. The aim of the present study was to apply HP 13C-glucose MRS in patient-derived GBM models and to investigate glucose metabolism in the infiltrative front of GBM, which potentially would enable to differentiate the invasive front of GBM from normal brain.
INTRODUCTION:
Glioblastoma (GBM) is the most malignant primary brain tumor in adults; it exhibits high metabolic activity and is notorious for its resistance to multimodal therapy with a median survival of less than two years1. GBM is heterogeneous, compounded by a core lesion surrounded by an invasive tumor front, which is highly relevant for tumor recurrence2. While the central mass is detectable by T2-weighted MRI and highlighted in post-contrast T1-weighted images, the infiltrative front, composed by low density invading cells surviving in an intact blood-brain barrier (BBB) environment, is usually indiscernible and lies outside the resected and irradiated area.Metabolic imaging provides essential perspectives in the assessment of tissue function and disease3. The fate of glucose is one pathway of particular interest, as hyperactive glucose metabolism is considered a hallmark of cancer (Warburg Effect)4. However, recent ex vivo and in vivo studies showed evidence for distinct metabolic profiles associated with the invasive phenotype in GBM, indicating active glucose oxidation5-7. MR of hyperpolarized (HP) endogenous compounds8 provide real-time metabolic information9. In particular, MRI of HP [1-13C]pyruvate has been shown as a promising technique capable of providing metabolic information in clinical settings10,11 including brain tumor patients12-14.
A limitation of HP pyruvate experiments to interrogate glycolysis is that they probe specific portion of glucose metabolism. Real-time measurement of tumor glycolysis using HP 13C-glucose has been demonstrated in lymphoma mouse model15. The detection of cerebral de novo synthesis of [1-13C]lactate post HP 13C-glucose bolus was recently reported16. The aim of this study was to demonstrate the feasibility to monitor real-time metabolism of HP 13C-glucose in GBM mouse models, and to employ this technique to investigate glucose metabolism in the infiltrative front of GBM. We examined whether changes in the glucose metabolism can be characterized by the de novo lactate production, to evaluate the potential of HP 13C-glucose MRS to differentiate the invasive front of GBM from normal brain.
METHODS:
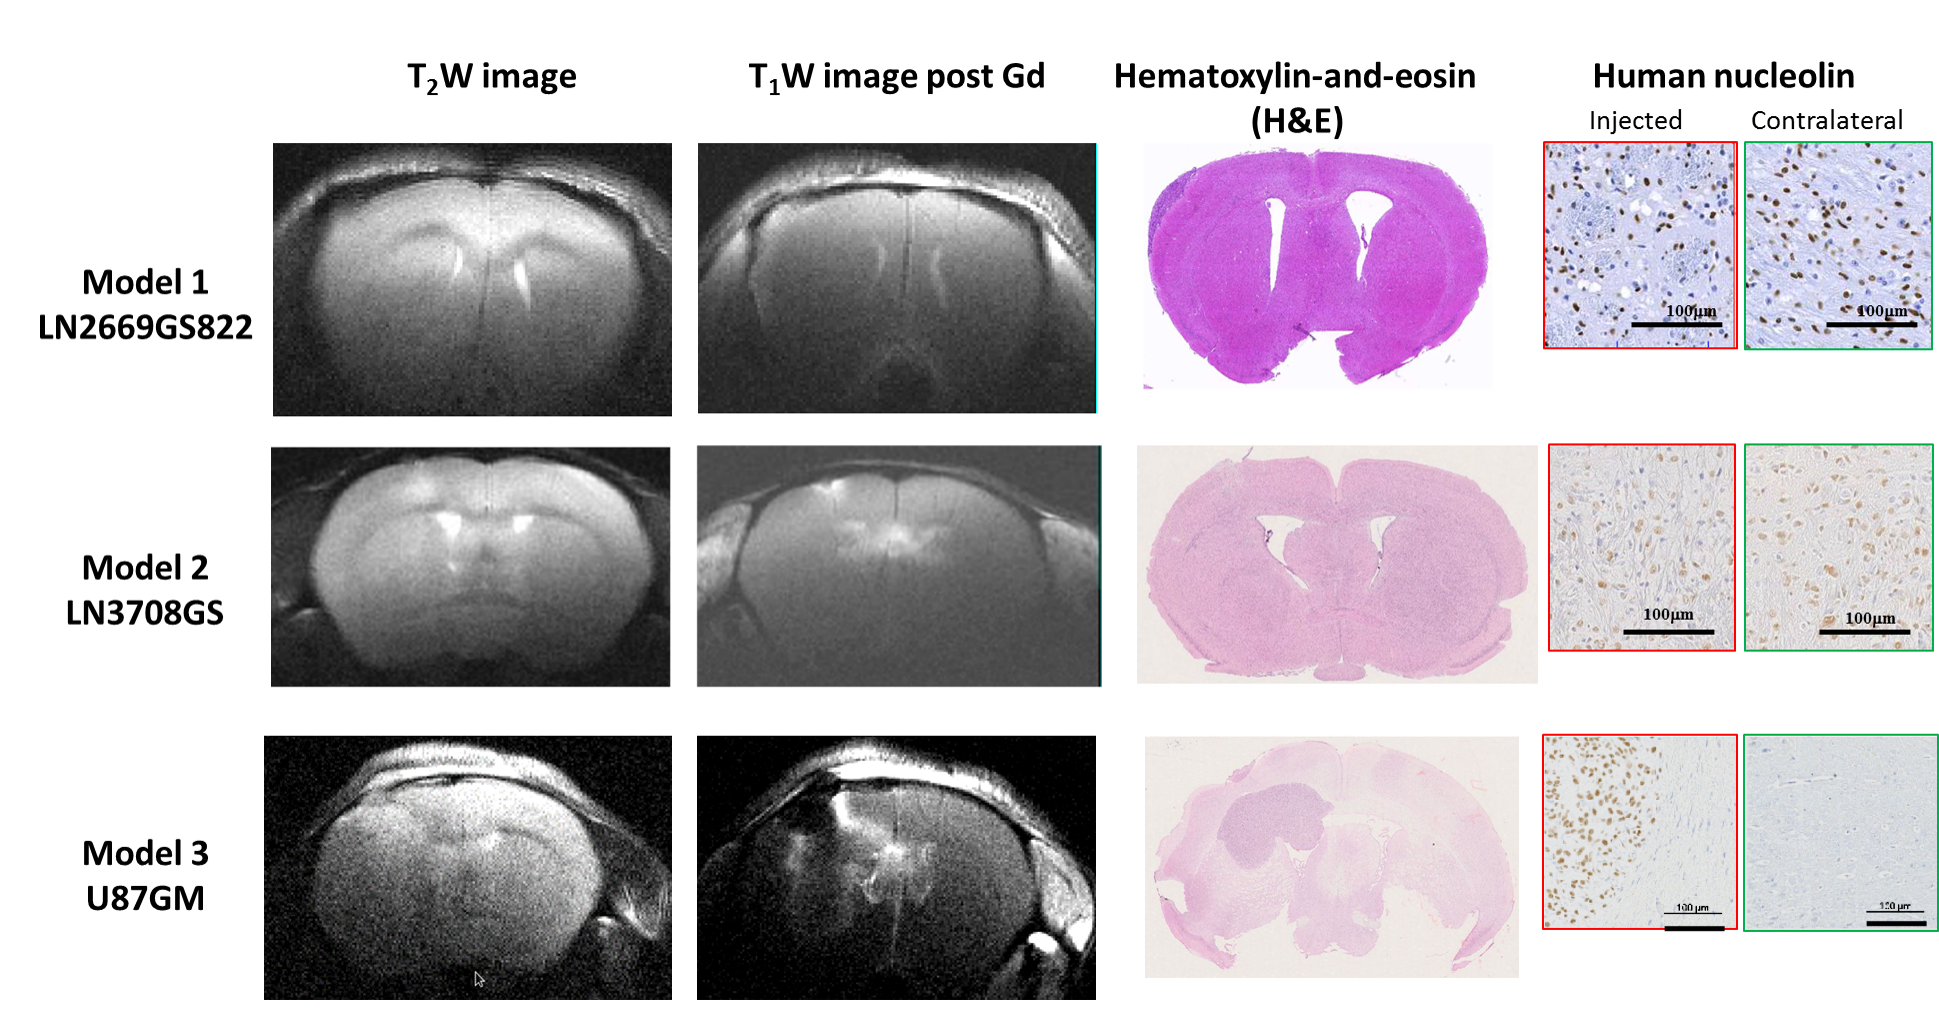
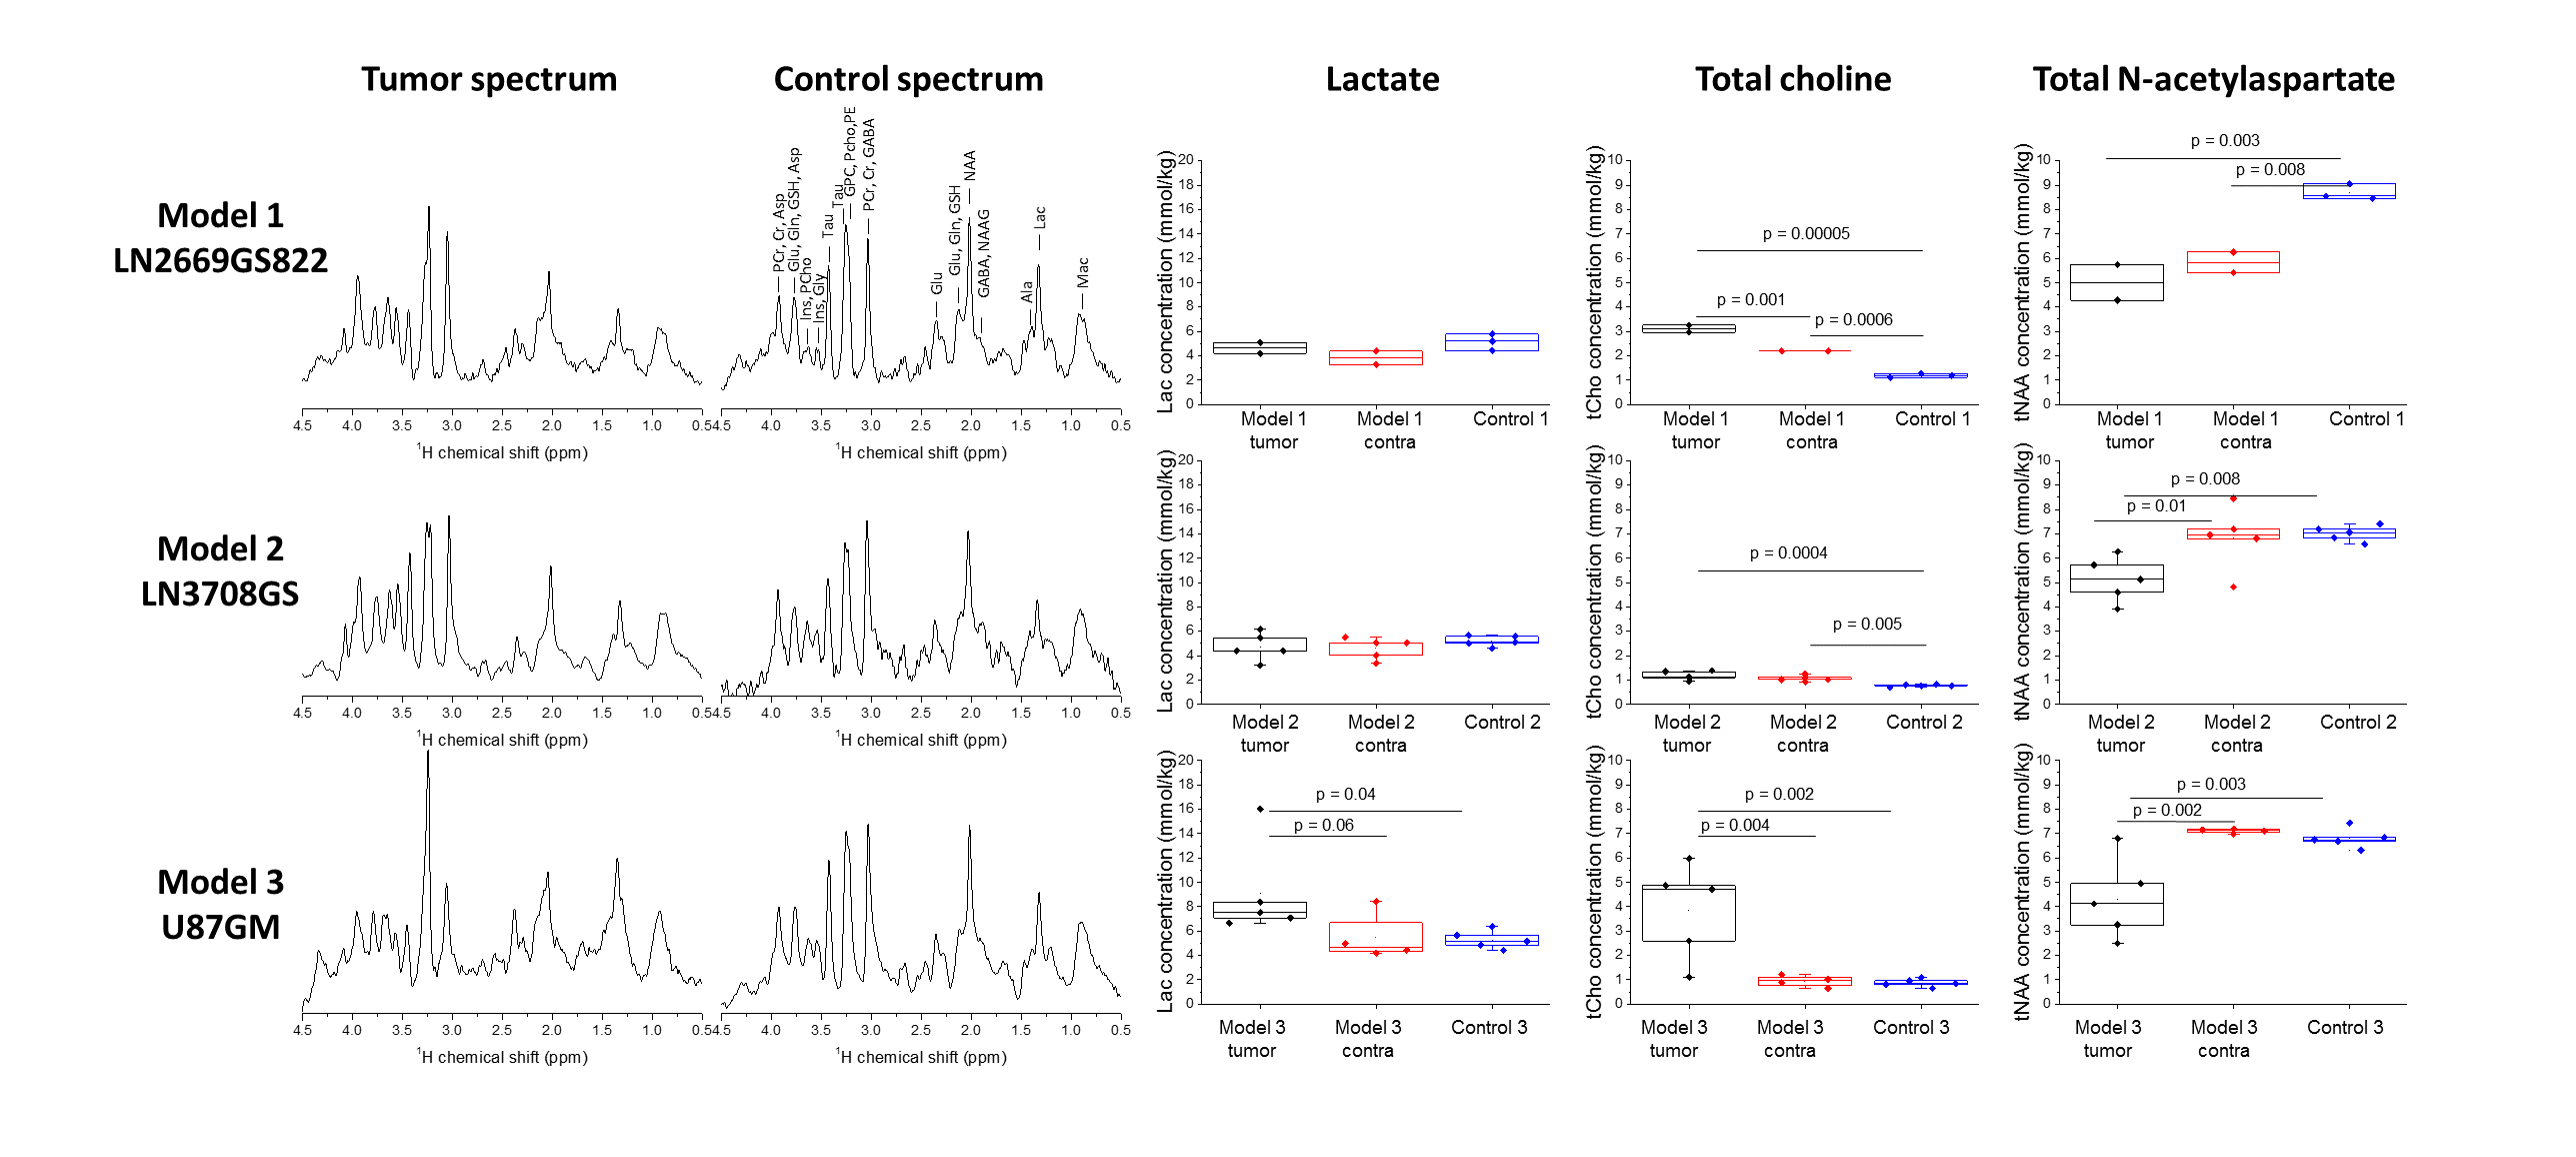
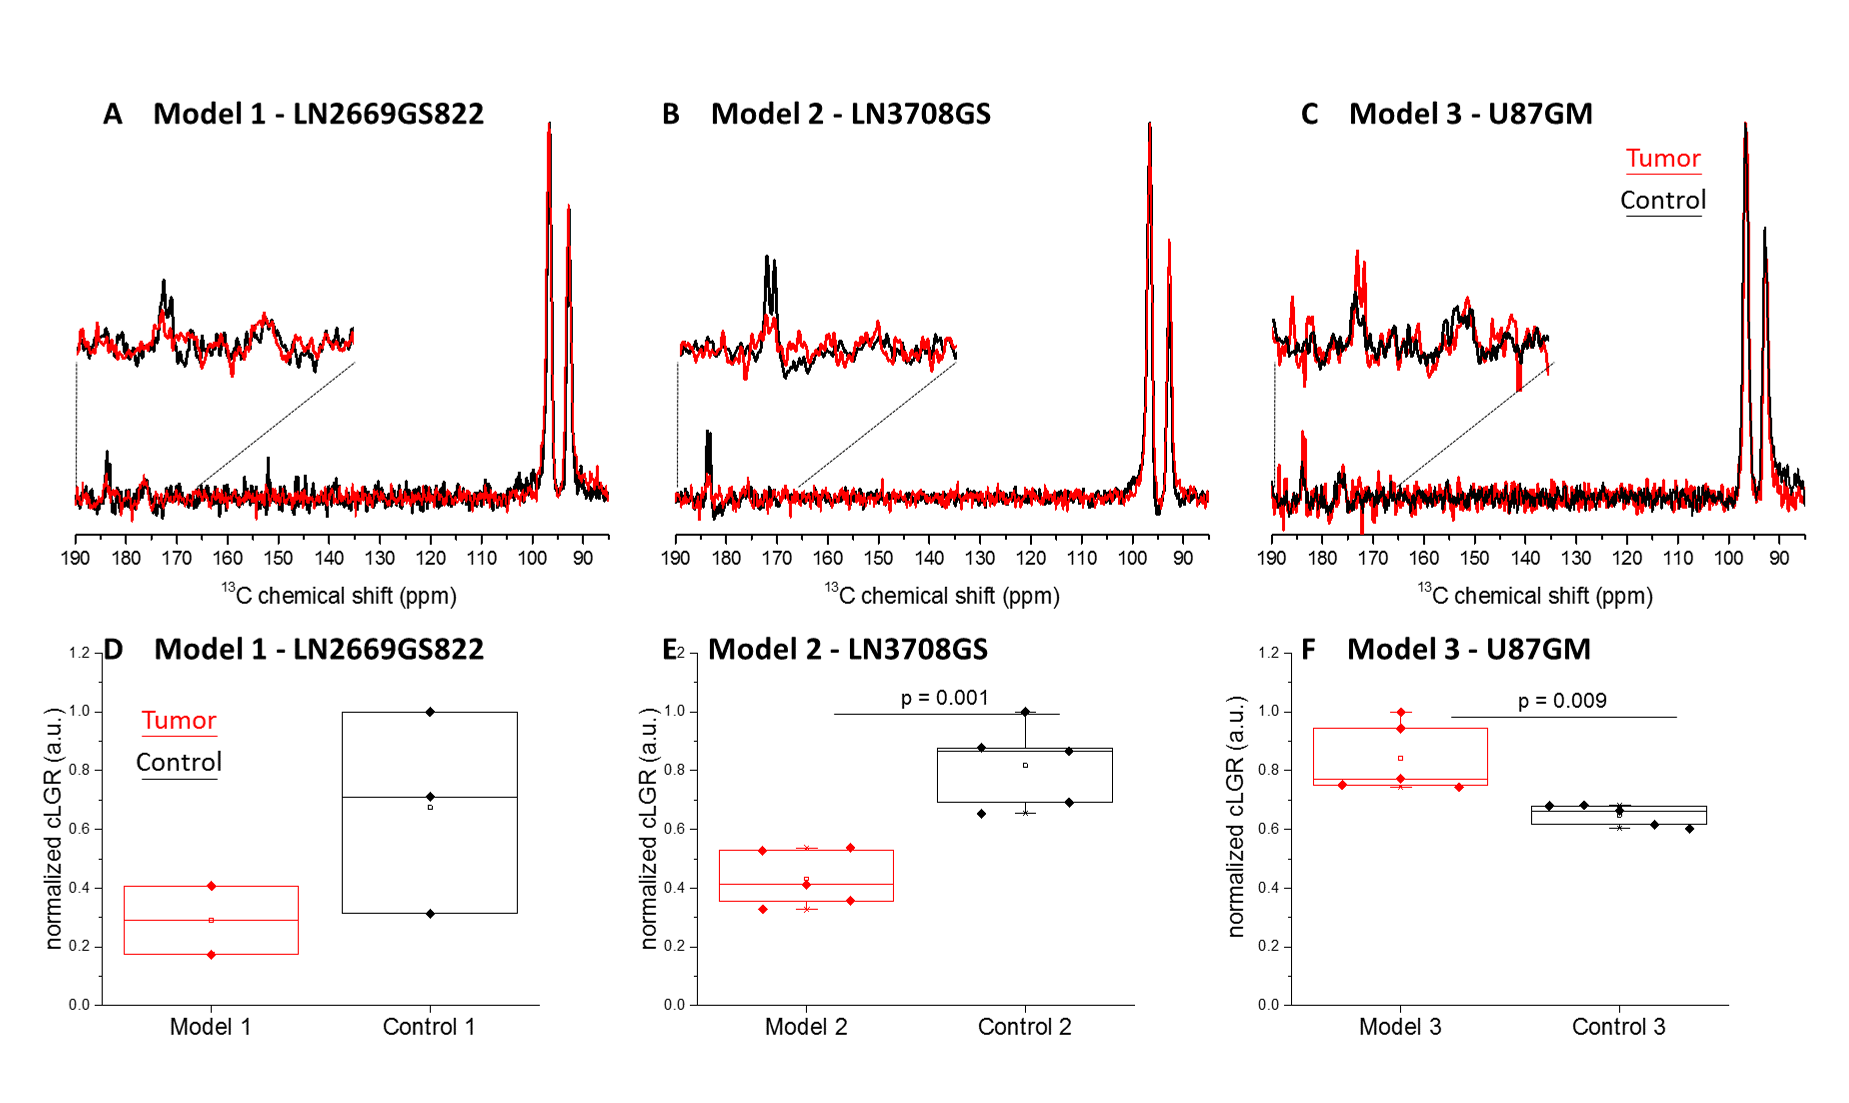
Animal models: LN-2669GS82217,18, LN-3708GS spheroids and U87GM cells were stereotactically injected into the left hemisphere of immunodeficient mice. Control groups were injected with culture medium solely. Baseline information on animal specifications are presented in Table 1.Multiparametric MR analysis was performed in a 9.4T/31cm animal scanner (Varian/Magnex). To define structural changes, T2-weighted images were acquired. To characterize the tumors’ neurochemical profiles, single-voxel 1H MRS measurements were performed in the injected and contralateral hemispheres. To monitor real-time synthesis of [1-13C]lactate, dynamic 13C MRS was acquired by pulse acquire scheme (Gauss, 250ms, on-resonance at 182ppm, TR=0.5s for 50s) starting 5.5s post bolus of HP [2H7,13C6]D-glucose (540mL of 56±13mM)16. Lactate-to-glucose ratio (LGR) was calculated from summed spectra. To minimize variation between individual animals, the ratio was scaled for the dose of 13C-glucose at the time of injection (cLGR). To assess the integrity of the BBB post-contrast T1-weighted images were acquired (Gadovist® 5uL/gr body weight).
RESULTS:
Implantation of LN-2669GS822 and LN-3708GS spheroids gave rise to highly diffusive tumors that spread over both brain hemispheres. As anticipated, implantation of the U87GM cell-line led to the development of a compact tumor mass (Fig.1). Metabolite concentrations derived from 1H spectra demonstrate distinct metabolic profiles of the tumor models compared to their corresponding controls. The lactate pool-size did not change in the infiltrative GBM but increased in the compact tumor mass (Fig.2). In the summed spectra after HP 13C-glucose injection, it can be readily observed that the freshly synthesized [1-13C]lactate and corresponding cLGRs are smaller in the invasive tumor models compared to healthy control, an opposite behavior was found for the compact tumor (Fig.3).DISCUSSION:
As anticipated for hypoxic tumors19, the endogenous lactate pool-size was elevated in the well-characterized U87GM20,21 model as compared to control. Additionally, U87GM tumors show hyperintensity in 18FDG imaging22 ; correspondingly, in our HP 13C-glucose MRS the amount of the freshly synthesized 13C lactate as reflected by cLGR was significantly higher in this tumor than control (Fig.3). These observations support a hyperactive glucose metabolism in the focal model with a metabolic shift towards the so-called ‘Warburg Effect’. However, in models representing the infiltrative front of GBM, the endogenous lactate pool-size was similar to the one in controls, thus implying absence of such a metabolic shift and lack of hypoxic conditions in this type of tumor as previously reported7. Moreover, de novo synthesis of lactate, as detected by HP 13C-glucose MRS, was lower in the infiltrative models compared to the healthy controls, showing an opposite trend to what would have been expected by the ‘Warburg effect’, thus suggests that energy is probably not supplied through ATP production by glycolysis. Distinct from HP pyruvate 13C MRS23, the [1-13C]lactate labeling (in this experiment) is not directly linked to the endogenous lactate pool. While no difference in the steady-state lactate pools was found in models representing the infiltrative front, our new technique for measuring the dynamics of lactate production with HP glucose showed differences in metabolic activity. A further step would be to employ the cLGR into imaging as a metabolic contrast to visualize the invasive front of GBM, presenting a hyperintensity in the focal mass and a hypointensitiy in the infiltrative front. The latter compartment is highly relevant for tumor recurrence, and is currently considered invisible.Acknowledgements
We thank Drs. Magnus Karlsson and Mathilde Lerche for assistance with the DNP sample formulation. This work was supported by the European Union’s Horizon 2020 European Research Council (ERC Consolidator Grant) under grant agreement No 682574 (ASSIMILES), the Centre d’Imagerie BioMédicale (CIBM) of the UNIL, UNIGE, HUG, CHUV, EPFL, and the Leenards and Jeantet Foundations.References
1 Stupp, R. et al. Effect of Tumor-Treating Fields Plus Maintenance Temozolomide vs Maintenance Temozolomide Alone on Survival in Patients With Glioblastoma: A Randomized Clinical Trial. Jama 318, 2306-2316, doi:10.1001/jama.2017.18718 (2017).
2 Lan, X. et al. Fate mapping of human glioblastoma reveals an invariant stem cell hierarchy. Nature 549, 227-232, doi:10.1038/nature23666 (2017).
3 Ntziachristos, V., Pleitez, M. A., Aime, S. & Brindle, K. M. Emerging Technologies to Image Tissue Metabolism. Cell metabolism 29, 518-538, doi:10.1016/j.cmet.2018.09.004 (2019).
4 Warburg, O. On the origin of cancer cells. Science 123, 309-314, doi:10.1126/science.123.3191.309 (1956).
5 Maher, E. A. et al. Metabolism of [U-13 C]glucose in human brain tumors in vivo. NMR Biomed 25, 1234-1244 (2012).
6 Marin-Valencia, I. et al. Glucose metabolism via the pentose phosphate pathway, glycolysis and Krebs cycle in an orthotopic mouse model of human brain tumors. NMR in biomedicine 25, 1177-1186, doi:10.1002/nbm.2787 (2012).
7 Lai, M. et al. In vivo characterization of brain metabolism by (1) H MRS, (13) C MRS and (18) FDG PET reveals significant glucose oxidation of invasively growing glioma cells. International journal of cancer 143, 127-138, doi:10.1002/ijc.31299 (2018).
8 Ardenkjaer-Larsen, J. H. et al. Increase in signal-to-noise ratio of > 10,000 times in liquid-state NMR. Proceedings of the National Academy of Sciences of the United States of America 100, 10158-10163 (2003).
9 Comment, A. & Merritt, M. E. Hyperpolarized magnetic resonance as a sensitive detector of metabolic function. Biochemistry 53, 7333-7357 (2014).
10 Nelson, S. J. et al. Metabolic imaging of patients with prostate cancer using hyperpolarized [1-(1)(3)C]pyruvate. Sci Transl Med 5, 198ra108 (2013).
11 Kurhanewicz, J. et al. Hyperpolarized (13)C MRI: Path to Clinical Translation in Oncology. Neoplasia 21, 1-16, doi:10.1016/j.neo.2018.09.006 (2019).
12 Gordon, J. W. et al. Translation of Carbon-13 EPI for hyperpolarized MR molecular imaging of prostate and brain cancer patients. Magnetic resonance in medicine 81, 2702-2709, doi:10.1002/mrm.27549 (2019).
13 Miloushev, V. Z. et al. Metabolic Imaging of the Human Brain with Hyperpolarized (13)C Pyruvate Demonstrates (13)C Lactate Production in Brain Tumor Patients. Cancer research 78, 3755-3760, doi:10.1158/0008-5472.CAN-18-0221 (2018).
14 Mammoli, D. et al. Kinetic Modeling of Hyperpolarized Carbon-13 Pyruvate Metabolism in the Human Brain. IEEE transactions on medical imaging, doi:10.1109/TMI.2019.2926437 (2019).
15 Rodrigues, T. B. et al. Magnetic resonance imaging of tumor glycolysis using hyperpolarized 13C-labeled glucose. Nat Med 20, 93-97 (2014).
16 Mishkovsky, M. et al. Measuring glucose cerebral metabolism in the healthy mouse using hyperpolarized (13)C magnetic resonance. Sci Rep 7, 11719, doi:10.1038/s41598-017-12086-z (2017).
17 Sciuscio, D. et al. Extent and patterns of MGMT promoter methylation in glioblastoma- and respective glioblastoma-derived spheres. Clin Cancer Res 17, 255-266, doi:10.1158/1078-0432.ccr-10-1931 (2011).
18 Vassallo, I. et al. WIF1 re-expression in glioblastoma inhibits migration through attenuation of non-canonical WNT signaling by downregulating the lncRNA MALAT1. Oncogene 35, 12-21, doi:10.1038/onc.2015.61 (2016).
19 Denko, N. C. Hypoxia, HIF1 and glucose metabolism in the solid tumour. Nature reviews. Cancer 8, 705-713, doi:10.1038/nrc2468 (2008).
20 Linnik, I. V. et al. Noninvasive tumor hypoxia measurement using magnetic resonance imaging in murine U87 glioma xenografts and in patients with glioblastoma. Magnetic resonance in medicine 71, 1854-1862, doi:10.1002/mrm.24826 (2014).
21 Doblas, S. et al. In vivo characterization of several rodent glioma models by 1H MRS. NMR in biomedicine 25, 685-694, doi:10.1002/nbm.1785 (2012).
22 Hovhannisyan, N. et al. [(18)F]Fludarabine-PET as a promising tool for differentiating CNS lymphoma and glioblastoma: Comparative analysis with [(18)F]FDG in human xenograft models. Theranostics 8, 4563-4573, doi:10.7150/thno.26754 (2018).
23 Kennedy, B. W., Kettunen, M. I., Hu, D. E. & Brindle, K. M. Probing lactate dehydrogenase activity in tumors by measuring hydrogen/deuterium exchange in hyperpolarized l-[1-(13)C,U-(2)H]lactate. Journal of the American Chemical Society 134, 4969-4977, doi:10.1021/ja300222e (2012).
24 Mlynarik, V., Gambarota, G., Frenkel, H. & Gruetter, R. Localized short-echo-time proton MR spectroscopy with full signal-intensity acquisition. Magn Reson Med 56, 965-970 (2006).
Figures