0129
Hyperpolarized δ-[1-13C]gluconolactone monitors TERT-induced elevation in pentose phosphate pathway flux in brain tumors in vivo1Radiology and Biomedical Imaging, UCSF, San Francisco, CA, United States, 2Neurological Surgery, UCSF, San Francisco, CA, United States
Synopsis
Telomerase reverse transcriptase (TERT) expression is essential for tumor proliferation and is also an attractive therapeutic target for gliomas. Imaging TERT can help monitor tumor development and response to therapy. TERT expression has previously been shown to enhance glucose flux via the pentose phosphate pathway in low grade glioma cells expressing TERT. Here, we show that hyperpolarized δ-[1-13C]gluconolactone metabolism to 6-phospho-[1-13C]gluconate is significantly higher in tumor compared to contralateral normal brain in TERT-expressing low-grade oligodendrogliomas, pointing to the utility of hyperpolarized δ-[1-13C]gluconolactone for non-invasive in vivo assessment of this critical tumor hallmark in gliomas.
Introduction
Telomerase reverse transcriptase (TERT) expression is a fundamental hallmark of cancer, including in low-grade oligodendrogliomas1. TERT is essential for the maintenance of telomeres, which are chromosomal structures crucial for tumor proliferation. Since TERT expression is linked to tumor proliferation, TERT can serve as a tumor biomarker2 and studies also indicate that inhibiting TERT expression is a therapeutic strategy for gliomas3. We have previously shown that TERT increases the flux of glucose through the pentose phosphate pathway (PPP), as well as the levels of 1H-MRS-detectable NADPH in low-grade oligodendroglioma models4. Hyperpolarized (HP) δ-[1-13C]gluconolactone has been used to detect flux via the PPP by monitoring its conversion to 6-phospho-[1-13C]gluconate (6PG) in isolated perfused liver5. The goal of our study was to evaluate whether HP δ-[1-13C]gluconolactone can be used to monitor the elevated PPP flux induced by TERT expression in low grade gliomas, thereby providing a non-invasive method of assessing TERT expression in vivo.Methods
Cell models: We used isogenic immortalized normal human astrocytes without (NHApre) and with TERT expression (NHApost)6. To ensure that our findings are clinically relevant, we also examined a patient-derived low-grade oligodendroglioma model (SF10417)3.δ-[1-13C]gluconolactone probe preparation: δ-[1-13C]gluconolactone was synthesized and polarized as previously described5. 2M δ-[1-13C]gluconolactone was dissolved in 3:1 water:glycerol and mixed with 15mM trityl radical OX063. After maximal polarization was achieved, the sample was dissolved in 3.9ml phosphate-buffered saline (pH~7)
Hyperpolarized 13C-MRS in live cells: HP δ-[1-13C]gluconolactone (prepared as described above) was injected into live cells (~108) in a 10mm NMR tube to a final concertation of 8mM. 13C-MRS spectra were acquired every 3s for 300s on a Bruker 600MHz NMR spectrometer using a 13deg pulse and signal-to-noise (SNR) ratios were quantified using MestReNova.
Hyperpolarized 13C-MRS in vivo: Male athymic nu/nu rats were investigated. NHApost or SF10417 cells (3x10⁵ or 1x10⁵ respectively) were implanted by intracranial injection in the animals7. All measurements were performed on a horizontal 3T scanner (BioSpec 105mm bore diameter, Bruker) equipped with a dual-tuned 1H-13C volume coil. Axial T2-weighted images were recorded using a spin echo (TurboRARE) sequence and used to evaluate tumor location and size. Hyperpolarized studies were performed following injection of 2.2ml HP δ-[1-13C]gluconolactone (prepared as described above) via a tail-vein catheter over 15s. Data were acquired using a slice selective (12mm) flyback spectral-spatial (SPSP) sequence (TR=3s/NR=32, 35ppm) or a SPSP echo planar spectroscopic imaging (EPSI) with final resolution of 5.375x5.375x8mm3 (TR=3s/NR=20). In both cases the SPSP sequence8 applied a 15.2deg pulse on 6PG and a 3.4deg pulse on δ-[1-13C]gluconolactone. Substrate (δ-[1-13C]gluconolactone) and product (6PG) in the case of the slice selective acquisition were evaluated by deconvolution using MestReNova. In the EPSI data, for each voxel at every time point, spectra were analyzed by determining the area under each peak. Intensity heat maps were produced by interpolating the data using a Lanczos-2 kernel. The signal-to-noise (SNR) ratios of the substrate and the product, as well the product to substrate ratios were evaluated using home-made Matlab code.
Statistical analysis: All results are expressed as mean±STD. Unpaired two-tailed student’s t-test was used to assess the statistical significance of differences with p<0.05 considered significant.
Results and Discussion
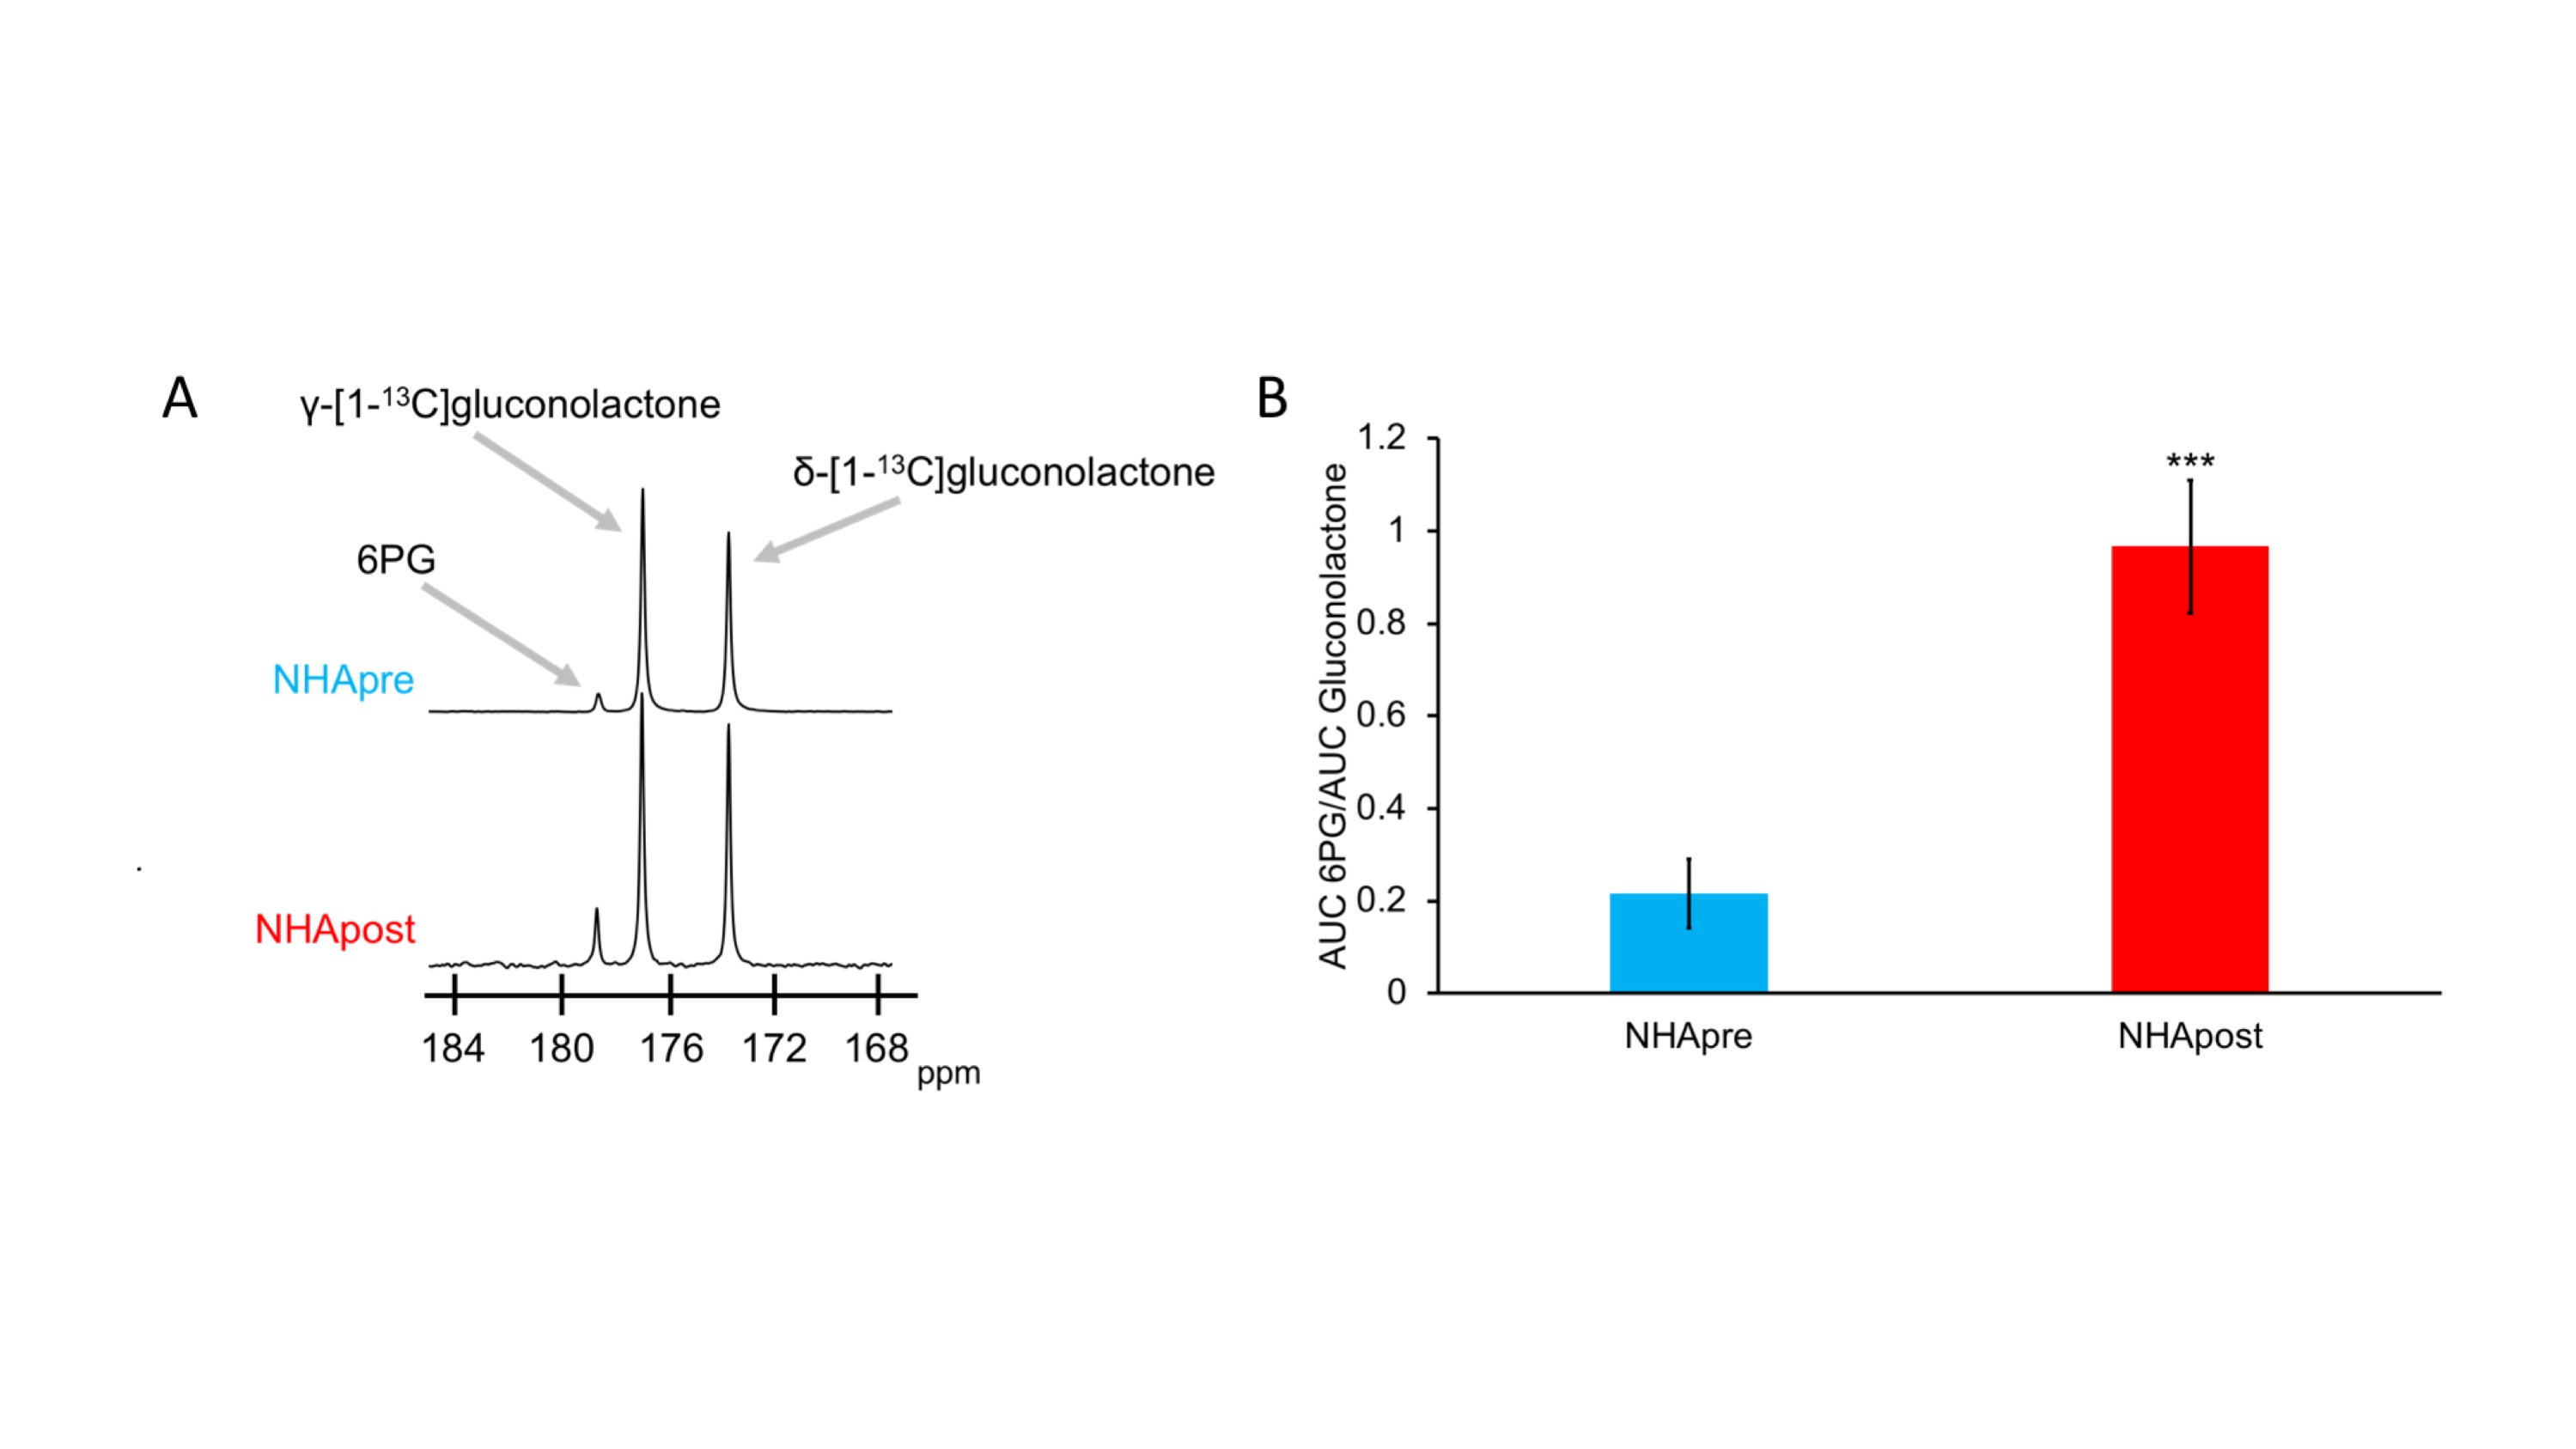
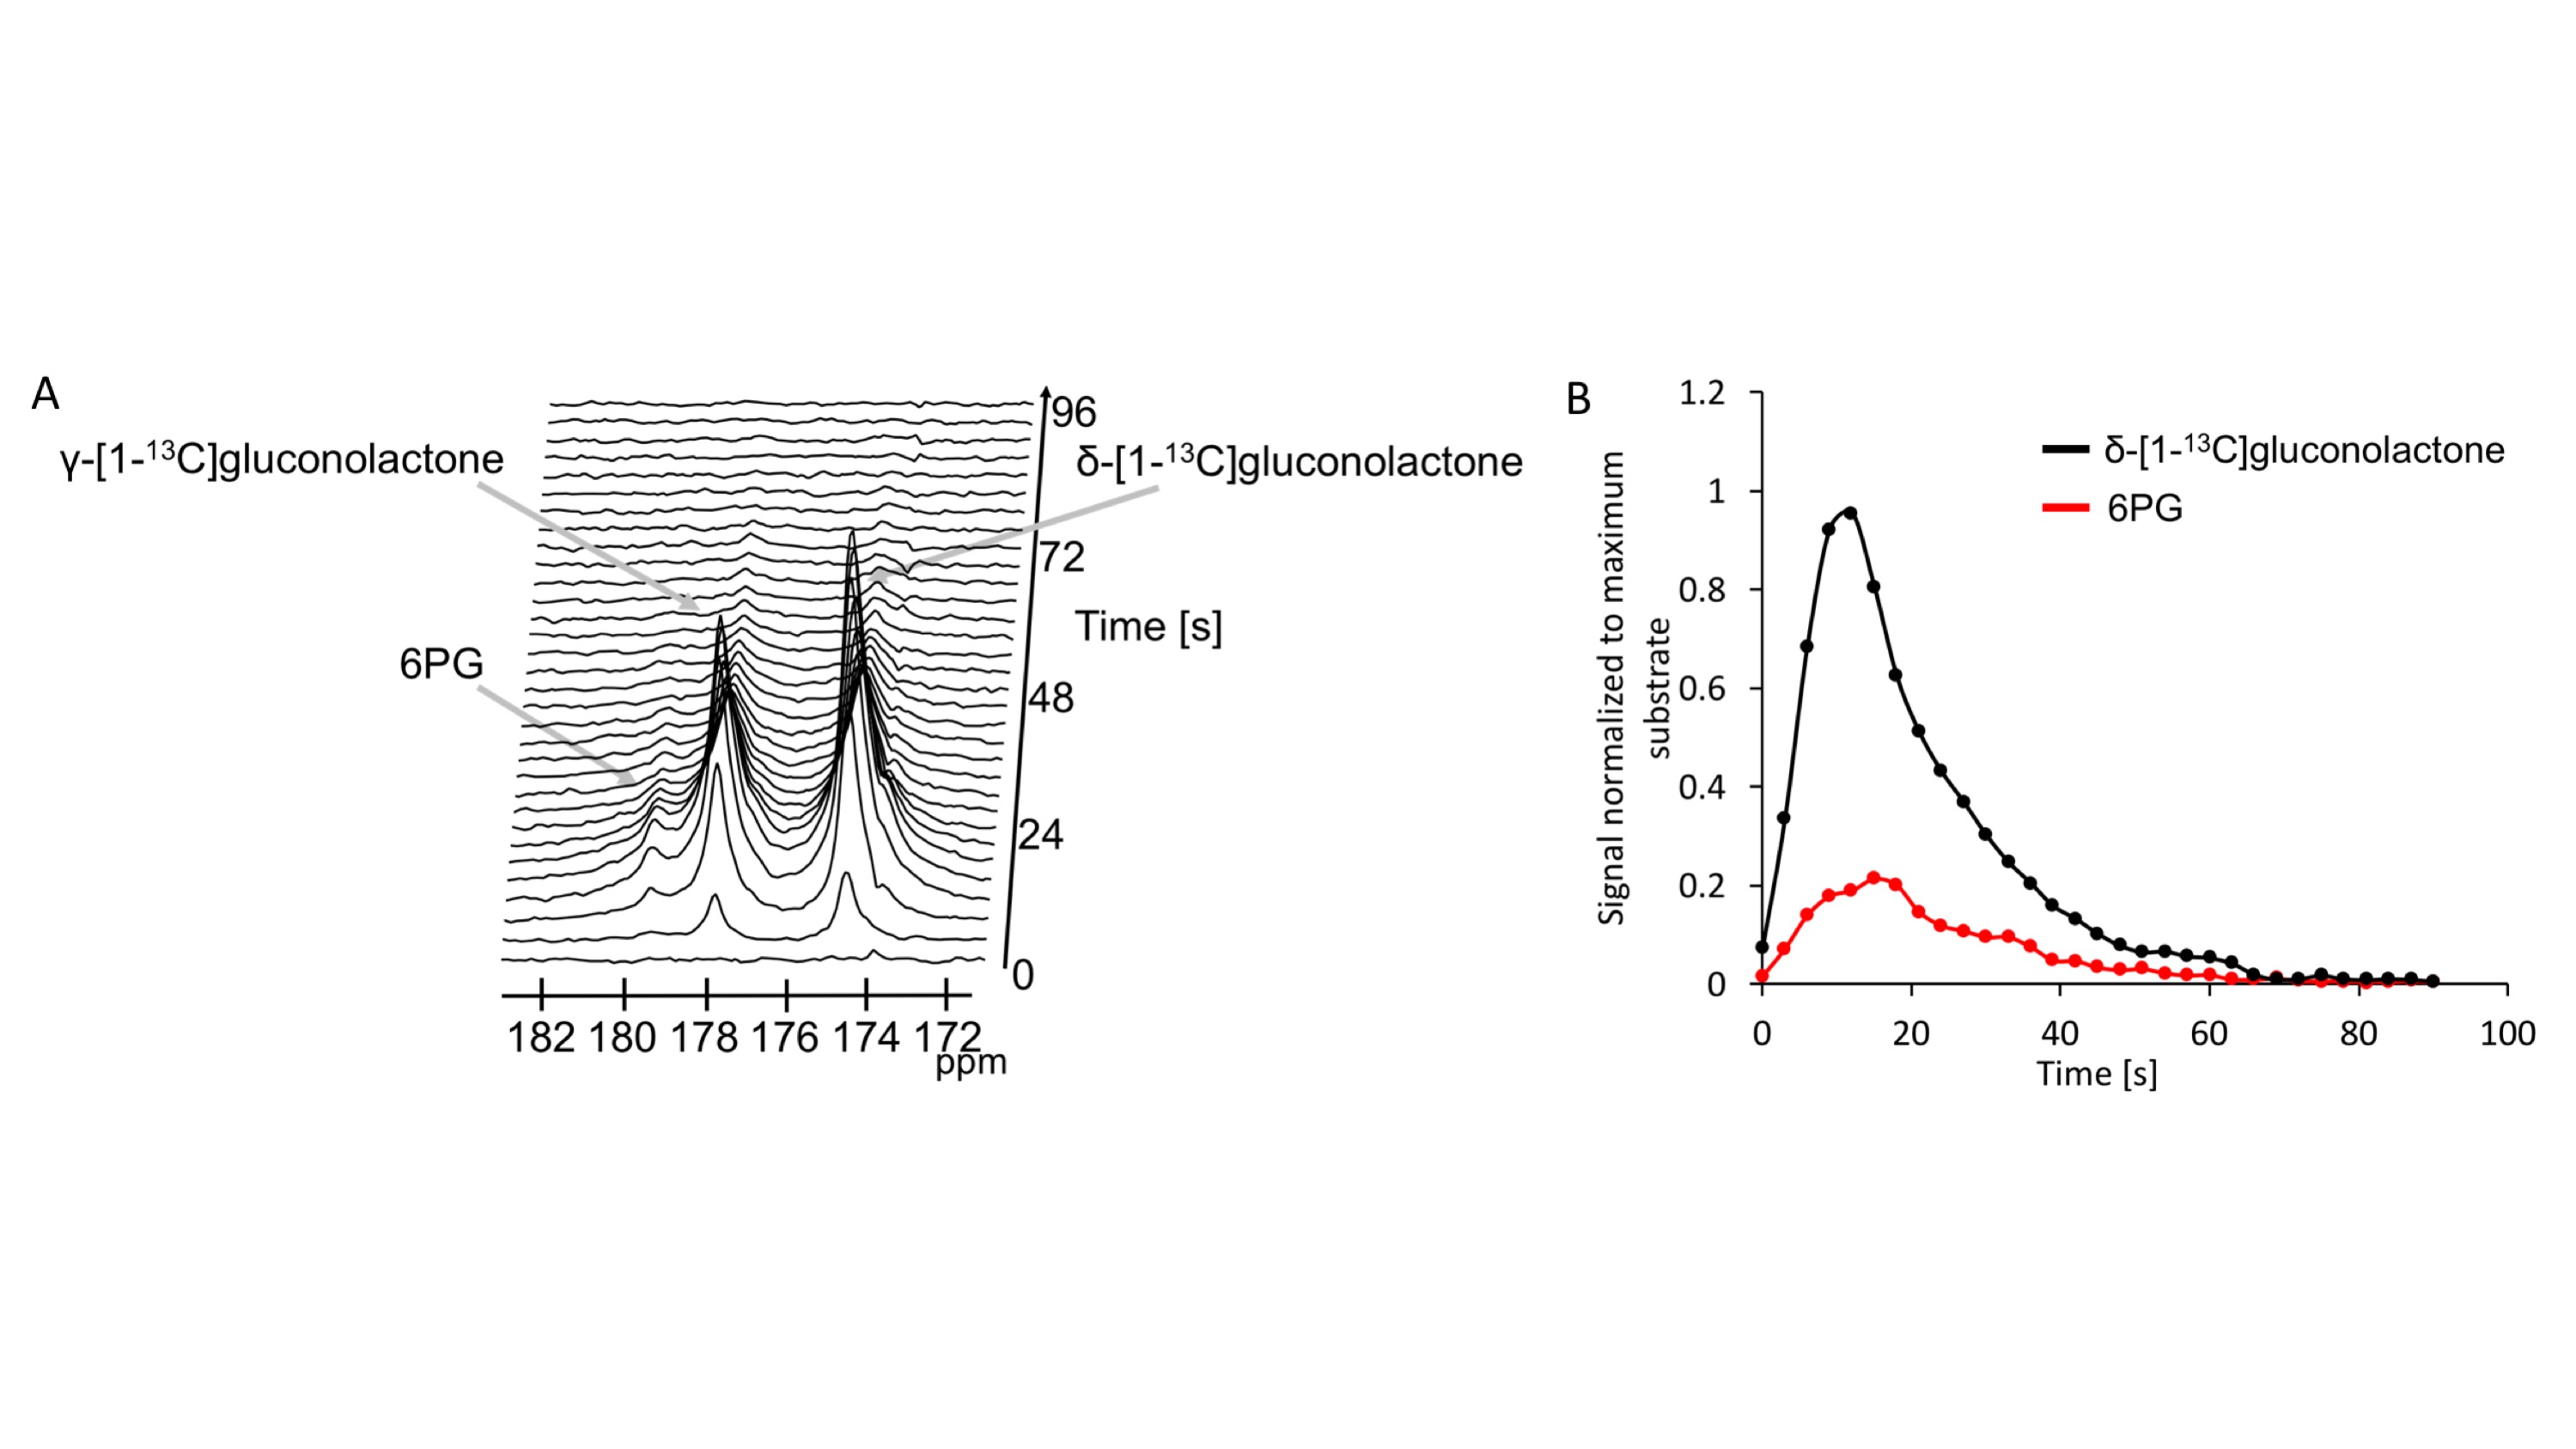
First, we examined flux through the PPP using HP δ-[1-13C]gluconolactone in live NHApre and NHApost cells. NHApost cells showed significantly higher flux through the PPP compared to NHApre (Fig.1A,B). This finding is in agreement with previous results indicating that TERT expression elevates PPP flux4.Based on these findings and the utility of hyperpolarized δ-[1-13C]gluconolactone in monitoring PPP flux5, we examined hyperpolarized δ-[1-13C]gluconolactone metabolism in NHApost tumor xenografts in vivo. HP acquisitions were performed on tumor-bearing animals when tumors reached ~0.25±0.1cm3. A representative spectral array showing dynamic conversion of hyperpolarized δ-[1-13C]gluconolactone to 6PG in a rat bearing an orthotopic NHApost tumor acquired using a slice selective SPSP sequence is shown in Fig.2A-2B.
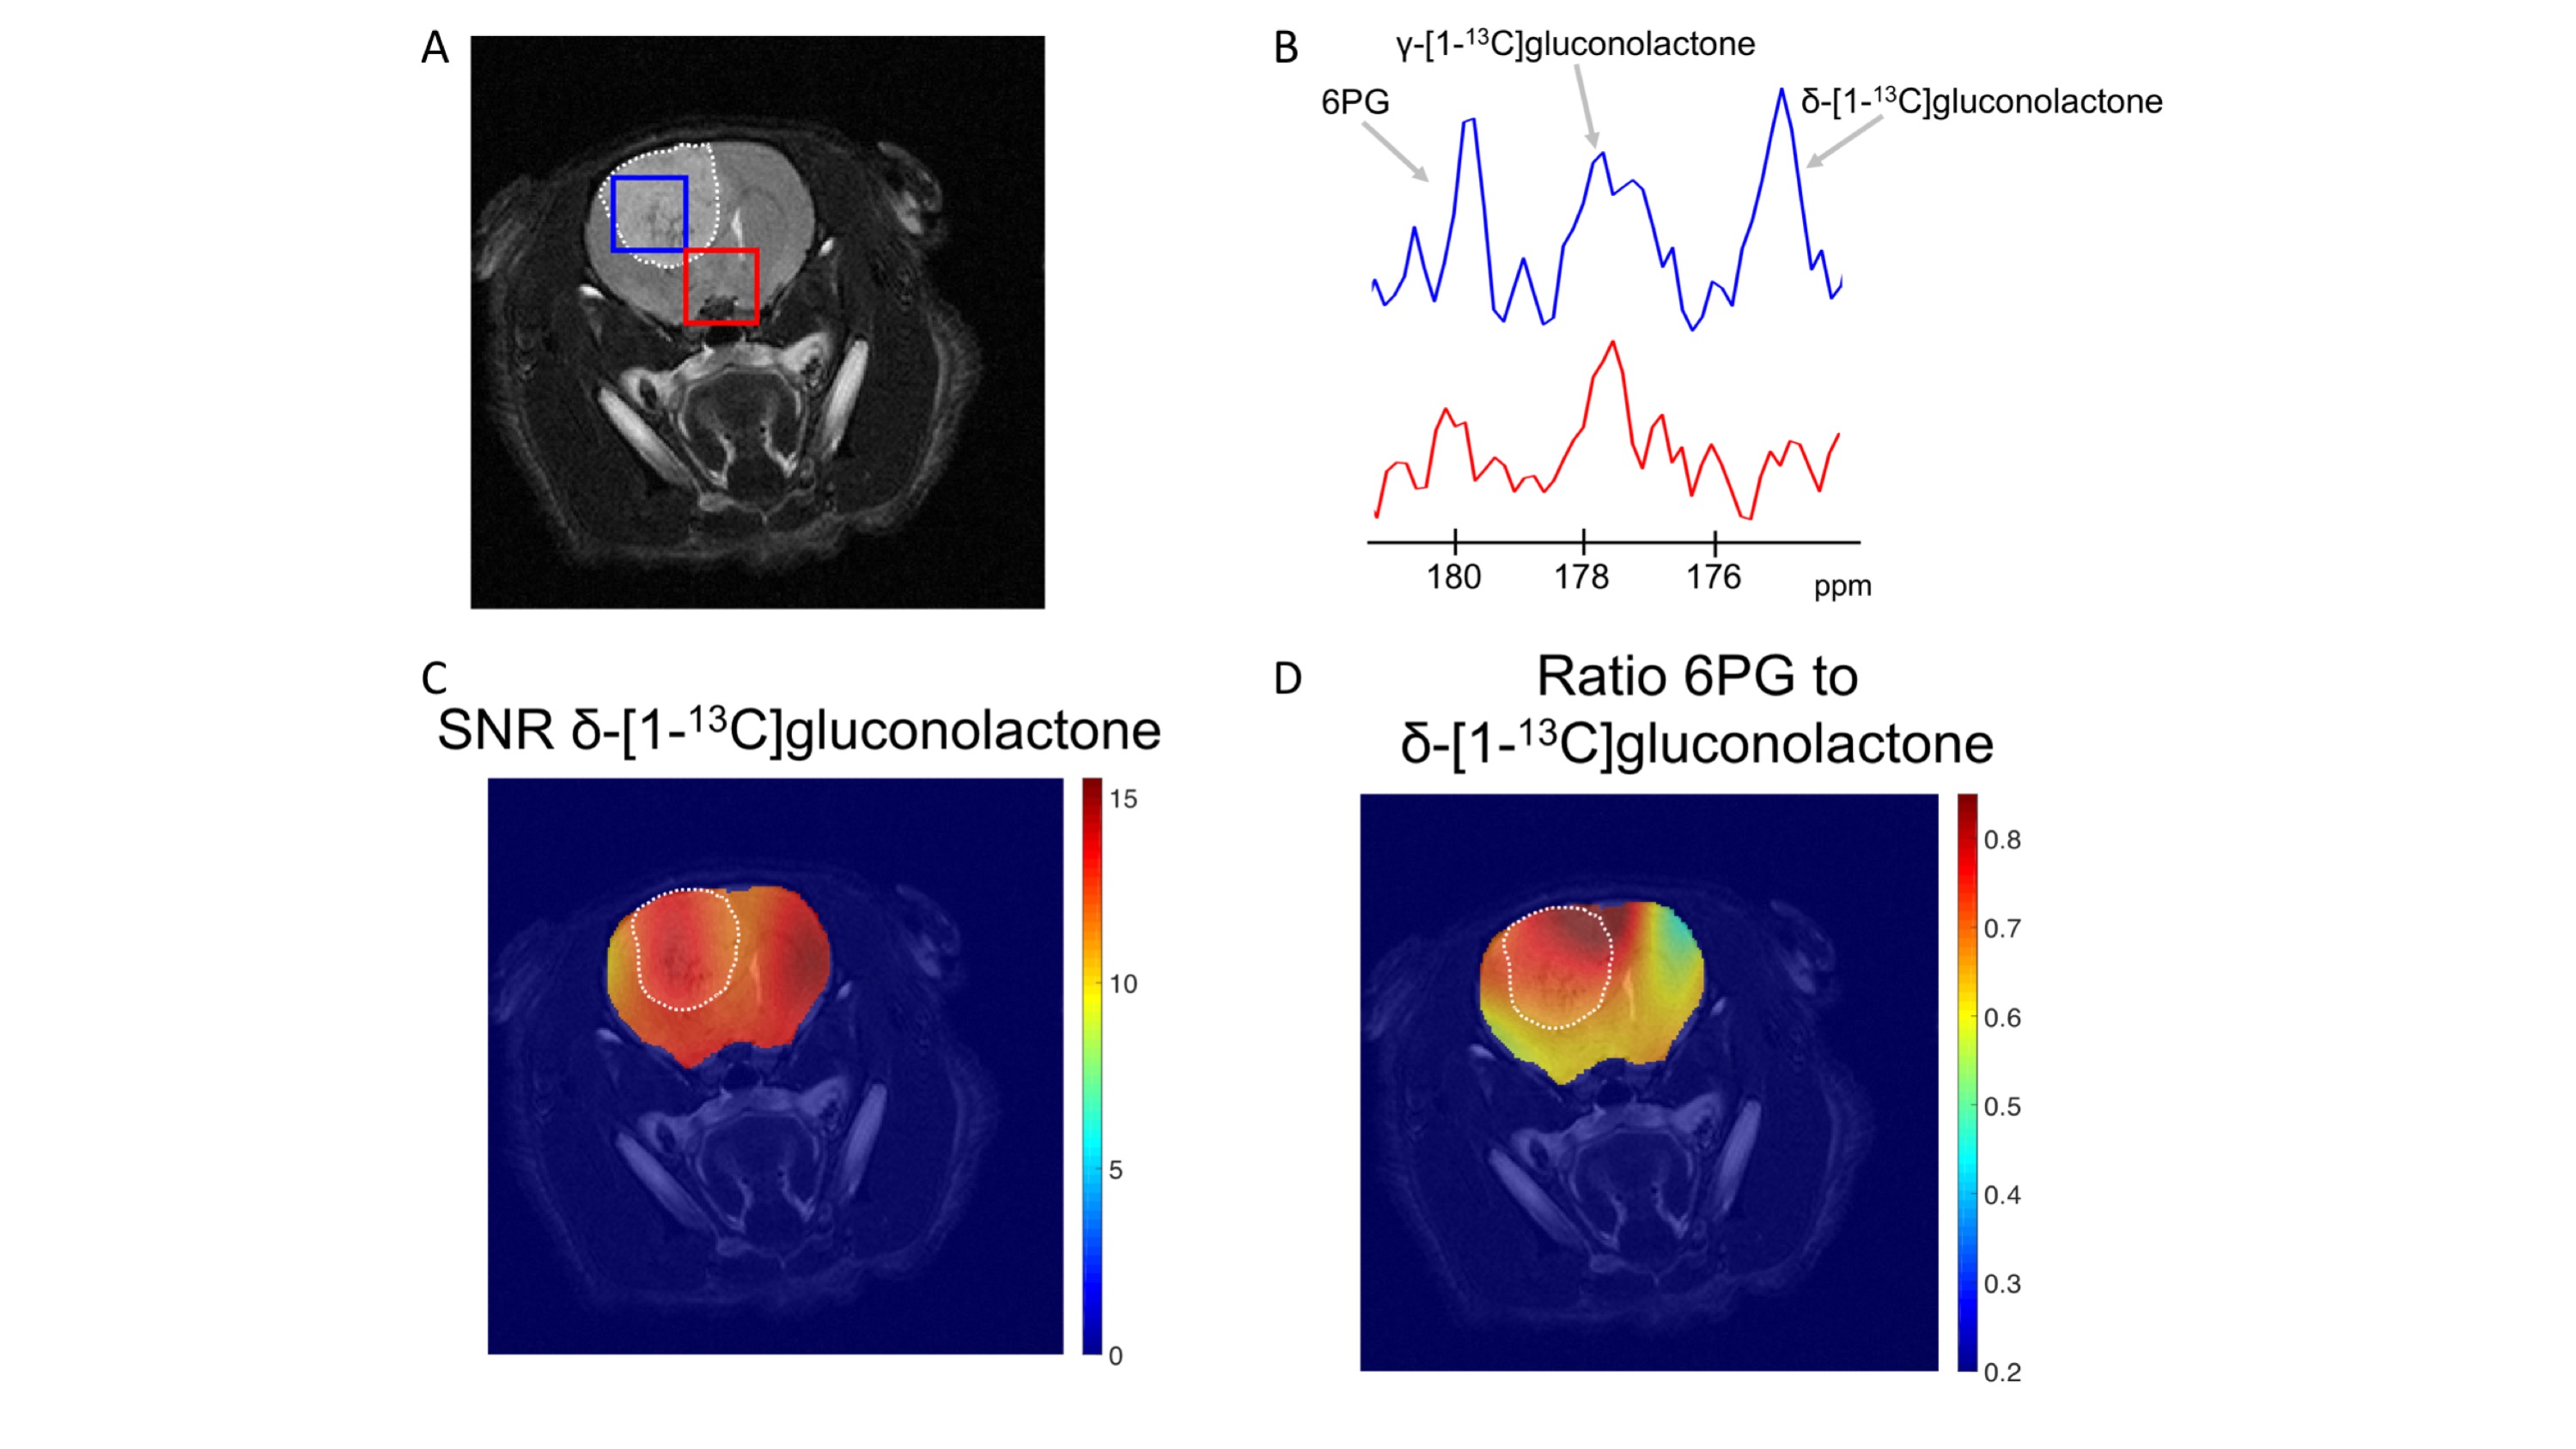
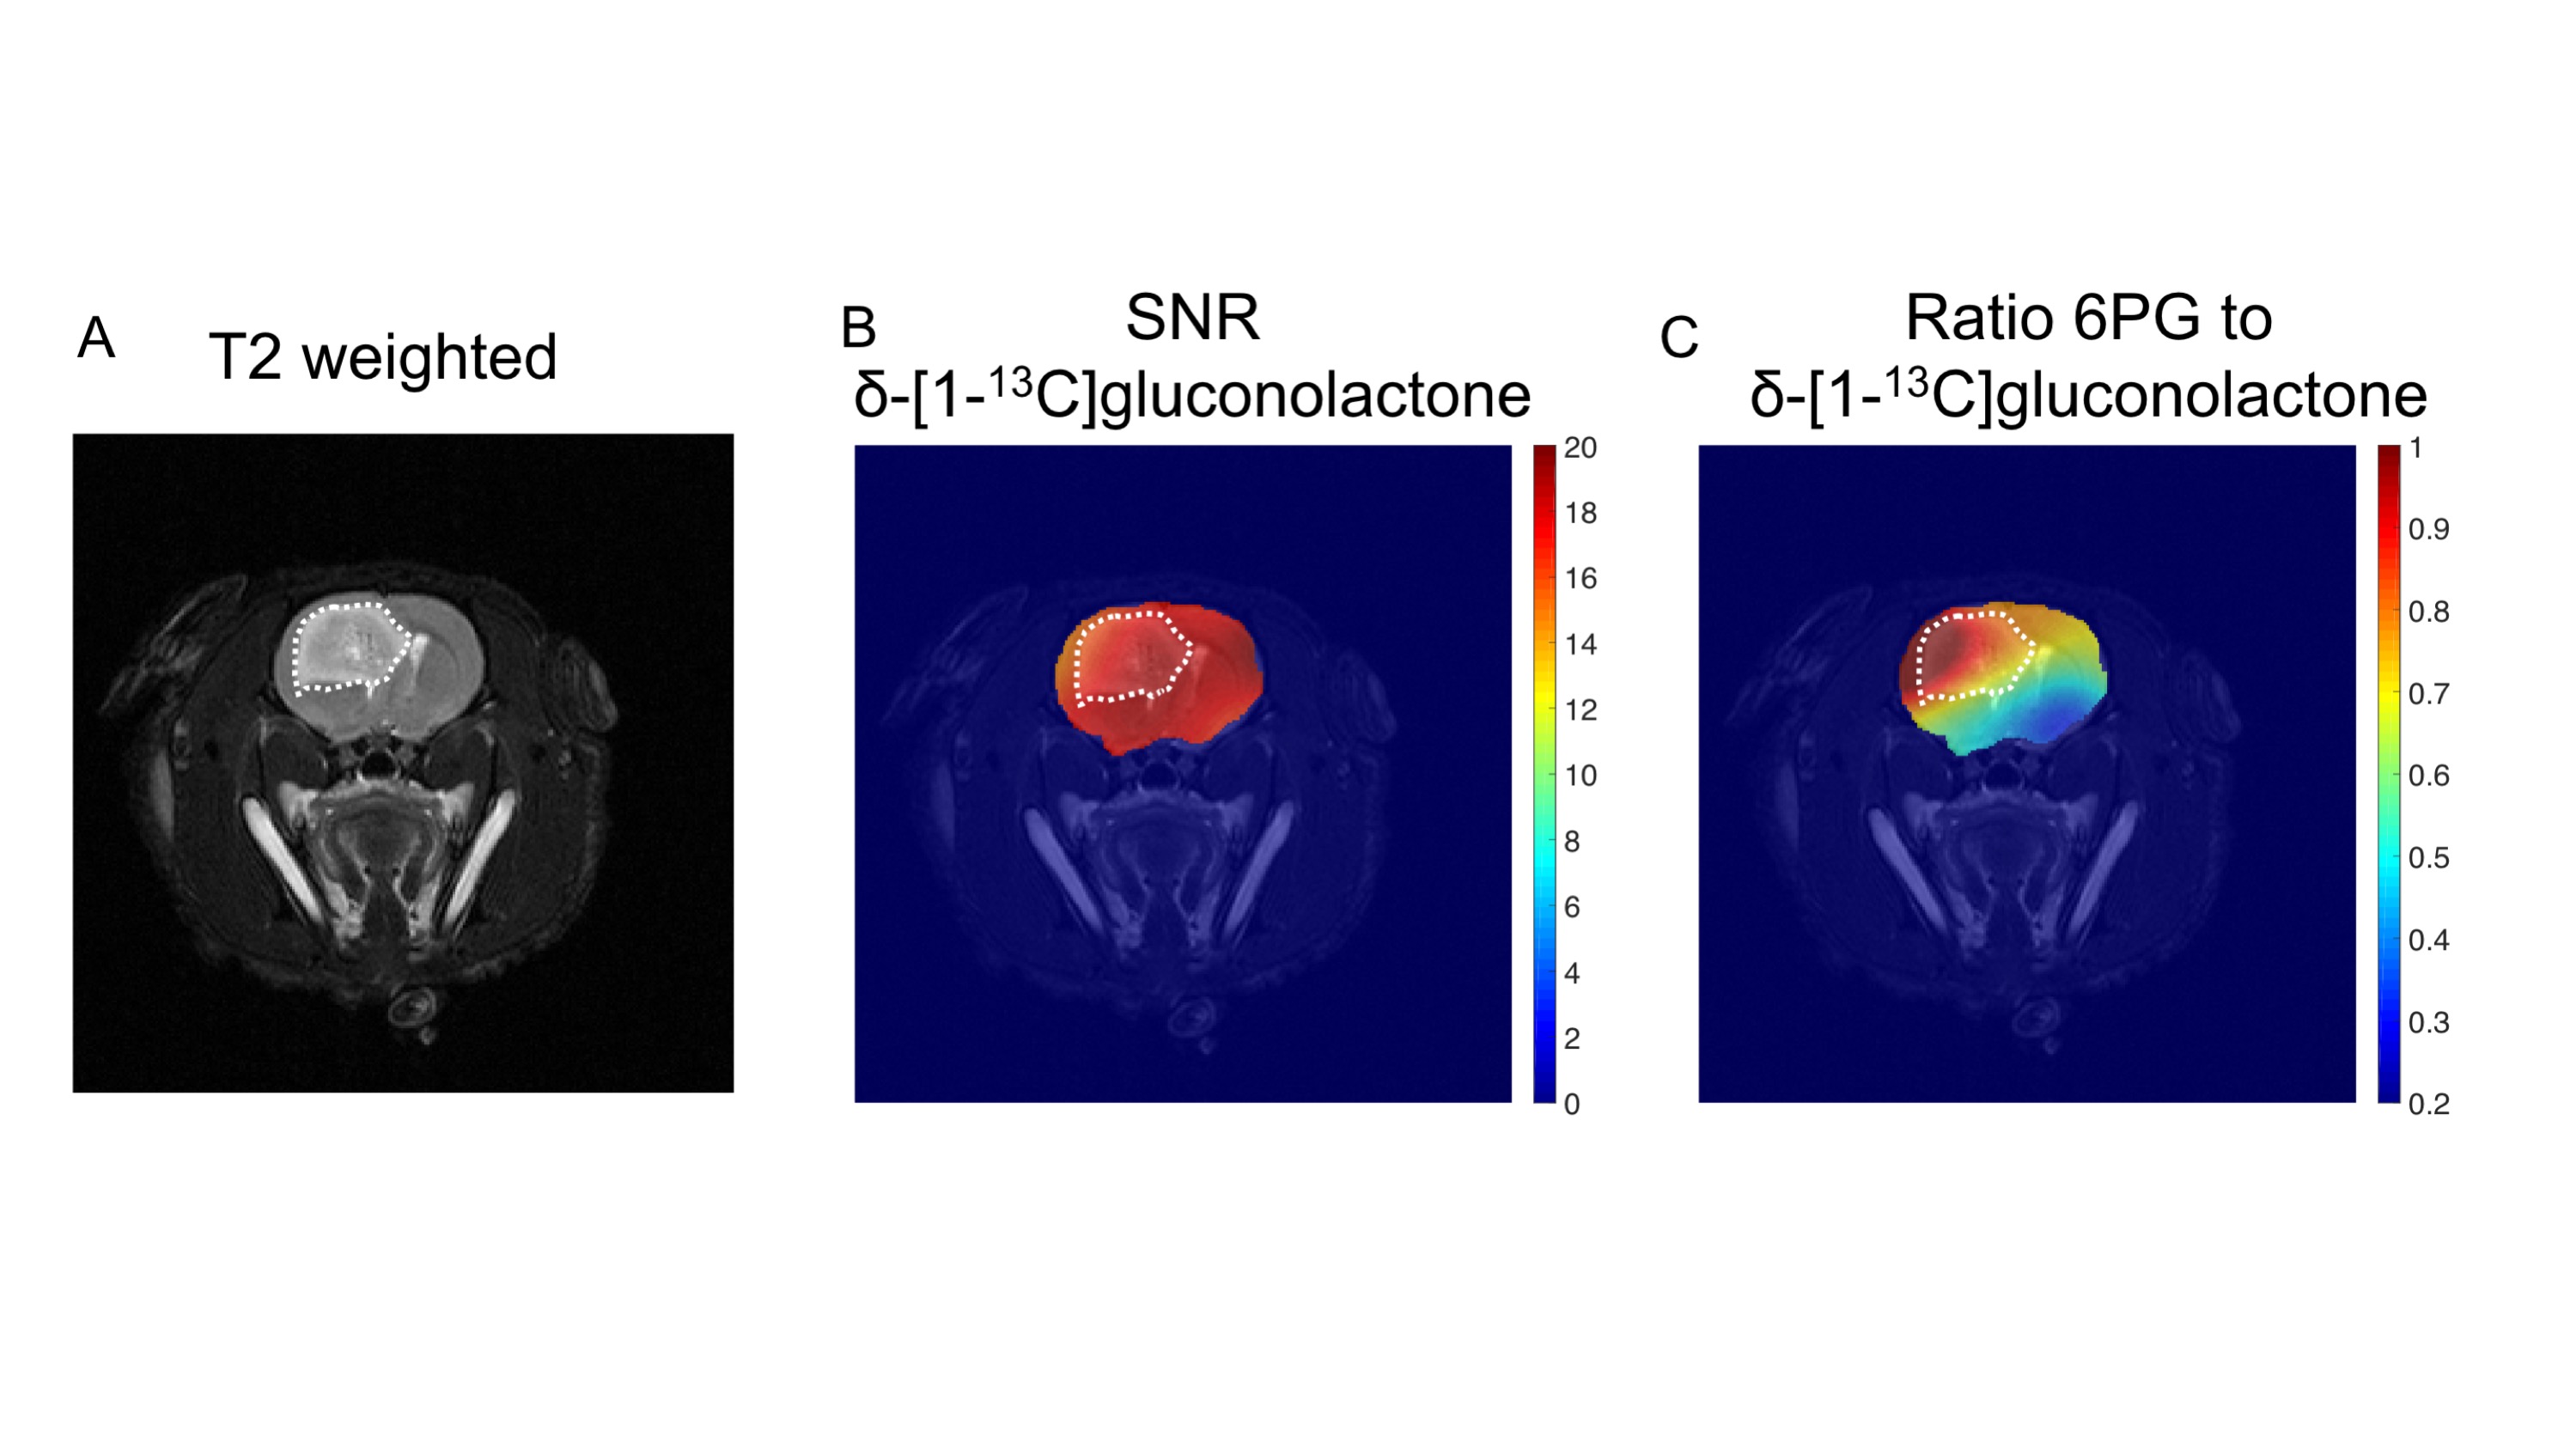
Having established that hyperpolarized δ-[1-13C]gluconolactone metabolism can be observed in vivo, we performed additional 2D EPSI imaging studies in order to evaluate the spatial distribution of δ-[1-13C]gluconolactone and 6PG. Our results indicate 6PG production is significantly higher in the tumor compared to normal brain (Fig.3A-3B). δ-[1-13C]gluconolactone was distributed homogeneously in the brain (Fig.3C), while the ratio of 6PG-to-δ-[1-13C]gluconolactone was higher in the tumor region (Fig.3D). Importantly, we confirmed the clinical relevance of our findings in the patient-derived SF10417 model, which has previously been shown to express TERT3 (Fig.4A). Consistent with the results in the genetically-engineered NHApost model, δ-[1-13C]gluconolactone was homogeneously distributed in the brain (Fig.4B), while the elevated ratio of 6PG-to-δ-[1-13C]gluconolactone was localized to the tumor region (Fig.4C).
Conclusion
Our results indicate that HP δ-[1-13C]gluconolactone can be used to assess TERT expression in both genetically-engineered and patient-derived models of low-grade oligodendrogliomas in vivo. Due to its fundamental role in tumor proliferation, TERT is both a tumor biomarker and a therapeutic target. Monitoring HP δ-[1-13C]gluconolactone metabolism, therefore, has the potential to inform on tumor burden and response to therapy in the clinic.Acknowledgements
Work supported by NIH R01CA172845, NIH R01CA197254, UCSF LOGLIO collective, NICO project and P41EB013598.References
1Hanahan D, Weinberg RA. Hallmarks of cancer: the next generation. Cell 144 (2011)
2Cagney D et al., The FDA NIH Biomarkers, EndpointS, and other Tools (BEST) resource in neuro-oncology. Neuro-Oncology 20 (2018)
3Mancini A et al., Disruption of the β1L Isoform of GABP Reverses Glioblastoma Replicative Immortality in a TERT Promoter Mutation-Dependent Manner. Cancer Cell 34 (2018)
4Viswanath P et al., Imaging a hallmark of cancer: hyperpolarized [U-2H, U-13C]-glucose and hyperpolarized [1-13C]-dehydroascorbic acid can monitor TERT expression in gliomas. Proc. ISMRM (2019) #253
5Moreno KX et al., Hyperpolarized δ‐[1‐13C]gluconolactone as a probe of the pentose phosphate pathway. NMR in Biomedicine 30 (2017)
6Ohba S et al., Mutant IDH1 Expression Drives TERT Promoter Reactivation as Part of the Cellular Transformation Process. Cancer research 76 (2016)
7Batsios G et al., PI3K/mTOR inhibition of IDH1 mutant glioma leads to reduced 2HG production that is associated with increased survival. Sci Report 9 (2019)
8Larson
PE et al., Multiband excitation pulses for
hyperpolarized 13C dynamic chemical-shift imaging. JMR 194 (2008)
Figures