0127
Detecting glycolytic metabolism in glioblastoma using a new 1H MRS and [6,6'-2H2]glucose infusion based approach1Radiology, University of Pennyslvania, Philadelphia, PA, United States, 2Neurology, University of Pennyslvania, Philadelphia, PA, United States, 3Research Branch, Qatar University, Doha, Qatar
Synopsis
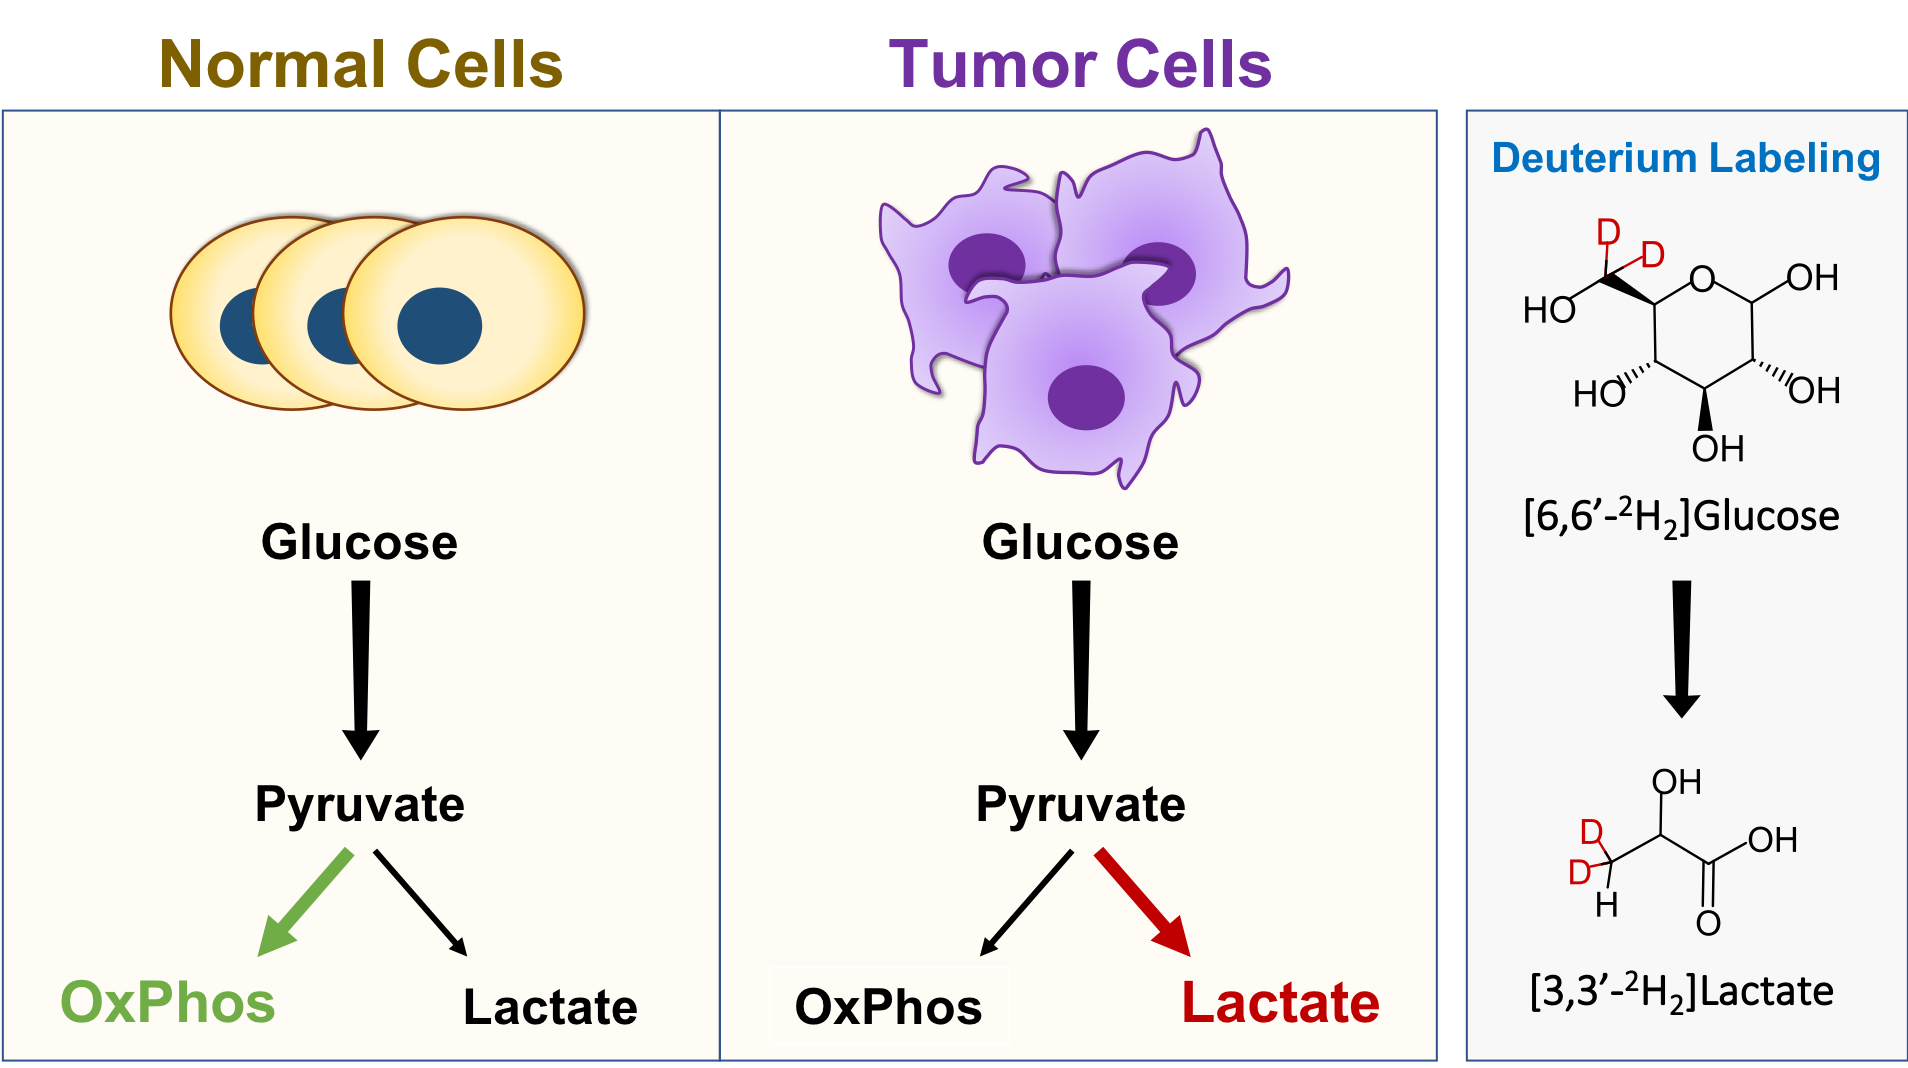
A key hallmark of malignant tissues is a metabolic shift from oxidative phosphorylation to glycolytic metabolism, leading to increased lactate production. Probing the kinetics of lactate production in vivo may play a key role in studying disease mechanisms and developing biomarkers of treatment response. Here, we developed a new approach for studying glycolytic metabolism in glioblastoma by combining 1H MRS with infusion of deuterated glucose. Infusion of [6,6'-2H2]glucose leads to downstream deuterium labeling of lactate, resulting in a reduction in the 1.33 ppm lactate peak on 1H MRS and making it is possible to monitor the metabolic turnover of lactate.
Introduction
It is well recognized that brain tumor development is associated with significant changes in cellular metabolism1. Specifically, tumor cells are known to rely heavily on glycolysis instead of oxidative phosphorylation in order to support growth, proliferation and survival2. A hallmark of this inefficient metabolic process is the increased uptake of glucose and subsequent conversion to lactate (Lac), with Lac production increasing significantly compared to normal physiological conditions (Fig 1)1,2. Measuring this metabolic switch has the potential to provide insight into tumor aggressiveness, disease mechanisms and treatment response3,4. Currently, PET is the only clinically utilized metabolic imaging technique that can assess glycolytic metabolism5. However, PET is also limited as it requires the radioactive glucose analog 2-18F-fluoro-2-deoxy-d-glucose (18FDG) and only provides information on glucose uptake and not downstream metabolism6. Recently, 2H magnetic resonance spectroscopy (MRS), also referred to as deuterium MRS (DMRS), has been evaluated for its potential to assess neural metabolism following administration of deuterated glucose7. Preliminary studies have demonstrated the utility of DMRS for measuring Lac production in human glioblastoma8. However, DMRS is also limited by its low sensitivity and requirement for specialized coils. Here, building on the recent advances of DMRS, we developed a new approach, exchanged label turnover quantitative measurement (ELOQUENT) MRS (eMRS), which utilizes a combination of 1H MRS and deuterium labeled glucose to measure tumor metabolism. Infusion of deuterium labeled glucose leads to downstream labeling of Lac in tumors. As the deuterium label is invisible on 1H MRS, accumulation of deuterium labeled Lac results in a reduction in the 1.33 ppm lactate peak, making it possible to quantify Lac production. Therefore, this provides a straightforward and easily implementable approach for studying downstream glycolytic metabolism, all of which can be performed with standard 1H MRS hardware and acquisition sequences.Methods
For experiments, three 6-8 week old female F344/NCR rats (120-130 g) were implanted with the rat glioblastoma cell line (F98) as described previously9. Briefly, after sterilization of the surgical site, a hole was drilled 3 mm lateral and 3 mm posterior to the bregma, and a 10 µl suspension of 5x10⁵ F98 cells in PBS injected into the cortex. All the MRI and MRS experiments were performed on a 9.4T, 30 cm horizontal bore magnet interfaced to a Bruker console using commercial radiofrequency coils. During imaging, animal body temperature was maintained at 37ºC and respiratory rate monitored throughout the experiment. Rats were injected with [6,6′-2H2]glucose (Cambridge Isotope Laboratories Inc, Tewksbury, MA) at a dose of 1.95 g/kg for a period up to 90 mins via an automated infusion pump and tail vein catheter using a bolus variable infusion protocol as described previously10. eMRS spectra were acquired from a 64 µl voxel localized in the tumor using PRESS (TR/ TE=2500/16 ms, spectral width = 4 kHz, 90° pulse bandwidth = 5400 Hz, 180° pulse bandwidth = 2400 Hz, number of points = 4006, VAPOR water suppression, averages=128). All displayed spectra were processed using the Bruker TOPSPIN software package.Results and Discussion
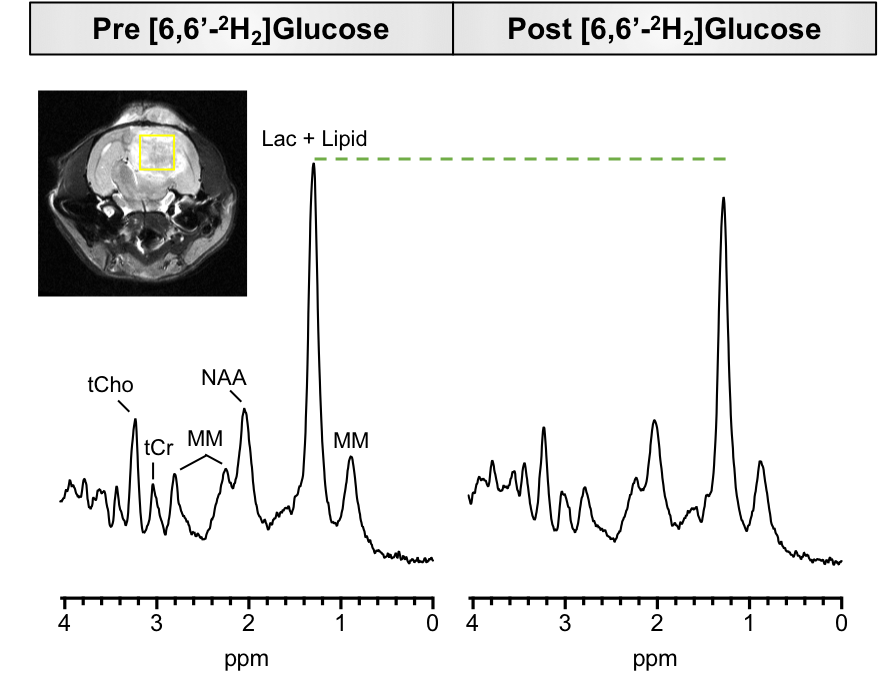
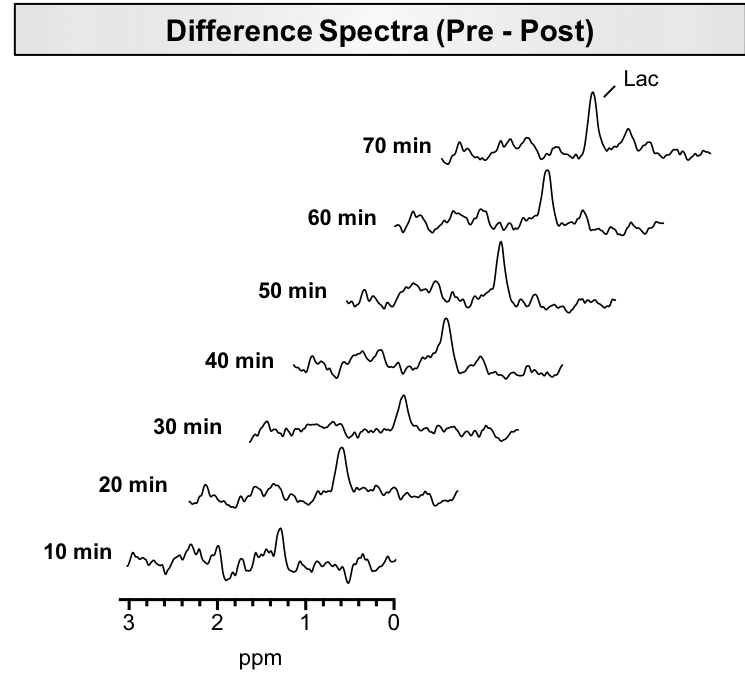
We hypothesized that eMRS should be capable of capturing increased Lac turnover in brain malignancies. To address this, rats were orthotopically implanted with the F98 syngeneic rat glioma model and allowed to grow for three weeks, after which eMRS was performed. Fig 2 displays representative eMRS spectra from an F98 glioblastoma bearing rat acquired before and after [6,6′-2H2] glucose infusion. Prior to infusion, a large peak can be observed at 1.33 ppm representing a combined Lac and lipid peak (Fig 2 left). After 60 min of [6,6′-2H2] glucose infusion, a marked reduction in the Lac peak at 1.33 ppm was observed, suggesting considerable 2H labeling of Lac (Fig 2 right). Subtraction of post-infusion 1H MRS spectra from the pre-infusion spectra show the time course of Lac labeling, with a clear increase in labeling occurring only 10 min post-infusion (Fig 3). It was also possible to calculate the percent change in the 1.33 ppm Lac peak amplitude, providing kinetics of the Lac labeling (Fig 4). These results are consistent with previously published results using DMRS following the infusion of [6,6′-2H2]glucose8.Conclusions
In this work, we demonstrate the potential of eMRS to measure glycolytic activity of glioblastoma following [6,6′-2H2]glucose infusion. Detection and quantification of the rate of Lac production may provide crucial information regarding tumor metabolism. Hence, eMRS is expected to open up new opportunities to probe changes in these metabolic rates in a variety of human diseases, including cancer and neurological disorders.Acknowledgements
Acknowledgements: The authors would thank Dr. Damodara Reddy for help with animal model preparation, Dr. Mark Elliot for his expertise on MRS acquisition and processing, and Drs. Stephen Pickup and Weixia Liu for their technical assistance in using the 9.4 T horizontal bore animal MR scanner.
Funding: This work was carried out at a US National Institutes of Health–supported resource, with funding from: the NIBIB under Grant No. P41 EB015893, National Institute of Neurological Disorders and Stroke Award Number R01NS087516 and the training grant T32EB020087-02.
References
1. Pavlova, N. N. & Thompson, C. B. The Emerging Hallmarks of Cancer Metabolism. Cell Metab. 23, 27-47. (2016).
2. Heiden, M. G. Vander, Cantley, L. C. & Thompson, C. B. Understanding the warburg effect: The metabolic requirements of cell proliferation. Science. 324, 1029-1033 (2009).
3. Brizel, D. M., Schroeder, T., Scher, R. L., Walenta, S., Clough, R. W., Dewhirst, M. W., & Mueller-Klieser, W. Elevated tumor lactate concentrations predict for an increased risk of metastases in head-and-neck cancer. Int. J. Radiat. 51, 349-353 (2001).
4. Miranda-Gonçalves, V., M Reis, R., & Baltazar, F. Lactate transporters and ph regulation: potential therapeutic targets in glioblastomas. Curr. 16, 388-399 (2016).
5. Kelloff, G. J. et al. Progress and promise of FDG-PET imaging for cancer patient management and oncologic drug development. Clin. Cancer Res. 11, 2785-2808 (2005)
6. la Fougere, C., Suchorska, B., Bartenstein, P., Kreth, F. W., & Tonn, J. C. Molecular imaging of gliomas with PET: opportunities and limitations. Neuro. Oncol. 13, 806-819 (2011)
7. Lu, M., Zhu, X. H., Zhang, Y., Mateescu, G. & Chen, W. Quantitative assessment of brain glucose metabolic rates using in vivo deuterium magnetic resonance spectroscopy. J. Cereb. Blood Flow Metab. 37, 3518-3530 (2017)
8. De Feyter, H. M. et al. Deuterium metabolic imaging (DMI) for MRI-based 3D mapping of metabolism in vivo. Sci. Adv. 4, eaat7314 (2018)
9. Kim, S., Pickup, S., Hsu, O. & Poptani, H. Diffusion tensor MRI in rat models of invasive and well-demarcated brain tumors. NMR Biomed. 21, 208-216 (2008)
10. Patlak, C. S., & Pettigrew, K. D. A method to obtain infusion schedules for prescribed blood concentration time courses. J. Appl. Physiol. 40, 458-463 (1976)
Figures