0126
Chemotherapeutic drugs profoundly alter the metabolism of triple negative breast cancer cells
Kanchan Sonkar1, Caitlin M. Tressler1, and Kristine Glunde1,2
1The Russell H. Morgan Department of Radiology and Radiological Science, Johns Hopkins University School of Medicine, Baltimore, MD, United States, 2The Sidney Kimmel Comprehensive Cancer Center, Johns Hopkins University School of Medicine, Baltimore, MD, United States
1The Russell H. Morgan Department of Radiology and Radiological Science, Johns Hopkins University School of Medicine, Baltimore, MD, United States, 2The Sidney Kimmel Comprehensive Cancer Center, Johns Hopkins University School of Medicine, Baltimore, MD, United States
Synopsis
Triple negative breast cancer (TNBC) is a highly aggressive form of cancer that poses severe health care problem as no targeted therapeutics are available for its treatment. TNBC is treated with chemotherapeutic agents, including doxorubicin, paclitaxel, vinorelbine, 5-fluorouracil, melphalan and cisplatin , which are either used alone or in various combinations. Studies investigating the metabolic effects of chemotherapy in TNBC are still limited. Here we have used high-resolution 1H MRS to study the metabolic profiles of TNBC cell lines MDA-MB-231 and SUM159 treated with these chemotherapeutic agents as compared to untreated controls.
Purpose:
Cancer and metabolism1 are highly intertwined. Changes in metabolic networks2, such as those involved in biosynthetic pathways, glycolysis, glutaminolysis, and lipid metabolism3 to mention just a few, are greatly affected in cancer cells2,4. The metabolic profiles of breast cancer cells5 differ from normal breast epithelial cells, and metabolic profiles of drug responders are different from those observed in non-responders6,7. Metabolomics is an important approach for studying cancer metabolism, as it can help identify biomarkers for evaluating therapeutic efficacy, as well as assess toxic side effects8. In this study we have used high-resolution 1H MR spectroscopy9 to systematically characterize the metabolic profiles of two triple negative breast cancer (TNBC) cell lines, MDA-MB-231 and SUM159, treated independently with doxorubicin, paclitaxel, vinorelbine, 5-fluorouracil, melphalan, or cisplatin. We have identified metabolic changes in various metabolic pathways in TNBC cells in response to these chemotherapeutic agents.Methods:
Two TNBC cell lines MDA-MB-231 and SUM159 were treated with six routinely used chemotherapeutic agents from different drug classes, including an antimetabolite agent (5-fluorouracil: 5FU), a platinum based agent (cisplatin: CPT), a topoisomerase inhibitor (doxorubicin: DOX), an alkylating agent (melphalan: MPL), and antimicrotubule agents (paclitaxel: PXL and vinorelbine: VRL). Cells were treated for 48 hours at their respective IC50 as determined by WST-1 assay. MDA-MB-231 cells were treated with 400 nM 5FU, 150 nM CPT, 5 µM DOX, 50 nM PXL, 75 nM MPL, or 100 nM VRL for 48 hours prior to analysis. SUM159 cells were treated with 100 nM 5FU, 400 nM CPT, 100 nM DOX, 50 nM MPL, 10 nM PXL, or 10 nM VRL. DMSO was used as vehicle control for both cell lines. Metabolites were extracted employing dual-phase extraction (chloroform:methanol:water = 2:1:1) for high-resolution 1H MR spectroscopy. 1H MR spectra of aqueous phases (containing water-soluble small molecular weight metabolites) were acquired on a Bruker Avance 750MHz spectrometer. All relevant metabolites were identified10 and quantified using Bruker Topspin software. Using quantification values in fmol/cell from twenty-two metabolites from 3 biological repeats per cell line and treatment, we generated a heatmap with MATLAB. Due to the large dynamic range of metabolite concentrations, a cut off value was used for the most highly concentrated metabolites to visualize all changes at once. The actual values of these metabolites are as follows: MDA-MB-231 cell line - Control: Phosphocholine(PC) : 62 fmol/cell, glutamate:96 fmol/cell, lactate:166 fmol/cell. DOXO: Threonine:93 fmol/cell, glutamate:115 fmol/cell, lactate:196 fmol/cell. PXL: PC:66 fmol/cell, glutamate:94 fmol/cell, lactate:171 fmol/cell. VRL: PC:60 fmol/cell, glutamate:123 fmol/cell, lactate:143 fmol/cell. SUM159 cell line- 5FU: Glutamate:152 fmol/cell, lactate:147 fmol/cell. CPT: Glycerol:90 fmol/cell, myoinositol:114 fmol/cell, threonine:280 fmol/cell, histidine:323 fmol/cell, asparagine:244 fmol/cell, glutamate:852 fmol/cell, alanine:131 fmol/cell, lactate:1025 fmol/cell, branched chain amino acids:367 fmol/cell, valine:97 fmol/cell.Results and Discussion:
Metabolic profiles of both cell lines were significantly altered following treatment with chemotherapeutic drugs when compared to control cells exposed to DMSO as vehicle control. MDA-MB-231 cells (Figure 1) showed significant changes in metabolites associated with protein biosynthesis (DOXO, CPT, 5FU, PXL), choline metabolism (CPT, 5FU, MPL), glycolysis (all drugs), and nitrogen metabolism (all drugs). SUM159 (Figure 2) treated cells also showed significant changes in their metabolic profiles following treatment with the tested chemotherapeutic agents. Metabolic pathways affected in SUM159 cells were in protein biosynthesis, nitrogen metabolism, and glycolysis. MDA-MB-231 and SUM159 cells displayed significantly different drug sensitivities to the various chemotherapeutic drugs tested. Figure 3 demonstrates that several chemotherapeutic drug treatments resulted in diverging metabolic changes in these two TNBC cell lines tested. Future studies will expand the panel of TNBC cell lines, as well as explore molecular mechanisms leading to the observed metabolic changes following chemotherapeutic drug treatment to better understand clinical outcomes and develop metabolic biomarkers of treatment response. High-resolution 1H MRS proved useful for identifying metabolic pathways that are altered following chemotherapeutic drug treatment in TNBC cells.Conclusion:
Triple negative breast cancer (TNBC) cells showed significant metabolic changes in protein biosynthesis, glycolysis, nitrogen metabolism, and choline metabolism, which were diverging in the two tested TNBC cell lines.Acknowledgements
We thank all members of the Division of Cancer Imaging Research in The Russell H. Morgan Department of Radiology and Radiological Science for their help and support.References
- Hirschey MD, DeBerardinis RJ, Diehl AME, et al. Dysregulated metabolism contributes to oncogenesis. Seminars in Cancer Biology. 2015;35:S129-S150.
- Hanahan D, Weinberg RA. Hallmarks of cancer: the next generation. Cell. 2011;144(5):646-674.
- Glunde K, Bhujwalla ZM, Ronen SM. Choline metabolism in malignant transformation. Nat. Rev. Cancer. 2011;11:835.
- DeBerardinis RJ, Chandel NS. Fundamentals of cancer metabolism. Science Advances. 2016;2(5):e1600200.
- Mishra P, Ambs S. Metabolic signatures of human breast cancer. Molecular & Cellular Oncology. 2015;2(3):e992217.
- Stewart DA, Winnike JH, McRitchie SL, Clark RF, Pathmasiri WW, Sumner SJ. Metabolomics Analysis of Hormone-Responsive and Triple-Negative Breast Cancer Cell Responses to Paclitaxel Identify Key Metabolic Differences. Journal of Proteome Research. 2016;15(9):3225-3240.
- Maria RM, Altei WF, Selistre-de-Araujo HS, Colnago LA. Impact of chemotherapy on metabolic reprogramming: Characterization of the metabolic profile of breast cancer MDA-MB-231 cells using 1H HR-MAS NMR spectroscopy. Journal of Pharmaceutical and Biomedical Analysis. 2017;146:324-328.
- Lee S, Kang S, Park S. Comparison of Metabolic Profiles of Normal and Cancer Cells in Response to Cytotoxic Agents. Journal of the Korean Magnetic Resonance Society. 2017;21.
- Reo NV. NMR-based metabolomics. Drug and Chemical Toxicology. 2002;25(4):375-382.
- Dona AC, Kyriakides M, Scott F, et al. A guide to the identification of metabolites in NMR-based metabonomics/metabolomics experiments. Computational and structural biotechnology journal. 2016;14:135-153.
Figures
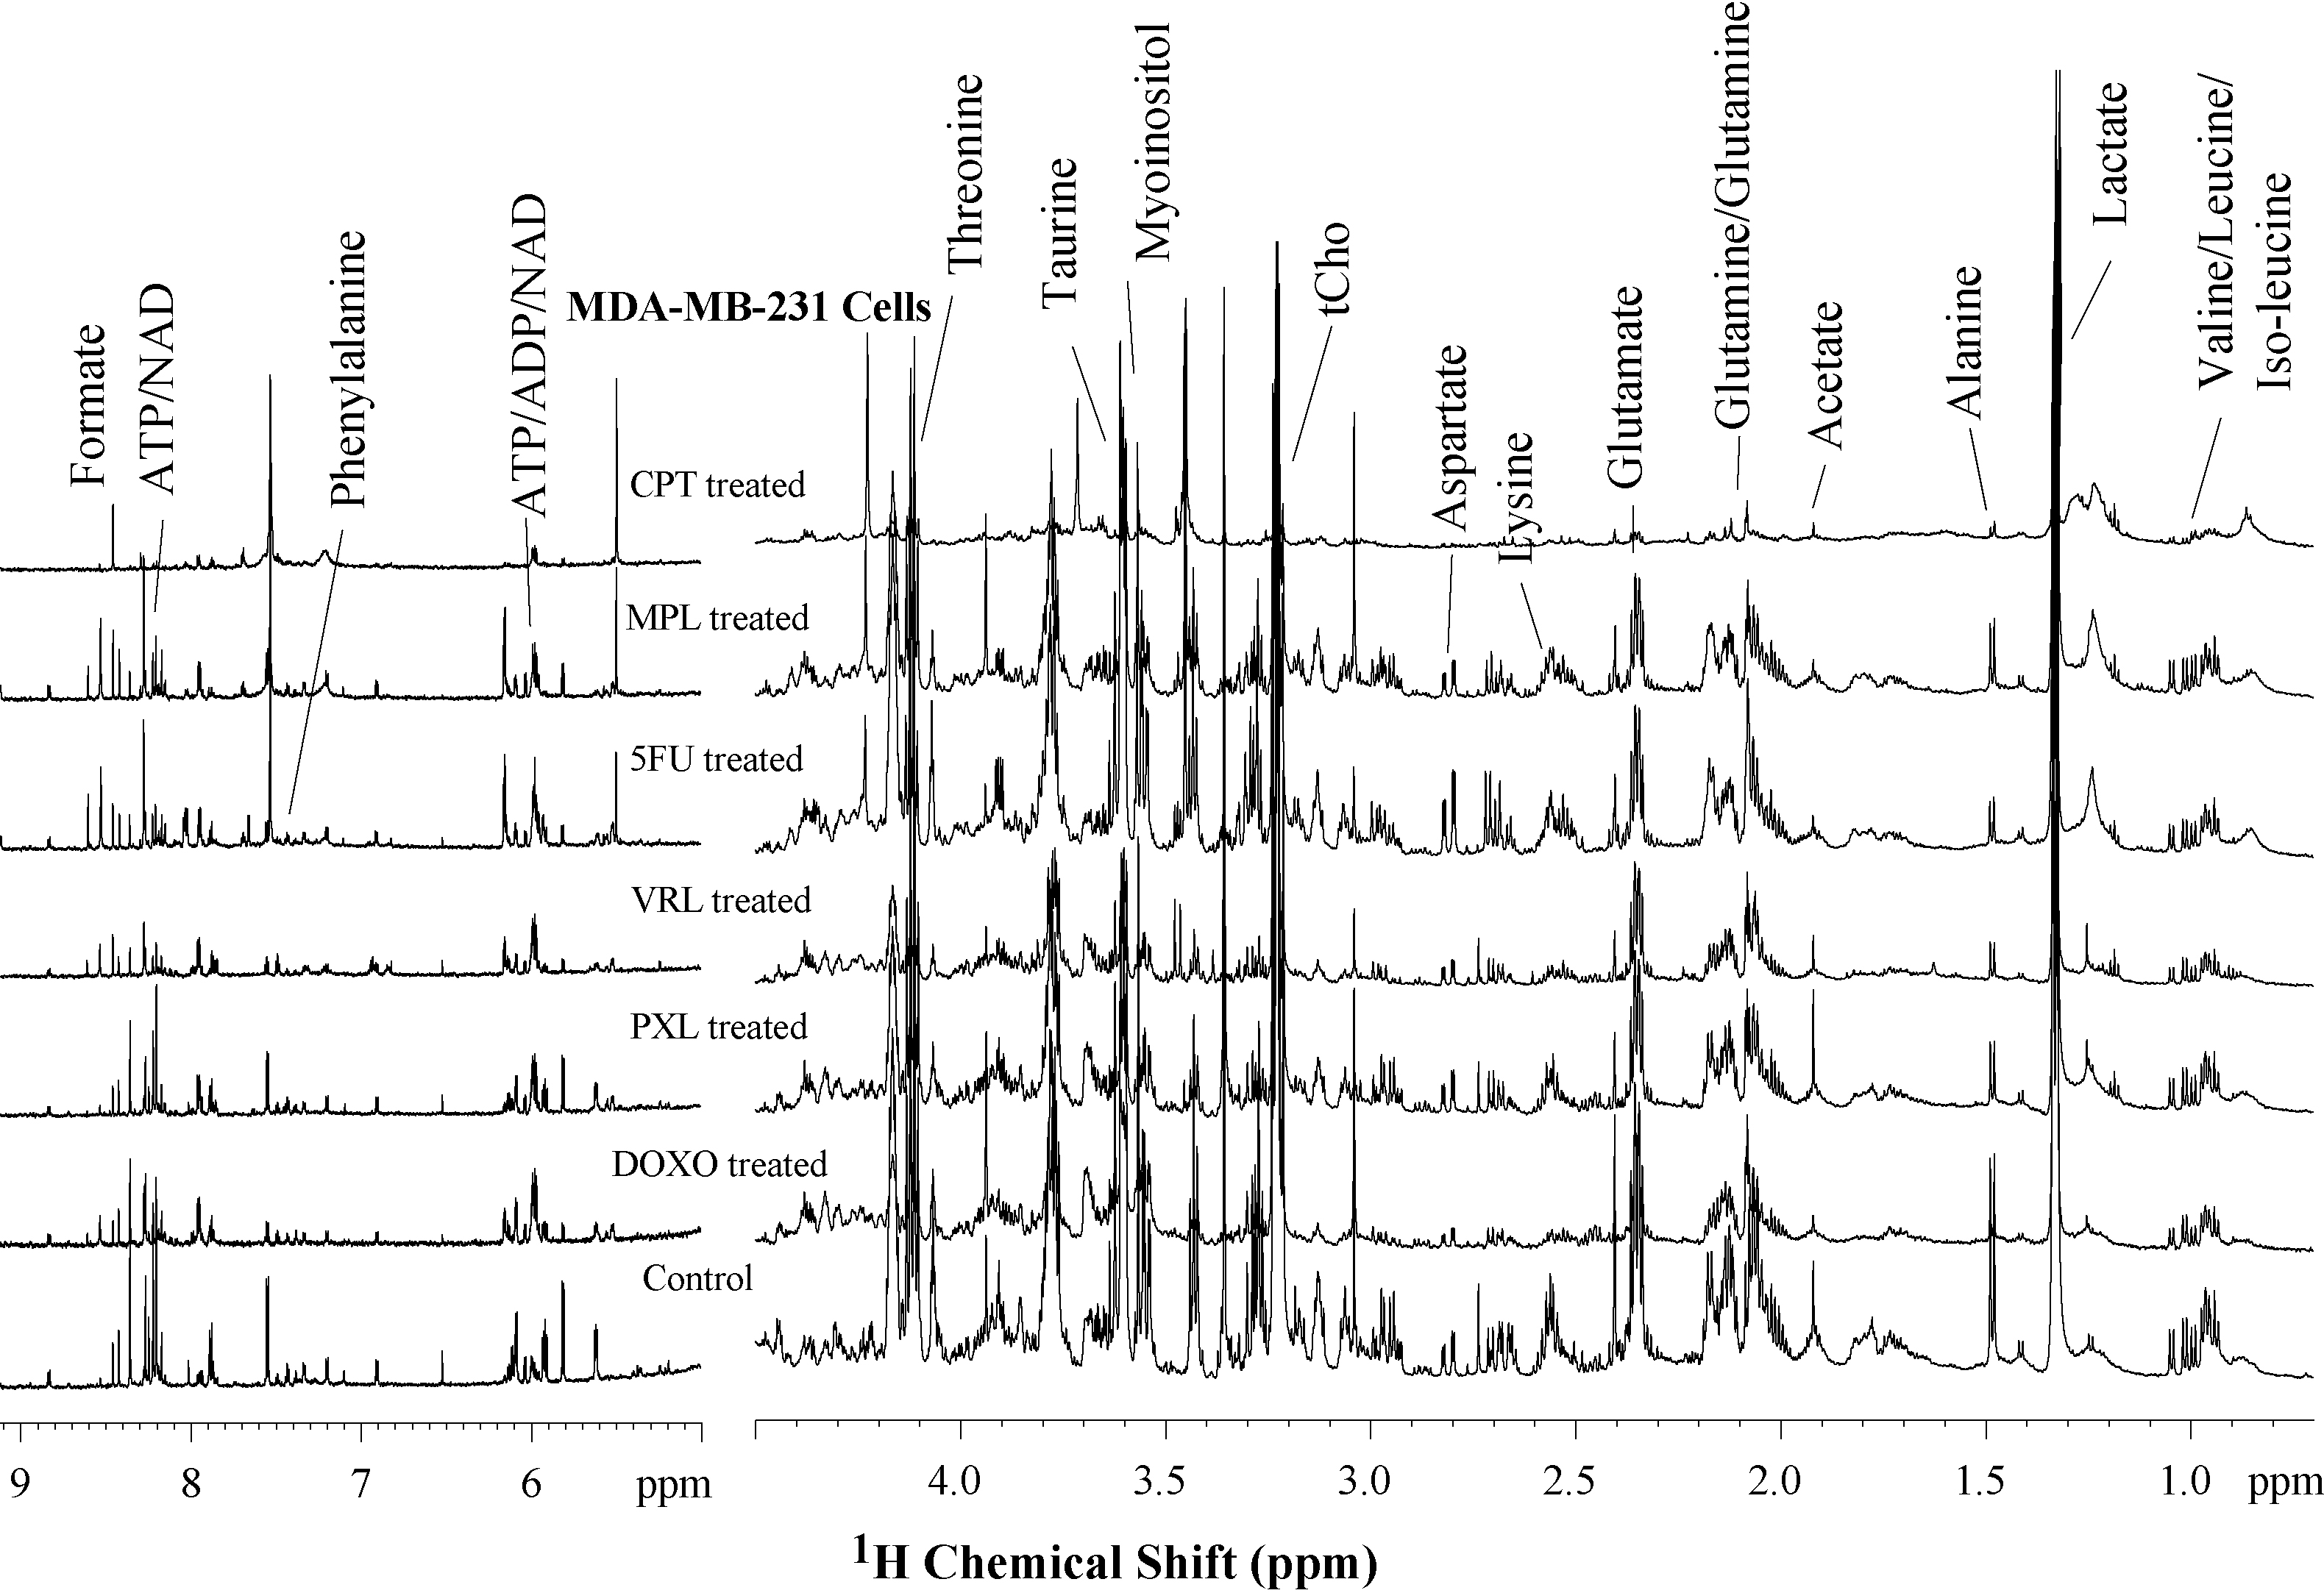
Representative high-resolution 1H MR spectra of aqueous phase
metabolites of MDA-MB-231 cells treated with six chemotherapeutic agents as
compared control. 1H MR spectra were acquired after 48 hrs of
treatment with doxorubicin (DOXO), paclitaxel (PXL), vinorelbine (VRL), 5-fluorouracil
(5FU), melphalan (MPL), or cisplatin (CPT). Metabolic profiles of MDA-MB-231
cells were significantly altered in response to these chemotherapeutic agents. (Abbreviation: tCho; total choline, ADP/ATP; adenosine di and triphosphate, NAD; Nicotinamide adenine dinucleotide)
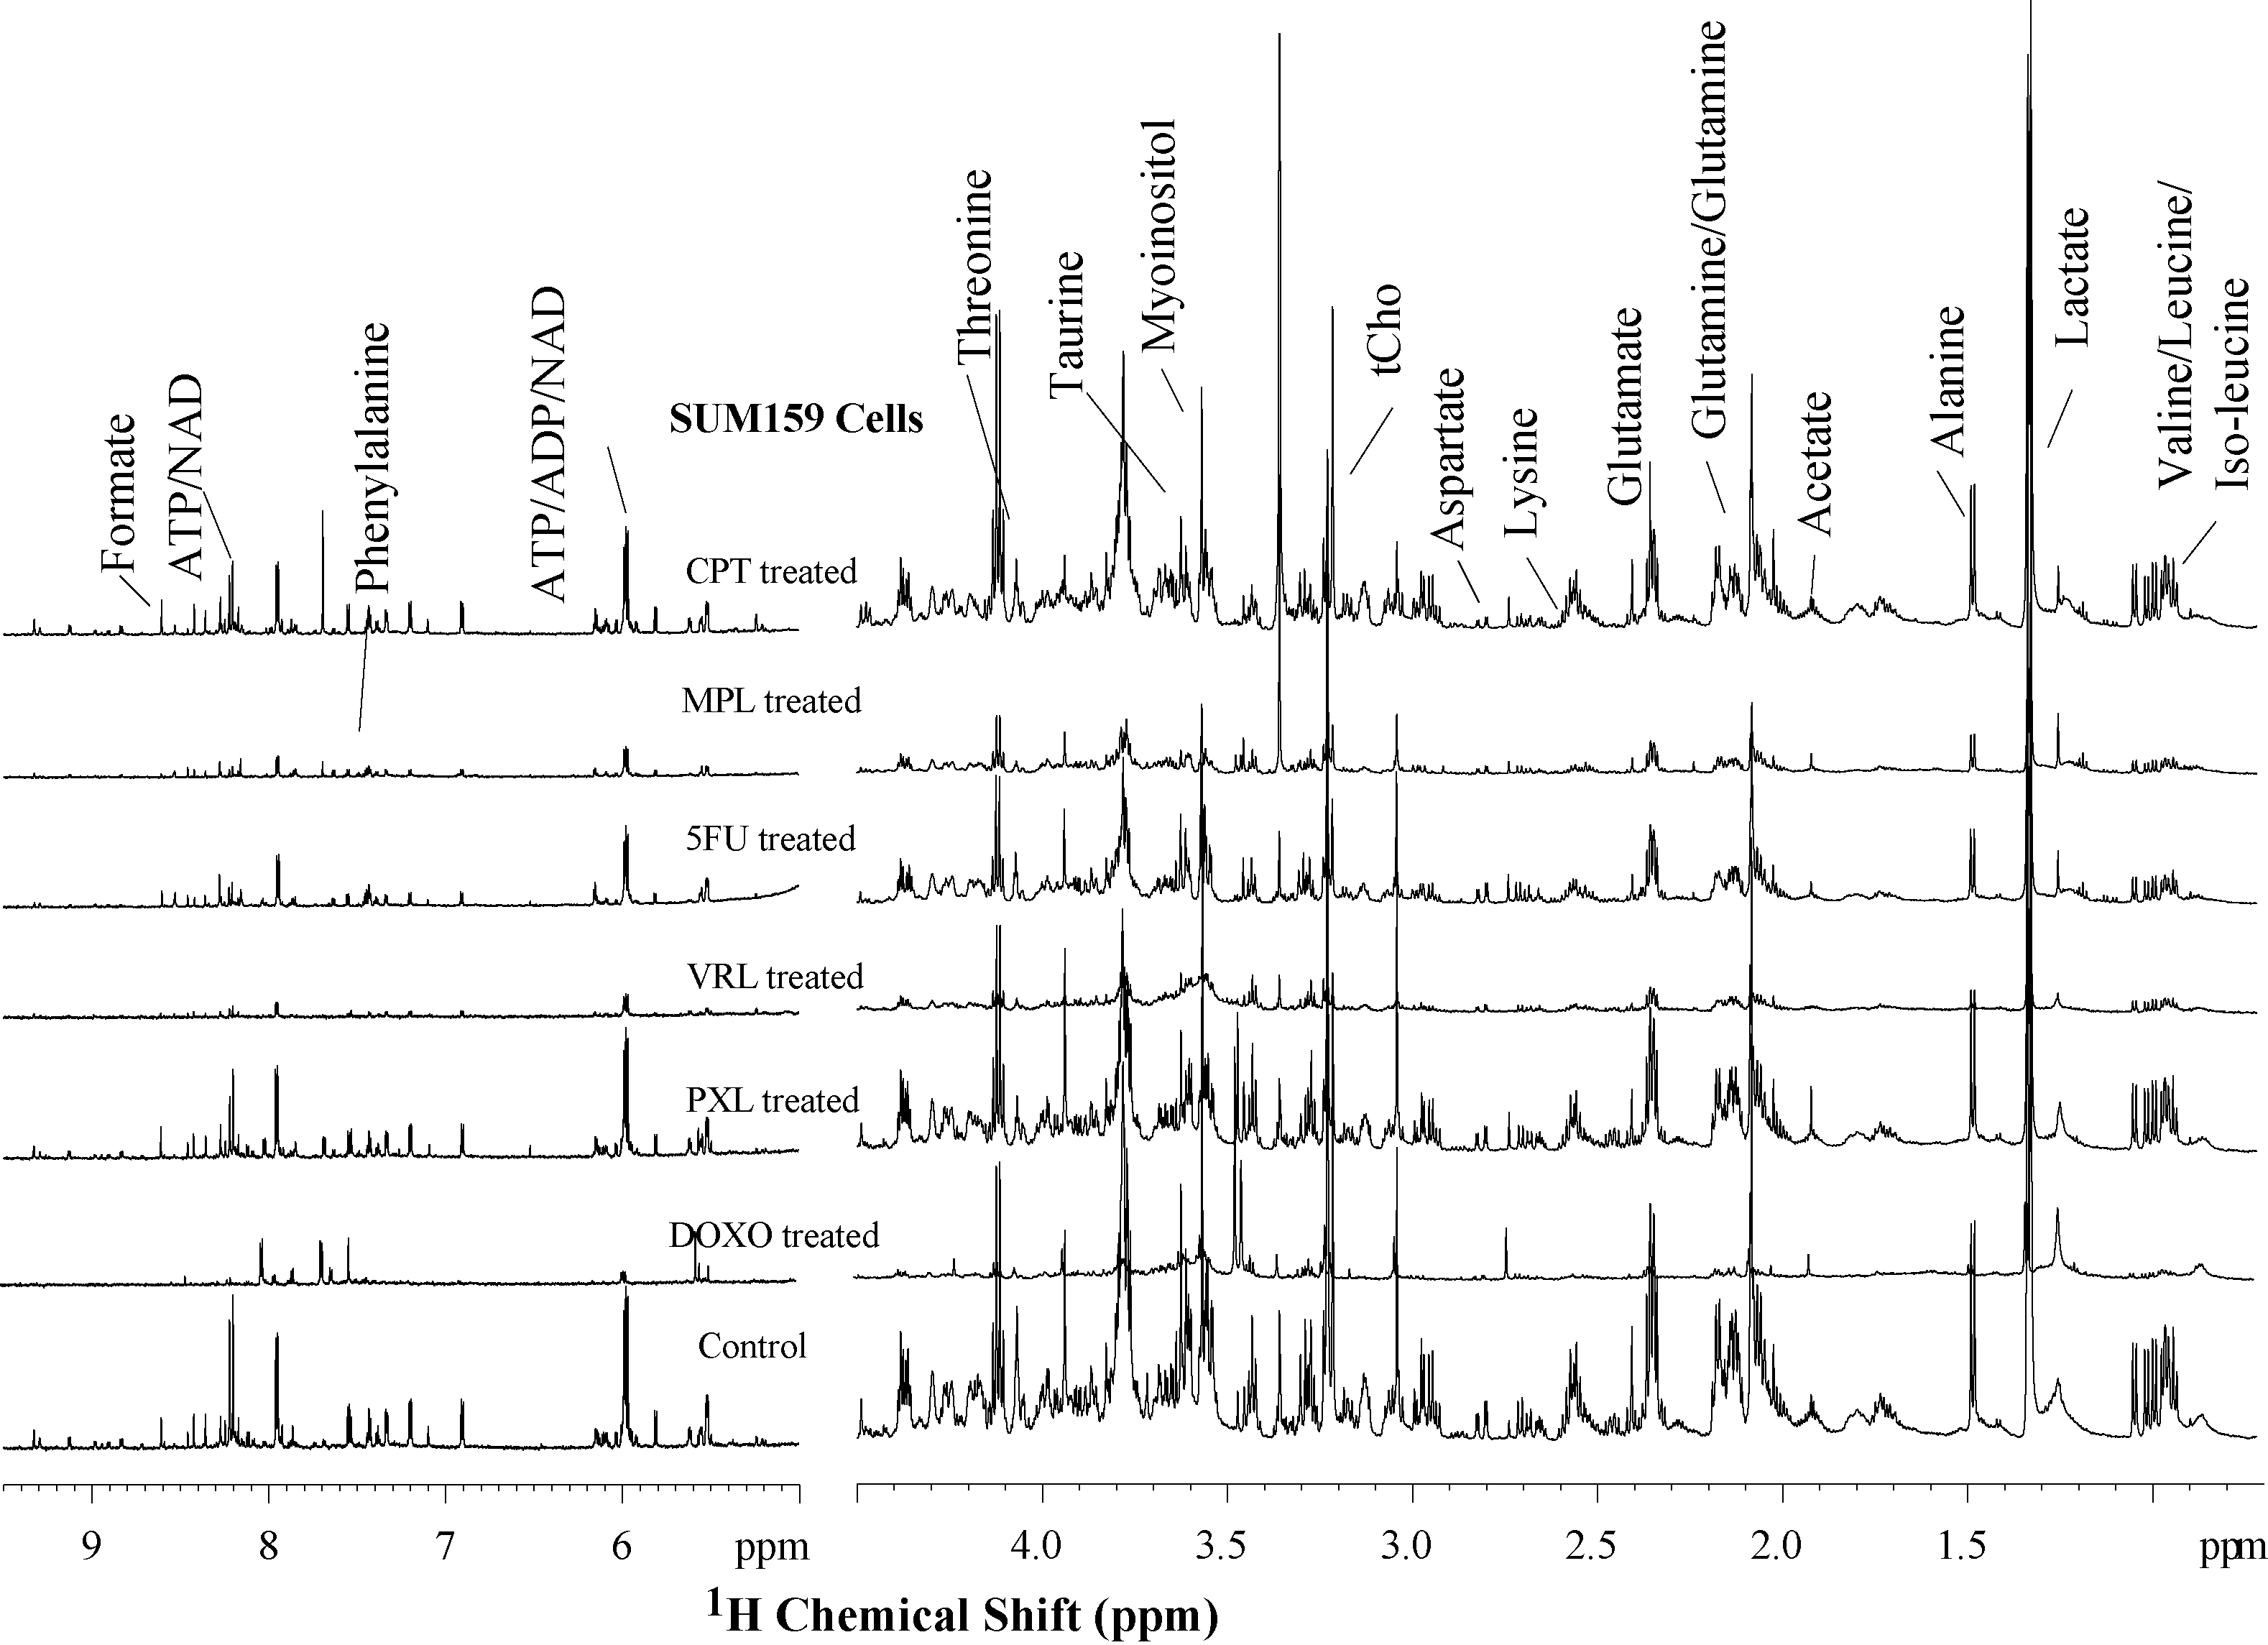
Representative high-resolution 1H MR spectra of aqueous phase
metabolites of SUM159 cells treated with six chemotherapeutic agents as
compared control. 1H MR spectra were acquired after 48 hrs of
treatment with doxorubicin (DOXO), paclitaxel (PXL), vinorelbine (VRL), 5-fluorouracil
(5FU), melphalan (MPL), or cisplatin (CPT). Metabolic profiles of SUM159 cells
were significantly altered in response to these agents. (Abbreviation: tCho; total choline, ADP/ATP; adenosine di and triphosphate, NAD; Nicotinamide adenine dinucleotide)
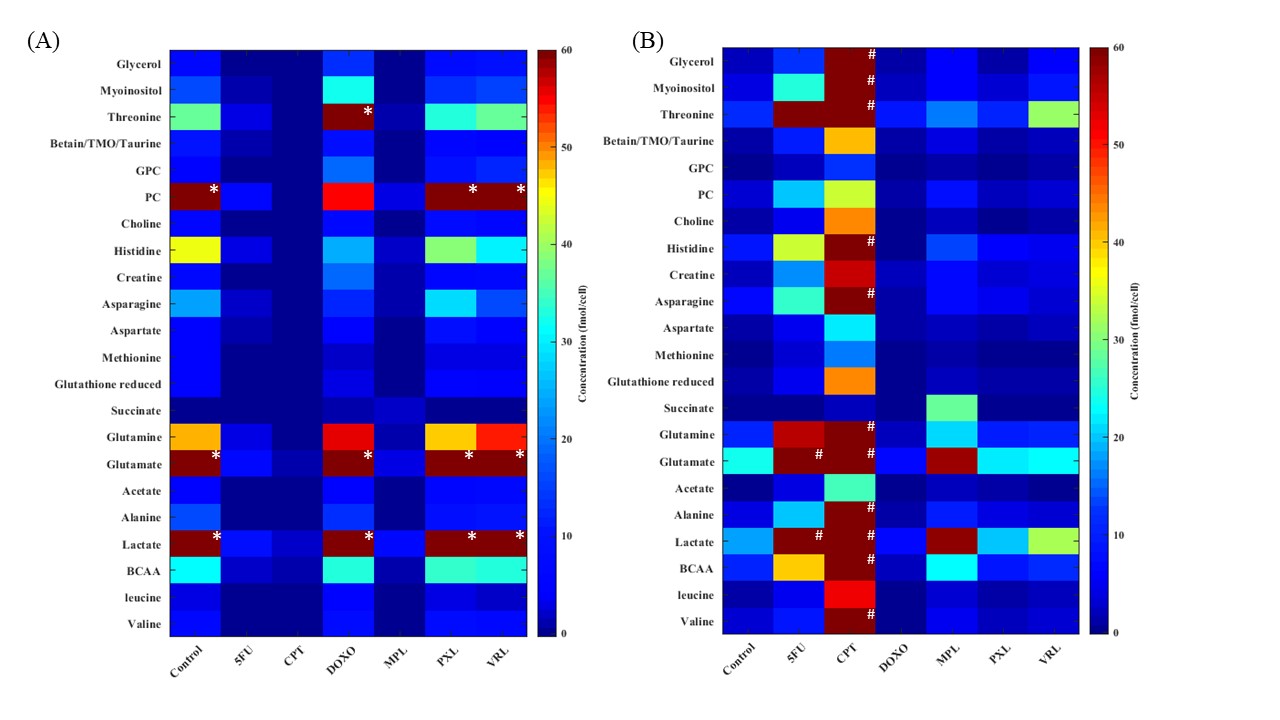
Metabolic
heatmap showing significant changes in metabolic profiles of (A) MDA-MB-231 and
(B) SUM159 TNCB cell lines treated with different chemotherapeutic agents. Each
column represents a treatment group (n=3) and each row represents a metabolite.
Due to the large dynamic range of some of the metabolites, it was not possible
to scale all metabolites in the same heatmap plot. Therefore a cut off value of
60 was used. All metabolites with concentrations higher than the cut
off value are marked as * in MDA-MB-231 cells and # in SUM159 cells. (Abbreviation: GPC; glycerophosphocholine)