0121
RF Power Deposition Optimization Algorithms for Thermal MR Targeting Human Brain Tumors1Berlin Ultrahigh Field Facility (B.U.F.F.), Max Delbrück Center for Molecular Medicine in the Helmholtz Association, Berlin, Germany, 2MRI.TOOLS GmbH, Berlin, Germany, 3Clinic for Radiation Oncology, Charité Universitätsmedizin, Berlin, Germany, 4Experimental and Clinical Research Center (ECRC), joint cooperation between the Charité Medical Faculty and the Max-Delbrück-Center for Molecular Medicine in the Helmholtz Association, Berlin, Germany
Synopsis
Ultrahigh field (UHF) MR employs higher radio frequencies (RF) than conventional MR and has unique potential to provide focal temperature manipulation and high resolution imaging (ThermalMR). The advantage of integrated therapy monitoring allows the consideration of thermal interventions in brain tumor treatments. Optimization algorithms used to confine the RF power deposition to the target volume (TV) are under constant revision. This work compares three in-house developed optimization algorithms with the focus on power delivery to the target volume as well as sparing of the healthy tissue with a more commonly available approach.
Introduction
Hyperthermia has proven beneficial as an adjunct treatment of Glioblastoma Multiforme (GBM)1. Advances in RF based hyperthermia have evoked developments in the designs of annular2,3 or helmet shaped4 RF applicators for the treatment of brain tumors. Optimization algorithms used to confine the RF power deposition to the target volume (TV) are under constant revision to ensure increased RF exposure in the tumor volume while reducing the burden on the surrounding healthy tissue5,6. In this context, this work compares four optimization algorithms designed for thermal intervention in the treatment of GBM at 297MHz. Given the high risk location of the tumor, strict exposure limits are set for the healthy surrounding tissue. Three in-house developed algorithms with the goal of maximizing the total RF power delivered to the TV under different constraints are compared to a more established optimization process aiming at a maximum SAR amplification factor, the ratio between average exposures in the target volume vs. healthy tissue7.Methods
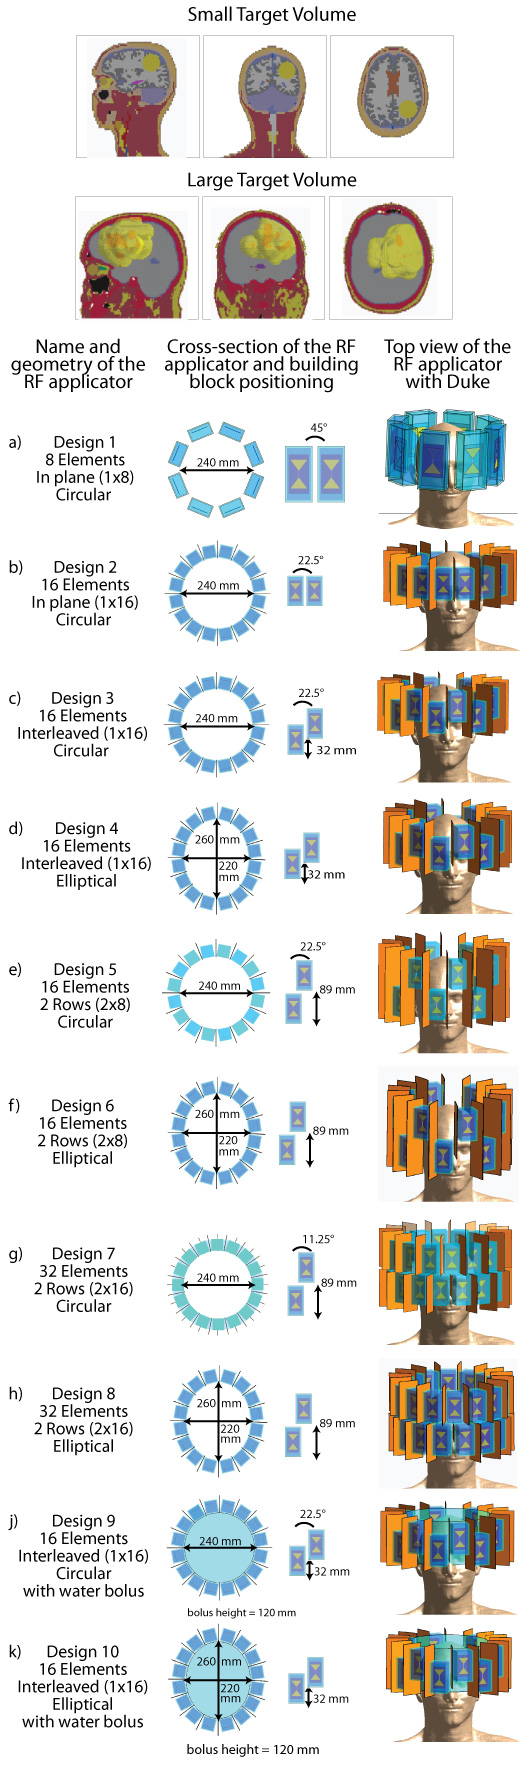
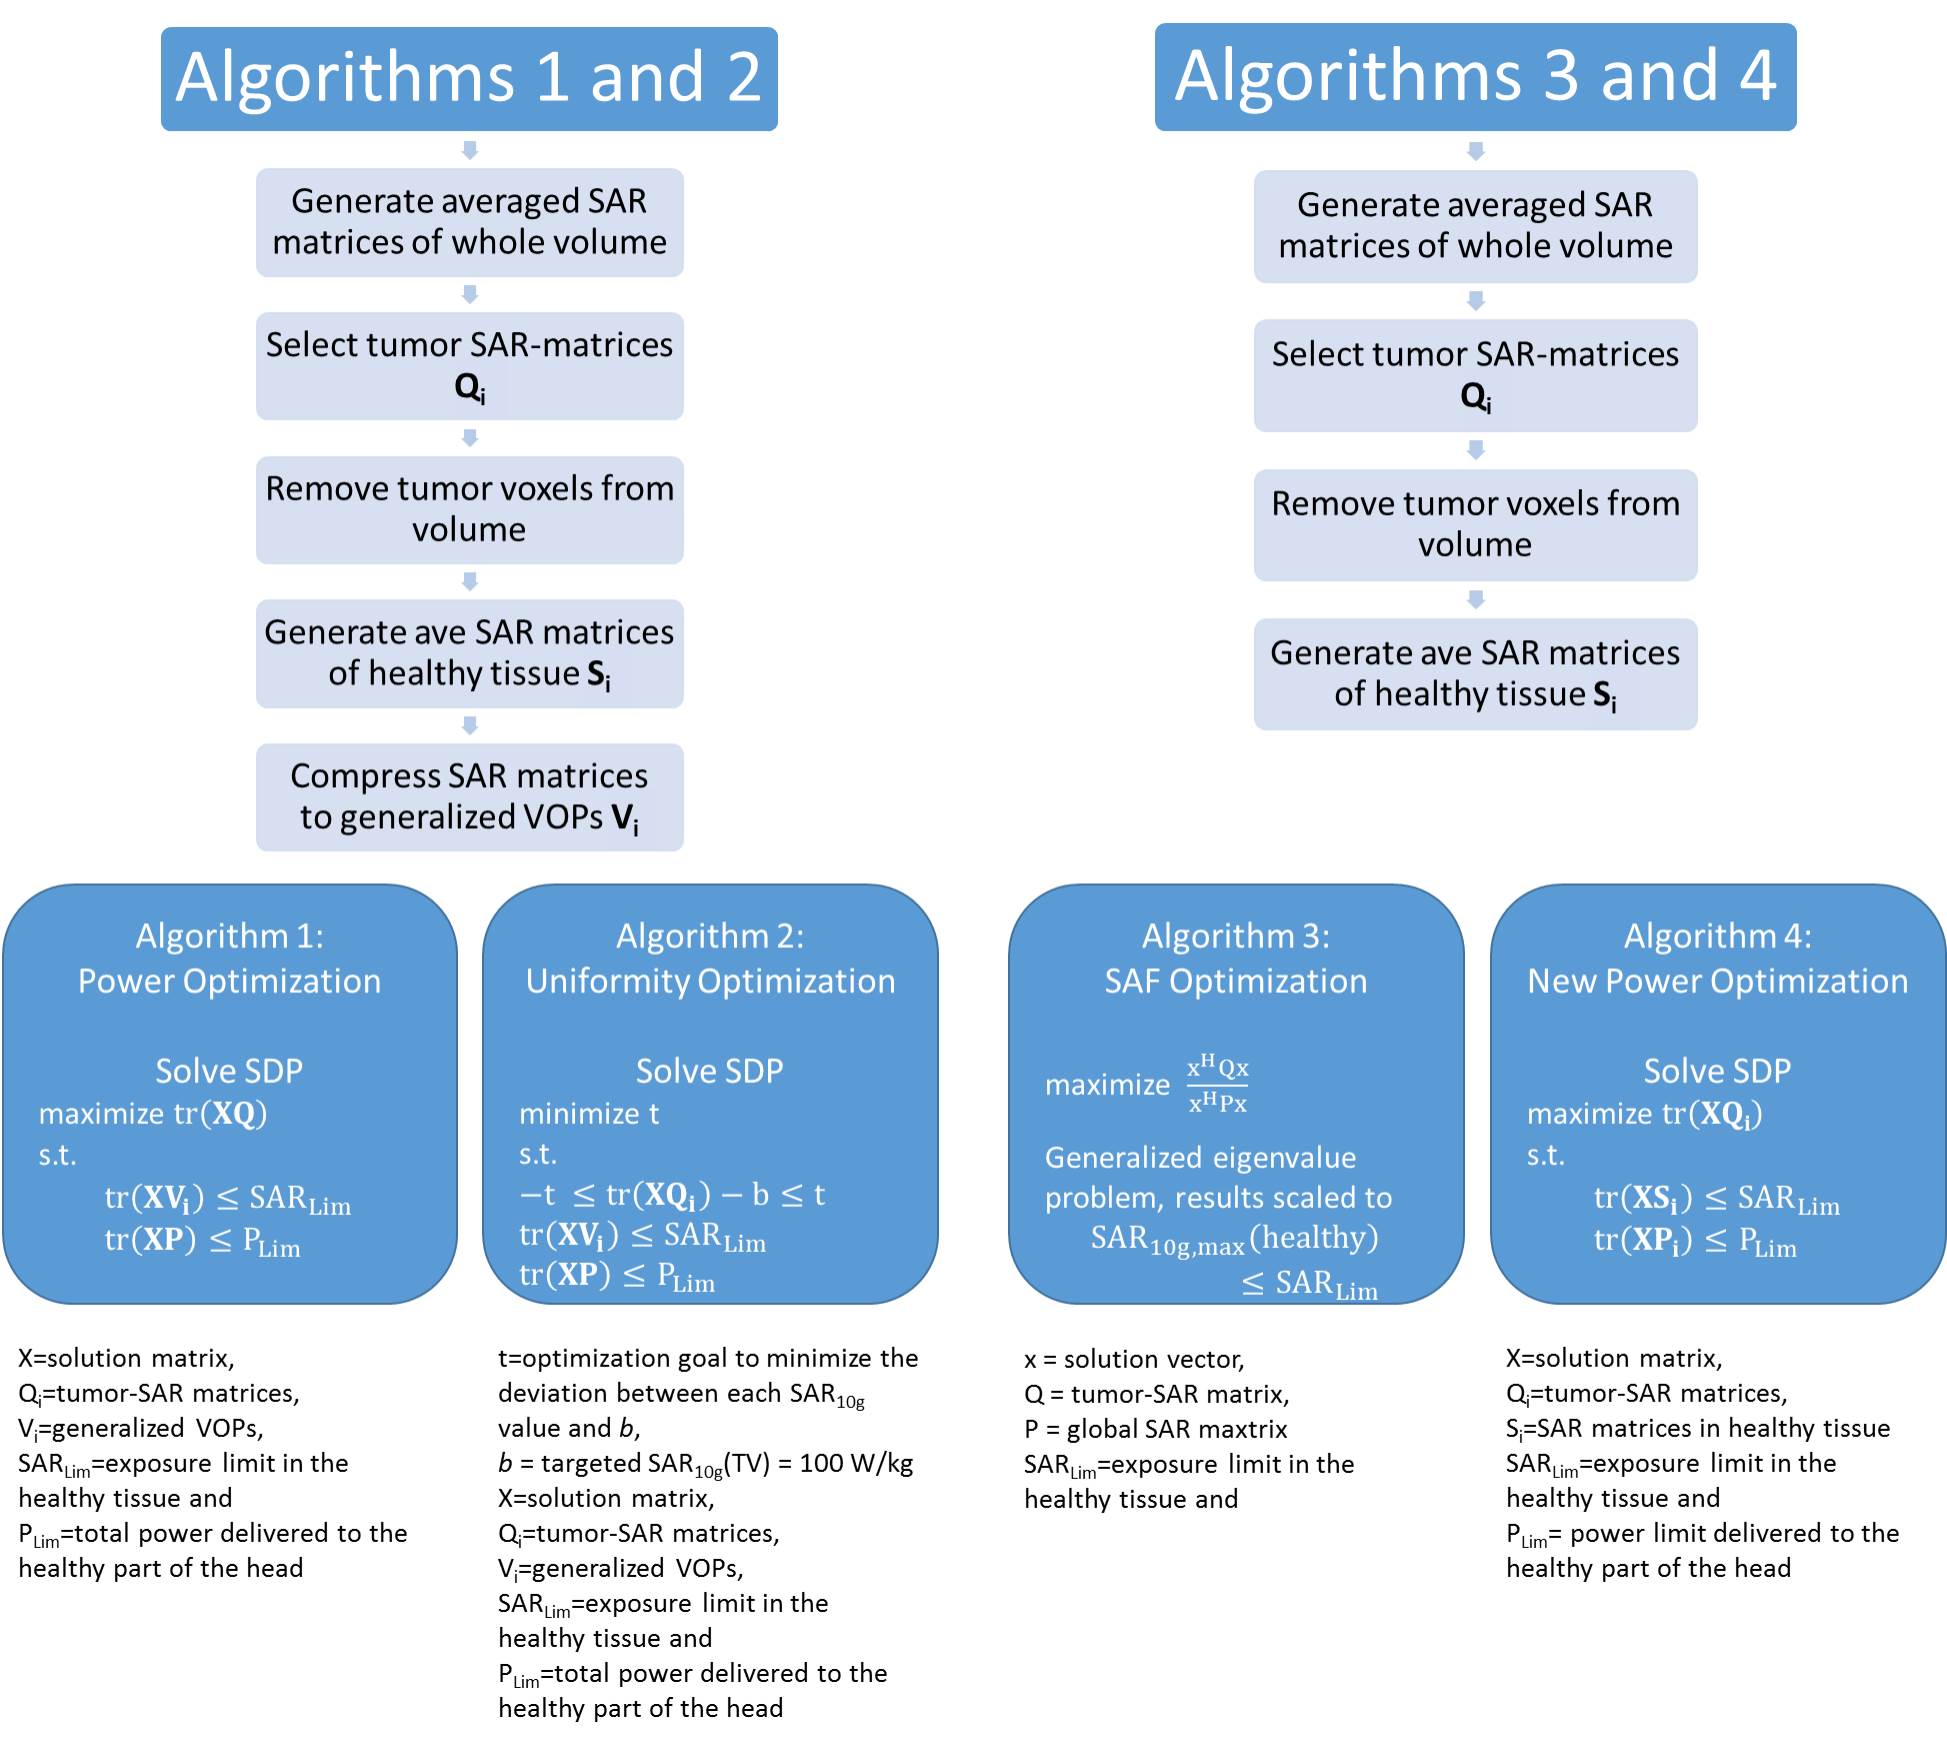
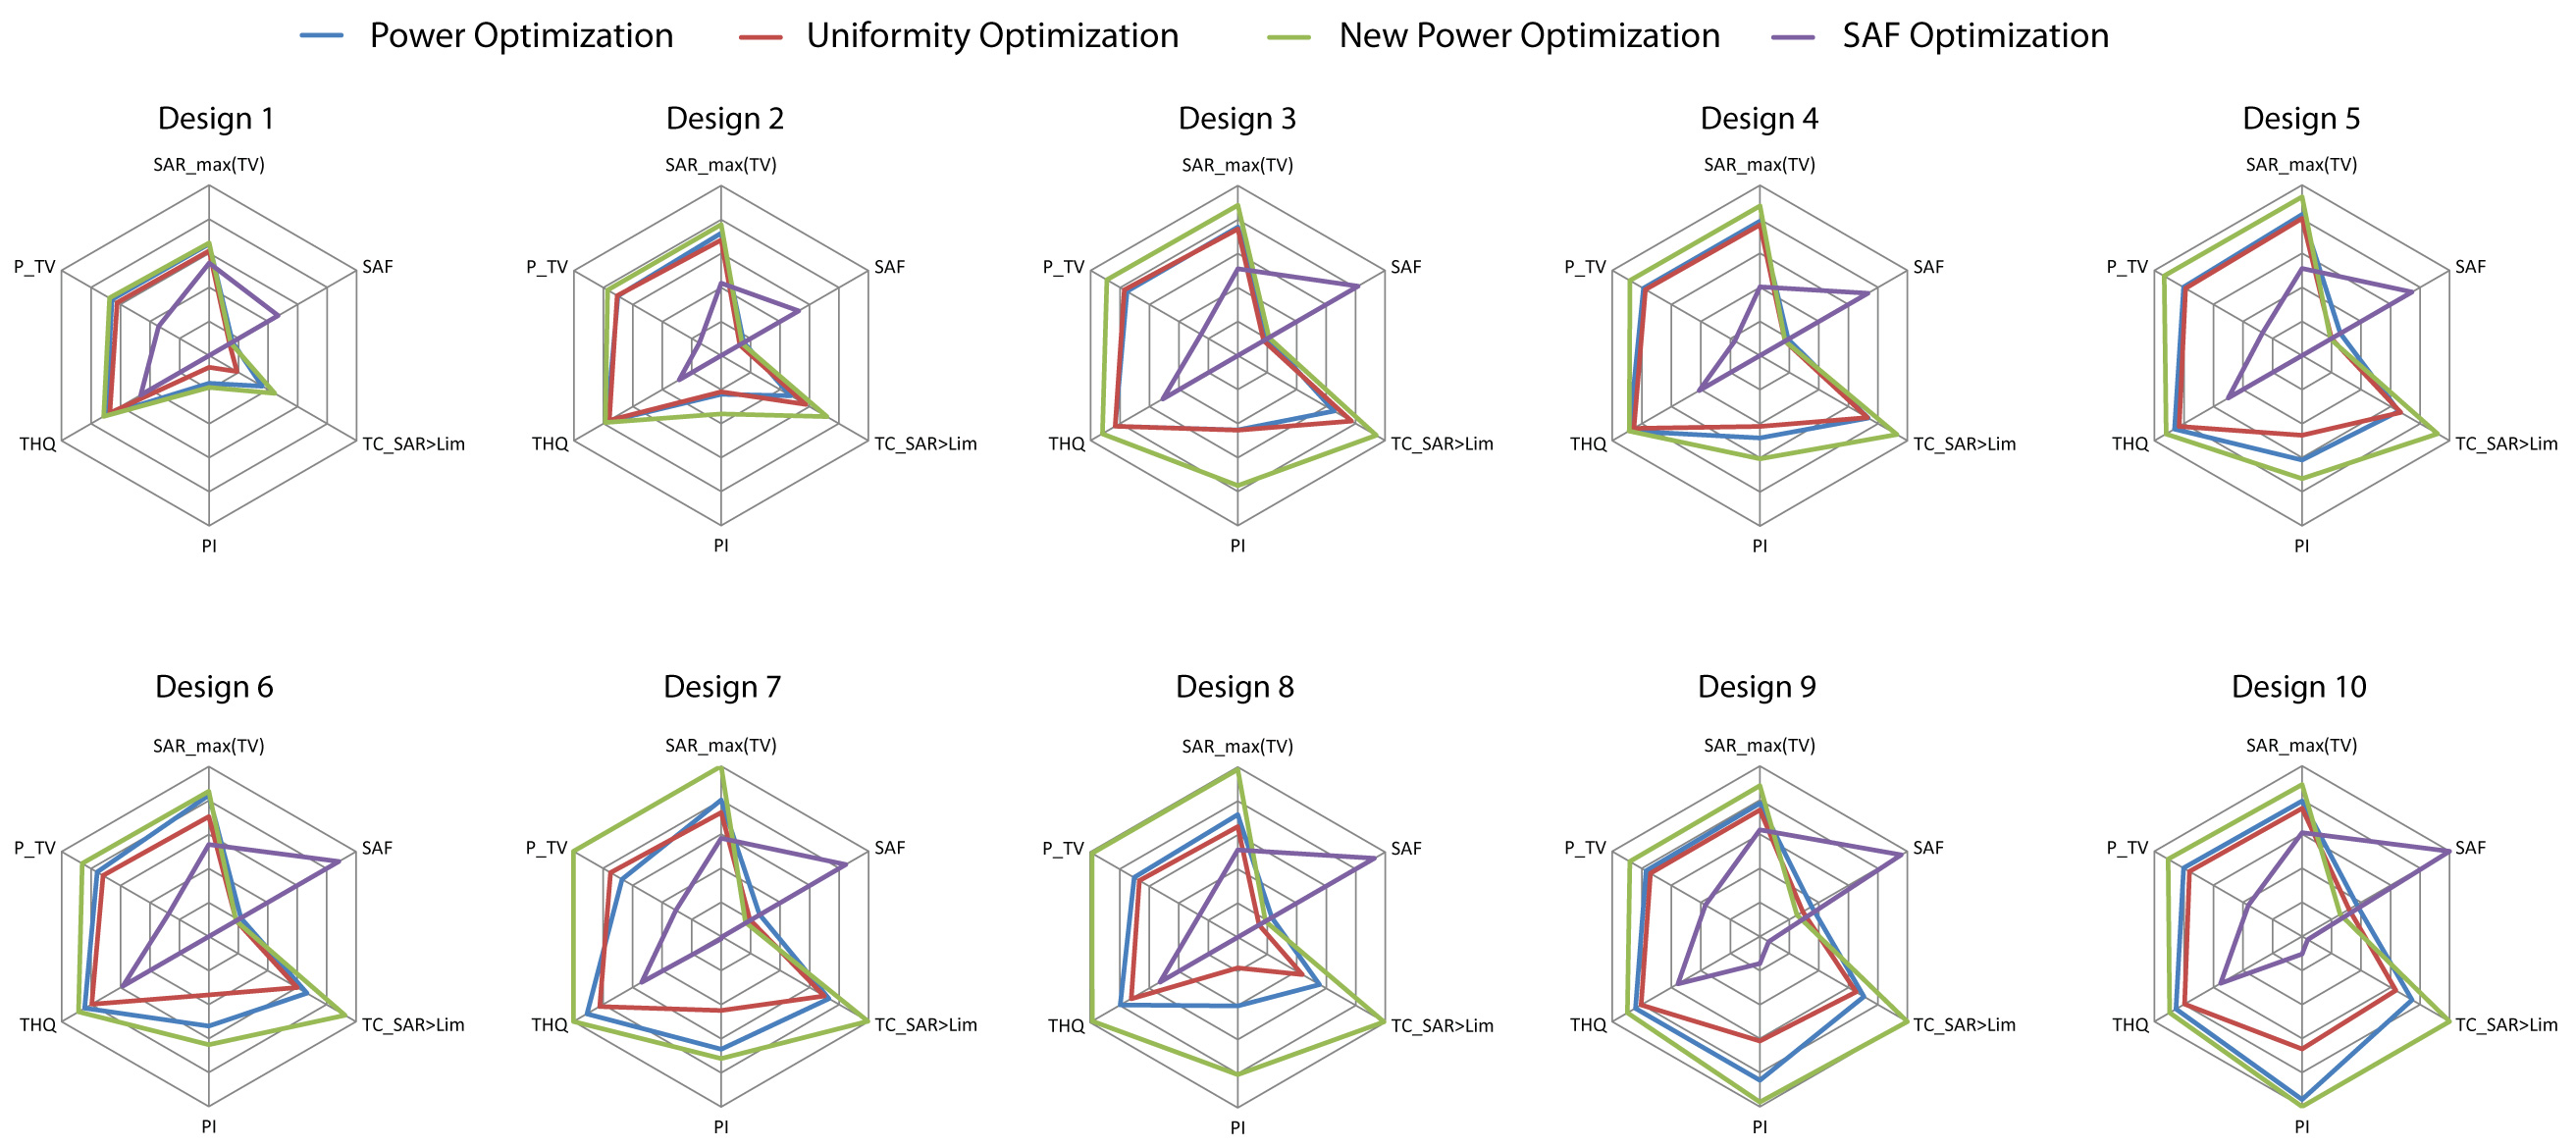
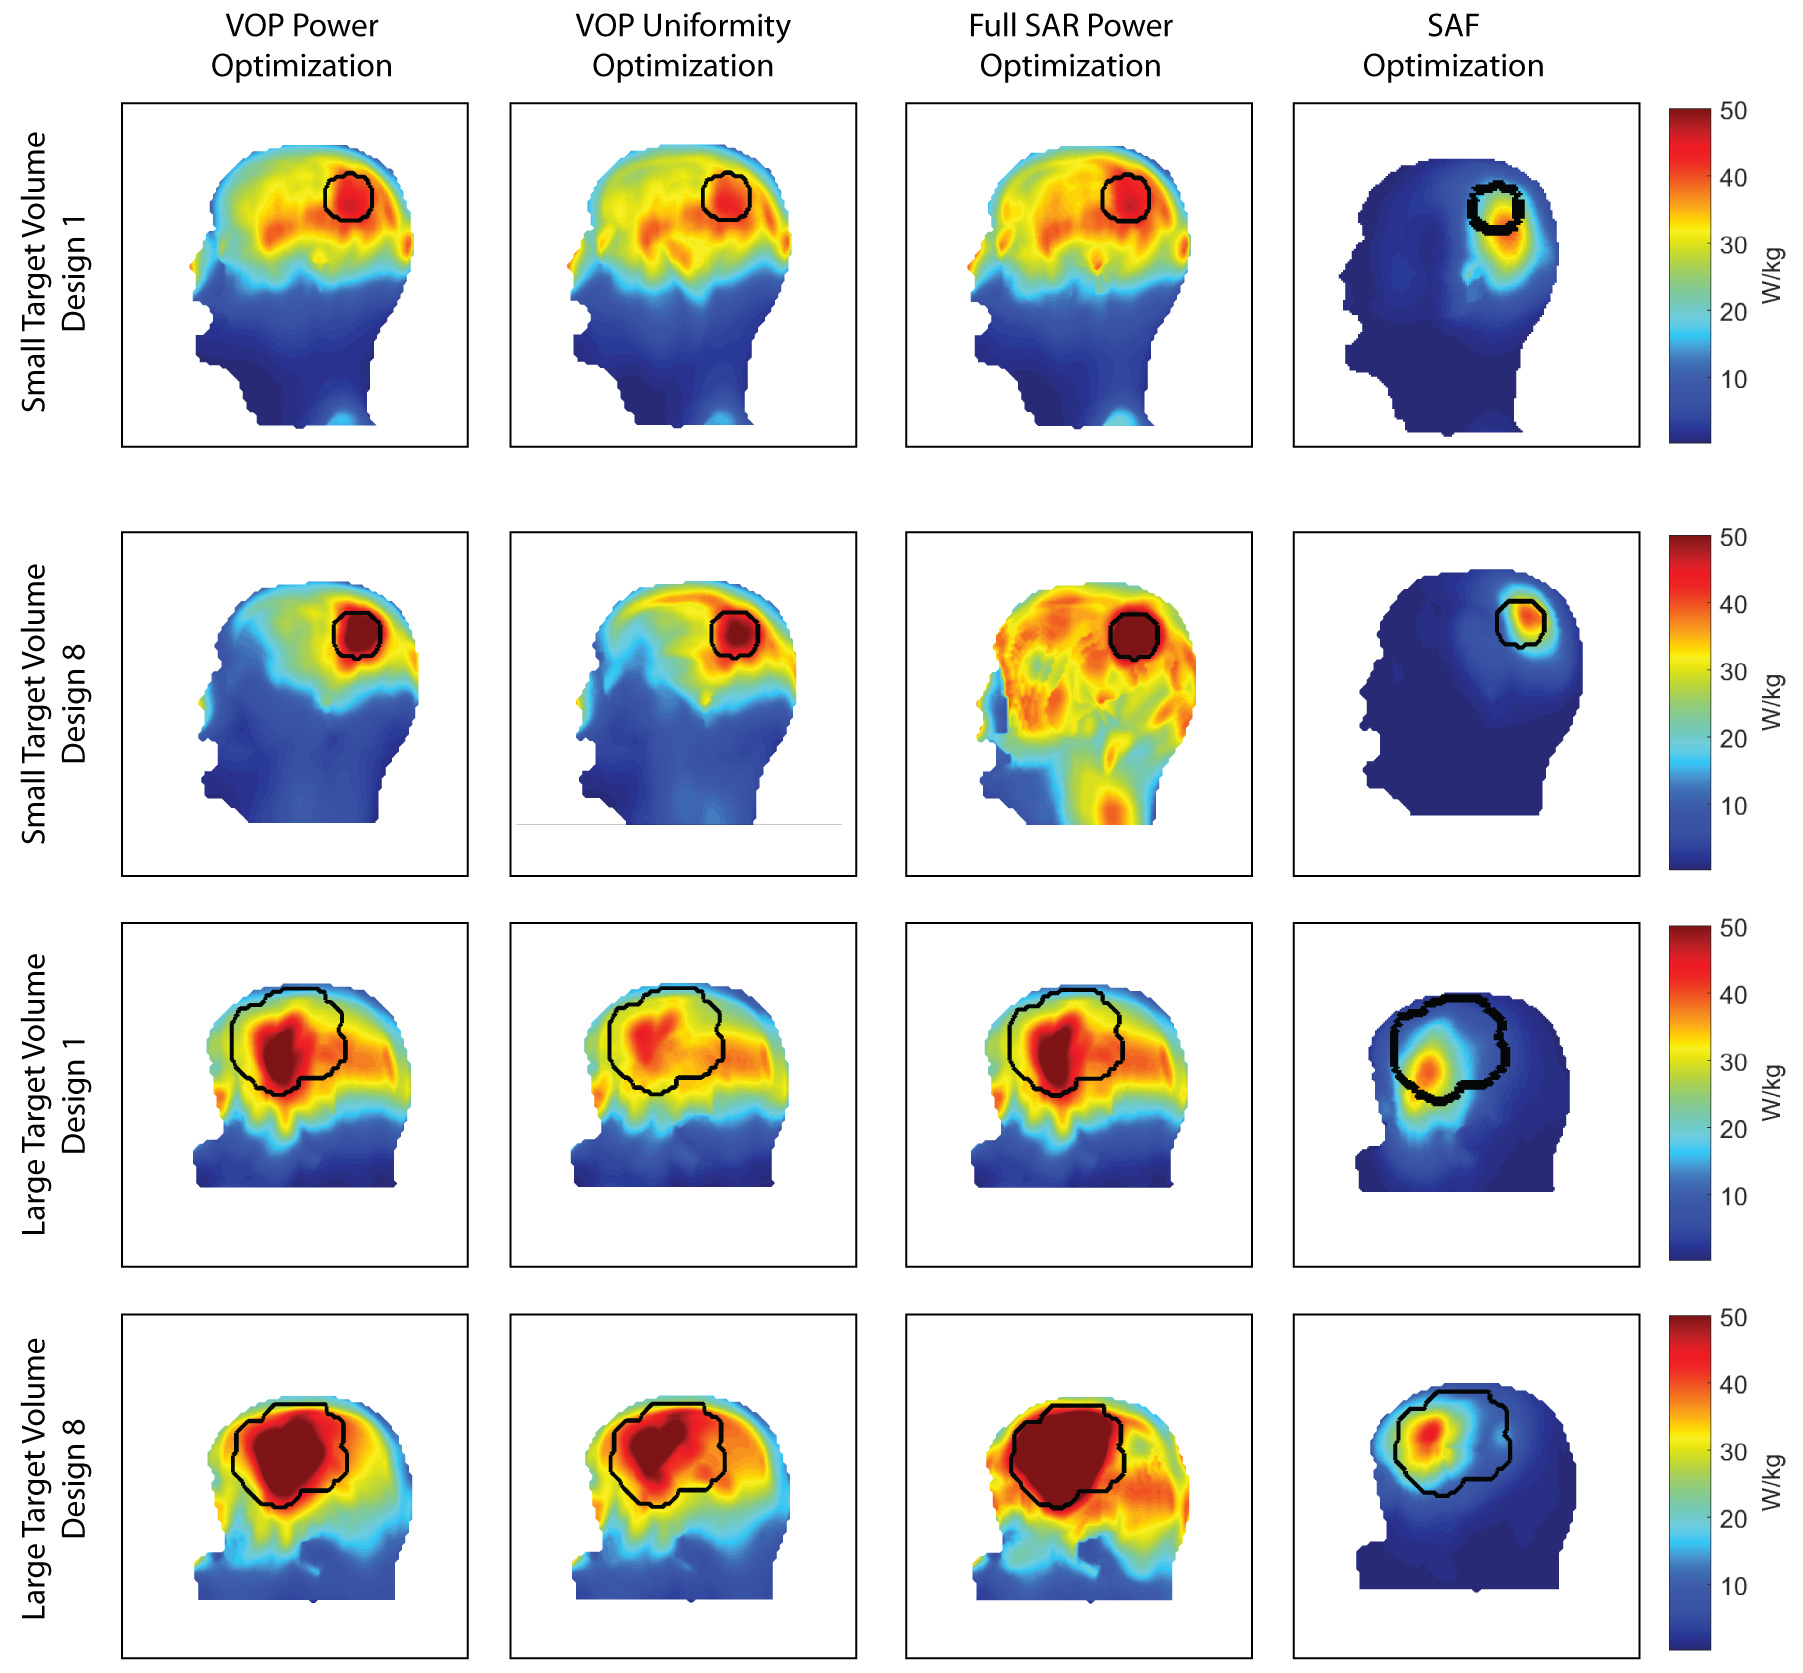
This work compares the energy deposition obtained by four optimization algorithms tailored for thermal intervention planning targeting brain tumors at 297MHz. For this purpose two head models were implemented, challenging a) the focusing capabilities of the algorithms by limiting the TV to a spherical volume (TV=33.5ml, Ø=4cm) and b) the distribution of the energy by selecting a patient derived head model (TV=500ml, bounding box: 10.3x10.3x9.2cm³). Both head models were simulated for various ThermalMR RF applicator configurations8 (Fig.1). Electromagnetic field (EMF) simulations were performed using Sim4Life9. From the channel-wise E- and H-field data, SAR10g10 matrices were calculated11.For phase and amplitude optimization, three algorithms with the optimization goal to maximize total RF power absorption in the TV were developed. For algorithms 1 and 212, this is built upon the calculation of virtual observation points (VOPs)13. For algorithm 1, maximizing the total RF power delivered to the TV (PTV) is the sole optimization goal (further: VOP Power Optimization) while algorithm 2 has the additional constraint to homogenize the power distribution over the TV by minimizing the deviation of the local SAR10g from a chosen target value, allowing trade-off between peak values and uniformity (further: VOP Uniformity Optimization). For both algorithms, the overestimation introduced to enable VOP compression is partially relieved by recalculating the current value of the constrained parameters by combining the non-compressed field data with the obtained phase setting. After comparison to the given limits, the field data are scaled accordingly. The recently implemented algorithm 3 runs without the need for VOP compression, based on the full uncompressed SAR matrix set (further: Full SAR Power Optimization). These results were benchmarked against a previously proposed algorithm to maximize the SAR amplification factor (further: SAF Optimization). The mathematical details are shown in Fig.2.
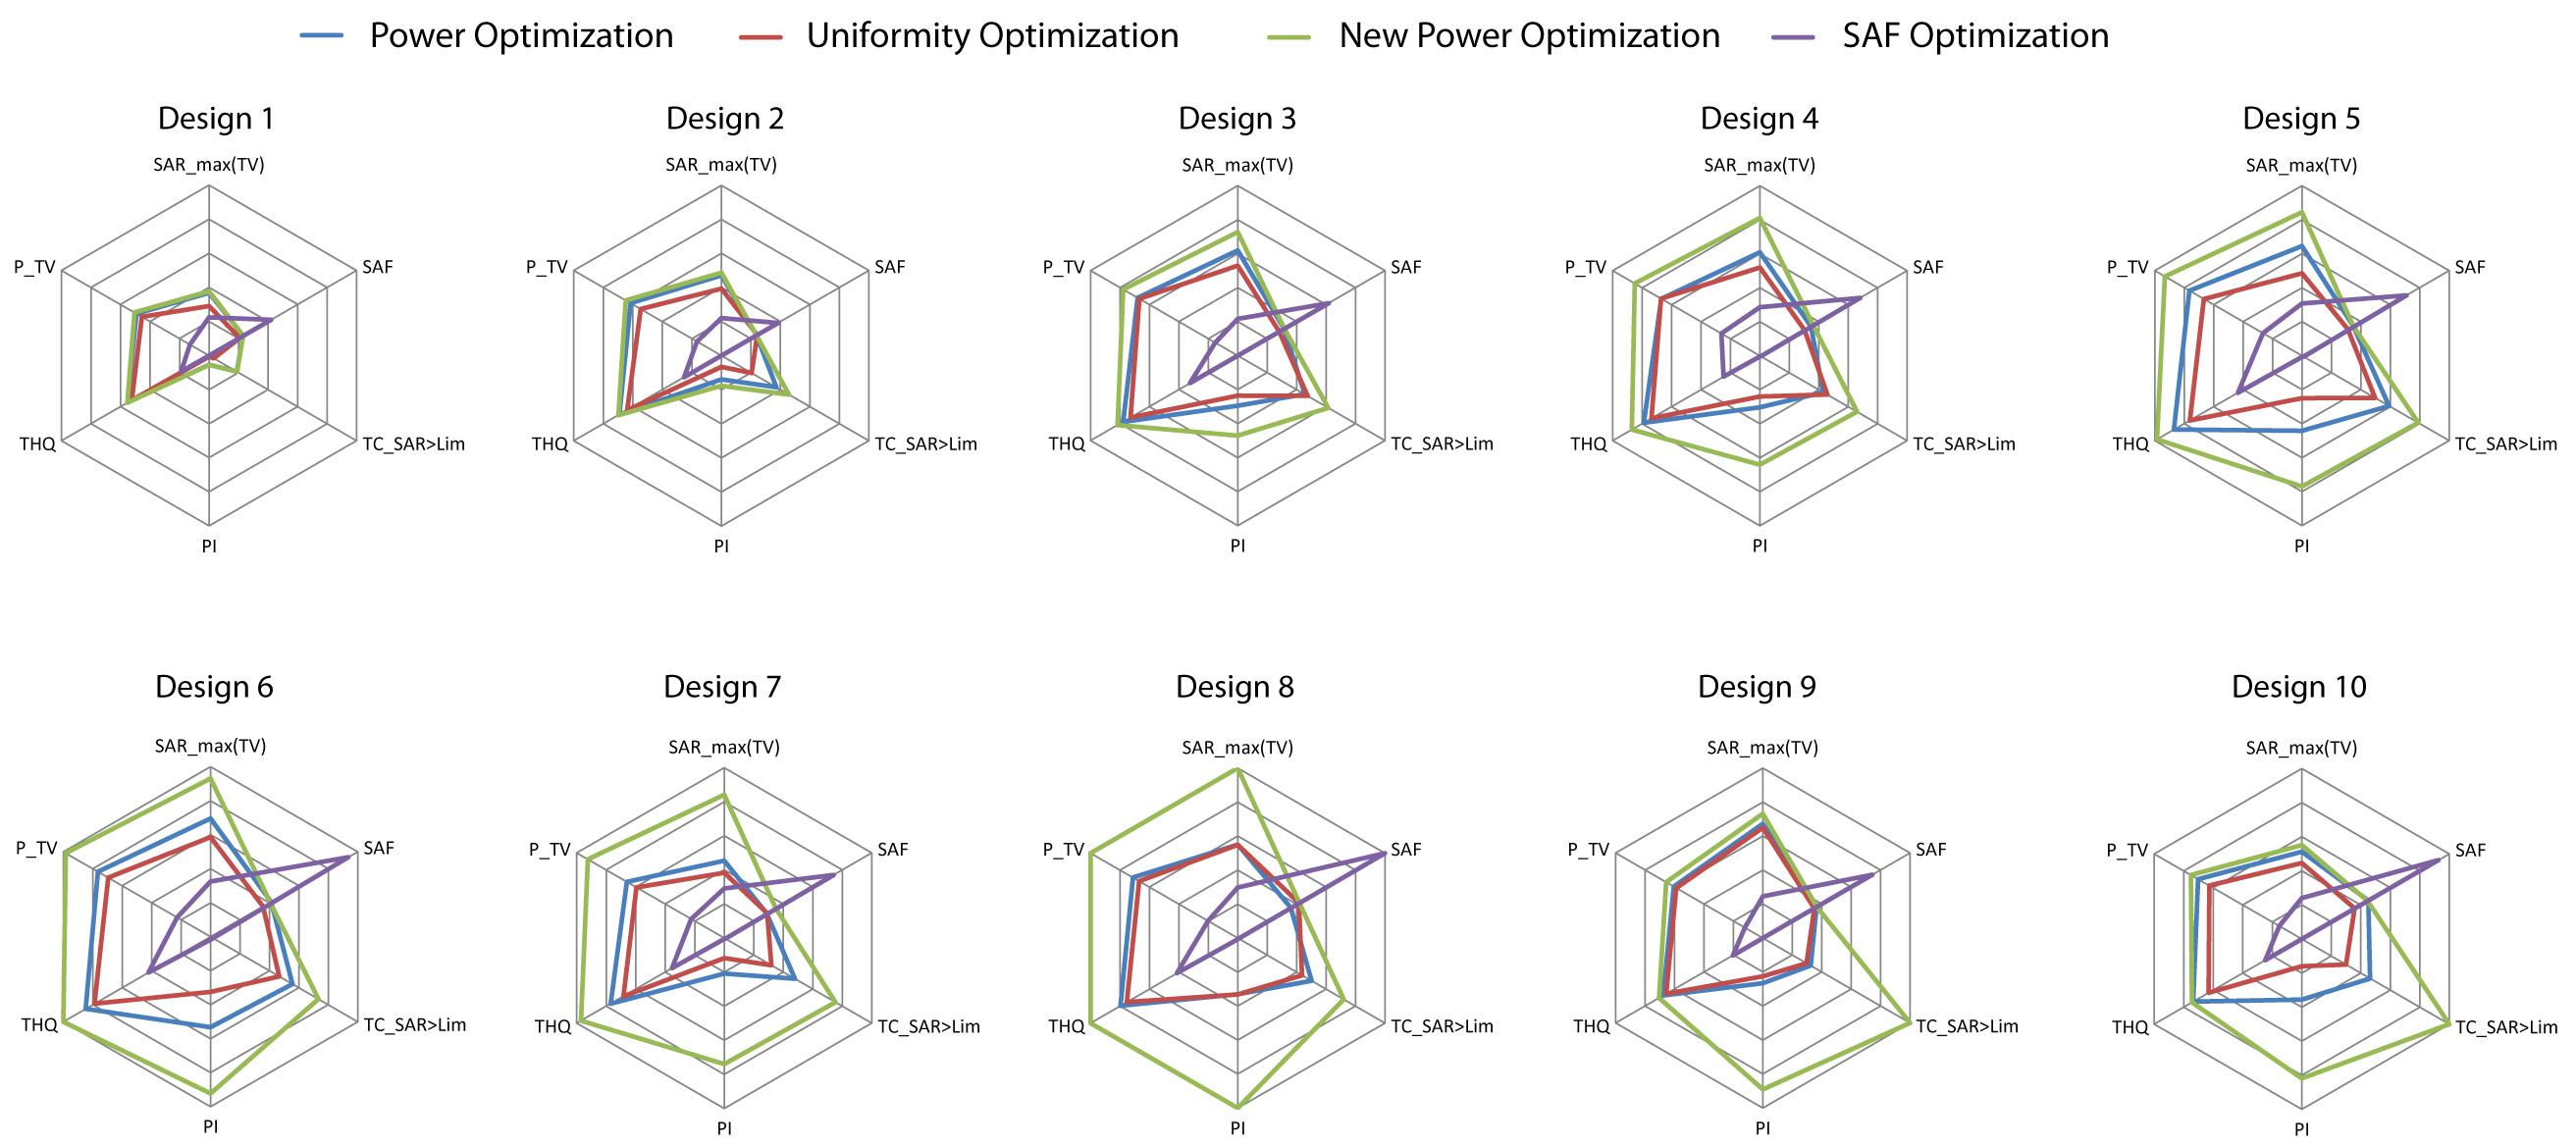
For all algorithms, the SAR exposure of the healthy tissue was limited to 40W/kg. For performance assessment, SAR10g,max(TV), SAF, the target coverage with a higher SAR than allowed in the healthy tissue TCSAR>Lim, the performance indicator PI=SAR10g,max(TV)·SAF·TCSAR>Lim7, the target to hotspot quotient THQ and PTV were determined.
Results & Discussion
For both head models, VOP Power Optimization outperformed VOP Uniformity Optimization, often even for TCSAR>Lim, as shown in Fig.3 for the small TV and Fig.4 for the large TV. In cases where a larger coverage of the TV is achieved, the increase was not significant enough to counter the lower peak SAR despite the high target-SAR of 100 W/kg. Also, the smearing of the RF exposure results in a higher exposure of healthy tissue, decreasing SAF and THQ. Despite our measures to eliminate the SAR overestimation for the VOP compression, the VOP-free Full SAR Power Optimization always outperforms VOP Power Optimization as well as VOP Uniformity Optimization. SAF optimization is by definition not designed to maximize/limit local RF exposure but rather average RF exposure in the TV/healthy tissue respectively. Restraining it by limiting SAR10g,max(healthy) will thus not change the SAR10g distribution but only downscale the delivered power until SAR10g,max(healthy) is no longer exceeded. This resulted in SAFs much higher than achieved with the proposed optimization algorithms with far too low TV exposure levels to induce significant temperature increase for thermal intervention in SAF optimization. An exemplary comparison with the most and least significant improvement throughout the optimization development is displayed in Fig.5 for both TVs.Conclusion
To conclude, adding the RF exposure limit for healthy tissue to the optimization algorithm allows for more sophisticated RF power distribution reaching much higher peak and average SAR10g in the TV. While the SAF Optimization followed its purpose in all cases, local SAR maxima outside of the TV reaching similar values than inside cannot be tolerated for treatment of high risk areas such as the brain. Among the constrained algorithms, the Full SAR Power Optimization approach clearly outperforms the VOP Power Optimization and VOP Uniformity Optimization. Being not in the need of VOPs makes this algorithm more accurate and much faster, decreasing actual optimization time to less than 1 minute for each case. This makes this algorithm ideal for the investigation of other patient derived head models and RF applicator designs. This is an encouraging finding towards on-site treatment planning in a feedback loop with MR thermometry used for treatment monitoring.Acknowledgements
This project has received funding from the European Research Council (ERC) under the European Union's Horizon 2020 research and innovation program under grant agreement No 743077 (ThermalMR).References
1. Sneed, P.K., et al., Survival benefit of hyperthermia in a prospective randomized trial of brachytherapy boost±hyperthermia for glioblastoma multiforme. International Journal of Radiation Oncology* Biology* Physics, 1998. 40(2): p. 287-295.
2. Winter, L., et al., Design and Evaluation of a Hybrid Radiofrequency Applicator for Magnetic Resonance Imaging and RF Induced Hyperthermia: Electromagnetic Field Simulations up to 14.0 Tesla and Proof-of-Concept at 7.0 Tesla. PLoS One, 2013. 8(4): p. e61661.
3. Winter, L., et al., Thermal magnetic resonance: physics considerations and electromagnetic field simulations up to 23.5 Tesla (1GHz). Radiation Oncology, 2015. 10(1): p. 1.
4. Dobsicek Trefna, H., et al. Antenna Applicator for Microwave Hyperthermia Treatment of Pediatric Brain Cancer. in 8th European Conference on Antennas and Propagation, EuCAP 2014, The Hague, The Netherlands 6-11 April 2014. 2014.
5. Rijnen, Z., et al., Clinical integration of software tool VEDO for adaptive and quantitative application of phased array hyperthermia in the head and neck. International Journal of Hyperthermia, 2013. 29(3): p. 181-193.
6. Bellizzi, G.G., et al., Selecting the Optimal Subset of Antennas in Hyperthermia Treatment Planning. IEEE Journal of Electromagnetics, RF and Microwaves in Medicine and Biology, 2019: p. 1-1.
7. Guérin, B., et al., Computation of ultimate SAR amplification factors for radiofrequency hyperthermia in non-uniform body models: impact of frequency and tumour location. International Journal of Hyperthermia, 2018. 34(1): p. 87-100.
8. Oberacker, E., et al., Radiofrequency applicator concepts for RF hyperthermia treatment and MR imaging of glioblastoma multiforme at 7.0 T (298 MHz). Proceedings of the 26th Joint ISMRM-ESMRMB Annual Meeting and Exhibition, Paris, France, 2018.
9. Sim4Life V3.4, ZMT, Zurich, Switzerland
10. IEEE, Recommended Practice for Determining the Spatial‐Peak Specific Absorption Rate (SAR) in the human body Due to Wireless Communications Devices: Measurement Techniques. 2003.
11. MatLab, The MathWorks Inc., Natick, Massachusetts, US
12. Oberacker E. et al., Radiofrequency applicator concepts for simultaneous MR imaging and hyperthermia treatment of glioblastoma multiforme: A 7.0 T (298 MHz) study, Proceedings of the 25th ISMRM Annual Meeting and Exhibition, Honolulu, Hawaii, USA
13. Eichfelder, G. and M. Gebhardt, Local specific absorption rate control for parallel transmission by virtual observation points. Magnetic Resonance in Medicine, 2011. 66(5): p. 1468-1476.
Figures