0119
RF Power Deposition and Temperature Rise for Thermo-Acoustic Ultrasound Signal Generation from Lead Tips in MRI
Neerav Dixit1, John Pauly1, and Greig Scott1
1Electrical Engineering, Stanford University, Stanford, CA, United States
1Electrical Engineering, Stanford University, Stanford, CA, United States
Synopsis
Using the pressure signals resulting from RF energy absorption, thermo-acoustic ultrasound (TAUS) enables detection of excessive local SAR at the lead tips of implanted devices, which causes RF-induced lead tip heating in MRI. Interleaving TAUS acquisitions with MR sequences may also allow for real-time lead tip temperature tracking during MRI. However, generating TAUS signals requires some RF energy deposition and heating at lead tips. Here, we analyze the amount of RF power at lead tips and the associated lead tip temperature rise needed to generate the TAUS signal.
Introduction
The RF transmit in MRI can couple to conductive leads of implanted devices, resulting in RF-induced heating at lead tips1-4. Detection of the amplification in RF power around lead tips responsible for this heating has been demonstrated with thermo-acoustic ultrasound (TAUS) using the MR scanner's RF body coil and an inexpensive single-element ultrasonic transducer5,6. The temperature-dependence of the lead tip TAUS signal could also allow for TAUS lead tip temperature monitoring during MRI7.The TAUS pressure signal is formed by thermo-elastic expansion resulting from RF absorption. For TAUS temperature monitoring during MRI to be practical, only a minimal lead tip temperature rise should be required to generate detectable TAUS signals. Here, we characterize the TAUS signal generated as a function of RF power at a lead tip, and we consider the signal that can be generated while constraining lead tip heating.
Theory and Methods
The local specific absorption rate $$$SAR(\vec{r},t)$$$ in MRI can be expressed as a product of the SAR spatial profile $$$G(\vec{r})$$$ and the RF transmit power $$$P(t)$$$. The excited TAUS pressure signal $$$p$$$ is then described using the acoustic wave equation $$\left(\nabla^2-\frac{1}{v_s^2}\frac{\partial^2}{\partial t^2}\right)p\left(\vec{r},t\right)=-\frac{\beta\rho}{C}G(\vec{r})\frac{\partial P(t)}{\partial t},$$ in tissue with speed of sound $$$v_s$$$, thermal expansion coefficient $$$\beta$$$, specific heat $$$C$$$, and density $$$\rho$$$. The frequency content of $$$P$$$, set by the envelope of the RF transmit, determines which acoustic frequencies are excited. For frequency-modulated continuous-wave (FMCW) TAUS acquisition schemes, a chirp signal is used to amplitude-modulate the RF transmit, effectively encoding signal depth with frequency (Figure 1)6,8,9.We first consider FMCW TAUS acquisitions for a simple lead tip geometry for which key properties can be defined analytically. For induced rms current $$$I_{rms}$$$ on a thin insulated wire driving a spherical electrode (Figure 2), the current density, time-averaged SAR, and steady-state temperature rise (no perfusion) around the electrode are $$\vec{J}(r)=\frac{I}{4\pi r^2}\hat{r},$$ $$SAR_{avg}(r)=\frac{I_{rms}^2}{16\pi^2r^4\sigma\rho},$$ $$\Delta T(r)=\frac{I_{rms}^2}{16\pi^2\sigma kR_0}\left[\frac{1}{r}-\frac{R_0}{2r^2}\right],$$ where $$$r$$$ is the distance from the center of the electrode of radius $$$R_0$$$, and $$$\sigma$$$ and $$$k$$$ are respectively the electrical and thermal conductivities of the tissue. Assuming acoustic waves are reflected from the electrode surface and neglecting acoustic attenuation, the frequency-domain TAUS pressure $$$\bar{p}$$$ is $$\bar{p}(r,\omega)=\frac{v_s\beta\rho\bar{P}(\omega)}{2Cr}\int dr'r'G(r')\left(e^{-j\frac{\omega}{v_s}\left|r-r'\right|}-\frac{1-j\frac{\omega}{v_s}R_0}{1+j\frac{\omega}{v_s}R_0}e^{-j\frac{\omega}{v_s}\left(\left|r+r'\right|-2R_0\right)}\right),$$ where $$$\bar{P} $$$ is the spectrum of $$$P$$$ for the FMCW RF transmit and $$$G$$$ has the same spatial dependence as $$$SAR_{avg}$$$. This frequency-domain response gives the amplitude of the TAUS signals generated when the RF transmit is amplitude-modulated at different frequencies.
To determine similar relationships for a realistic lead geometry, a model lead tip was characterized in COMSOL Multiphysics (Figure 3). First, the SAR spatial profile was determined with a 64 MHz RF simulation. Heat-transfer simulations (no perfusion), using the SAR spatial profile as a heat source distribution, determined the steady-state maximum temperature rise versus lead tip power absorption. Acoustic simulations determined the frequency-domain TAUS response.
For both a spherical electrode (R0=1mm) and the model lead tip, we simulated the TAUS signal generated by FMCW acquisitions using a 2.5ms RF transmit of a 100% AM signal. Assuming periodic TAUS acquisitions every 1s, the fractional transmit duty cycle D was 0.25%, and the time-averaged SAR and maximum steady-state temperature rise were reduced by a factor of D for a given induced lead tip power. With these parameters, we calculated the lead tip power corresponding to a maximum steady-state temperature rise of 0.25oC. To determine the time-domain TAUS signal at a certain position, the frequency-domain response of the TAUS signal at that position ($$$\bar{p}(\vec{r},\omega)/\bar{P}(\omega)$$$) was calculated, and then the inverse FFT of the frequency response was convolved with the baseband content of $$$P$$$ for the desired FMCW excitation. FMCW postprocessing (mixing with time-reversed chirp, windowing, IFFT) recovered SNR and resolution. The recovered signal level was quantified by comparison to the rms value of white Gaussian noise following FMCW postprocessing.
The tissue properties used for calculations and simulations were $$$v_s$$$=1500m/s, $$$\beta$$$=4e-4K-1, $$$C$$$=4000J/kg/K, $$$\rho$$$=1000kg/m3, $$$\sigma$$$=0.5S/m, $$$k$$$=0.5W/m/K.
Results and Discussion
The excited thermo-acoustic pressure amplitude varies significantly with the transmit modulation frequency for both the spherical electrode and the model lead tip (Figures 2c,d and 3c,d). The frequency response depends on the lead geometry (Figure 2d), and acoustic interference patterns form according to the excited acoustic wavelength (Figure 3c). The pressure level decreases with distance from the lead tip (Figures 2c,3d).For a spherical electrode with R0=1mm and D=0.25%, an induced current of 89mArms during RF transmit, corresponding to 1.26W at the lead tip (3.15mW time-averaged), results in a worst-case steady-state temperature rise of 0.25oC and a maximum temperature rise of 63mK per FMCW transmit. Figure 4a shows the FMCW time-domain signals at r=3cm for acquisitions using different chirp bandwidths at this power level.
For the model lead tip with D=0.25%, 1.88W power deposition at the lead tip (4.7mW time-averaged) caused a 0.25oC maximum steady-state temperature rise and a maximum 50mK rise per FMCW transmit. Figure 5a shows 2.5ms FMCW time-domain signals for this power level.
FMCW postprocessing of the time-domain signals determined the intensity vs distance (Figures 4b,5b).
Conclusion
We characterized the TAUS signals generated from lead tips as a function of RF power deposition and the excited acoustic frequencies for FMCW TAUS acquisitions. Detectable signal levels can be generated without inducing significant temperature increases.Acknowledgements
This work was supported by the NIH under grants 5R01EB012031, 2R01EB008108, and P01CA159992, and by the William R. Hewlett Stanford Graduate Fellowship.References
- Nitz WR, Oppelt A, Manke C, Lenhart M, Link J. On the heating of linear conductive structures as guide wires and catheters in interventional MRI. J Magn Reson Imag. 2001;13(1):105-114.
- Nyenhuis JA, Park S-M, Kamondetdacha R, Amjad A, Shellock FG, Rezai AR. MRI and implanted medical devices: Basic interactions with an emphasis on heating. IEEE Trans Device Mater Rel. 2005;5(3):467-480.
- Spiegel J, Fuss G, Backens M, et al. Transient dystonia following magnetic resonance imaging in a patient with deep brain stimulation electrodes for the treatment of Parkinson disease. J Neurosurg. 2003;99(4):772-774.
- Henderson JM, Tkach J, Phillips M, Baker K, Shellock FG, Rezai AR. Permanent neurological deficit related to magnetic resonance imaging in a patient with implanted deep brain stimulation electrodes for Parkinson's disease: Case report. Neurosurgery. 2005;57(5):E1063.
-
Scott
G, Etezadi-Amoli M, Stang P, Nan H, Arbabian A, Pauly J. Thermo-acoustic
ultrasound detection of RF coil and tip SAR. Proc Intl Soc Mag Reson Med.
2015;23:377.
- Dixit N, Stang PP, Pauly JM, Scott GC. Thermo-acoustic ultrasound for detection of RF-induced device lead heating in MRI. IEEE Trans Med Imaging. 2018;37(2):536-546.
-
Dixit
N, Pauly J, Scott G. Feasibility of thermo-acoustic ultrasound for non-invasive
monitoring of temperature at lead tips during MRI. Proc Intl Soc Mag Reson Med.
2019;27:804.
- Nan H, Arbabian A. Peak-power-limited frequency-domain microwave-induced thermoacoustic imaging for handheld diagnostic and screening tools. IEEE Trans Microw Theory Techn. 2017;65(7):2607-2616.
- Fan Y, Mandelis A, Spriou G, Vitkin IA. Development of a laser photothermoacoustic frequency-swept system for subsurface imaging: Theory and experiment. The Journal of the Acoustical Society of America. 2004;116(6):3523-3533.
Figures
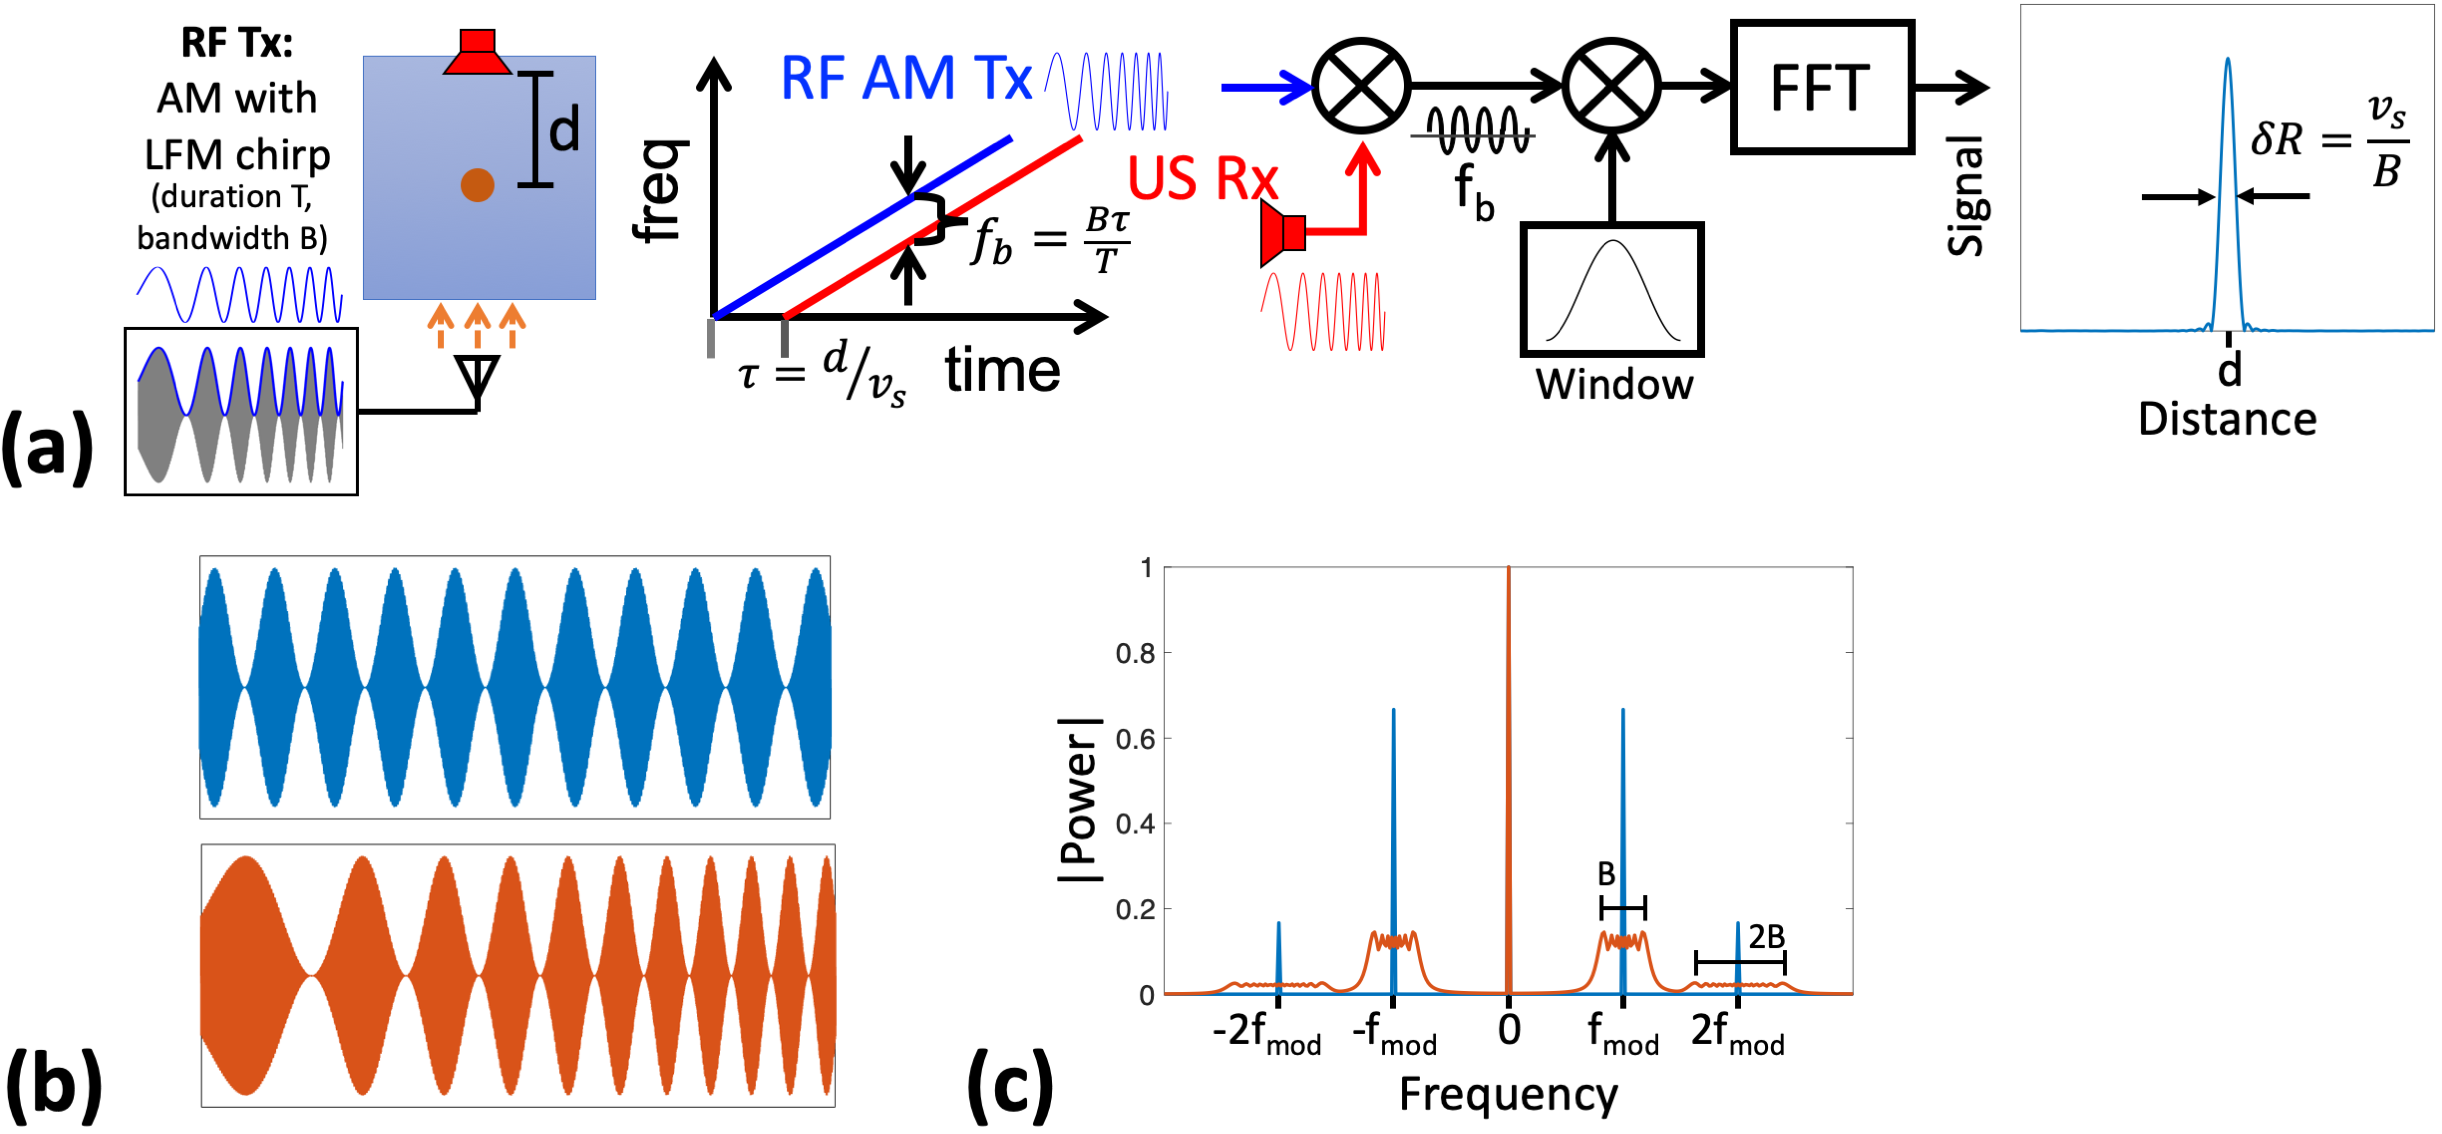
(a)
Diagram of FMCW TAUS acquisitions using an amplitude-modulated RF transmit. (b)
RF signals amplitude-modulated
by a
tone (top) and a chirp (bottom). (c) Baseband spectra of transmit power for
signals modulated by a tone (blue) and a chirp (red). Only the DC component of
the transmit power contributes to heating.
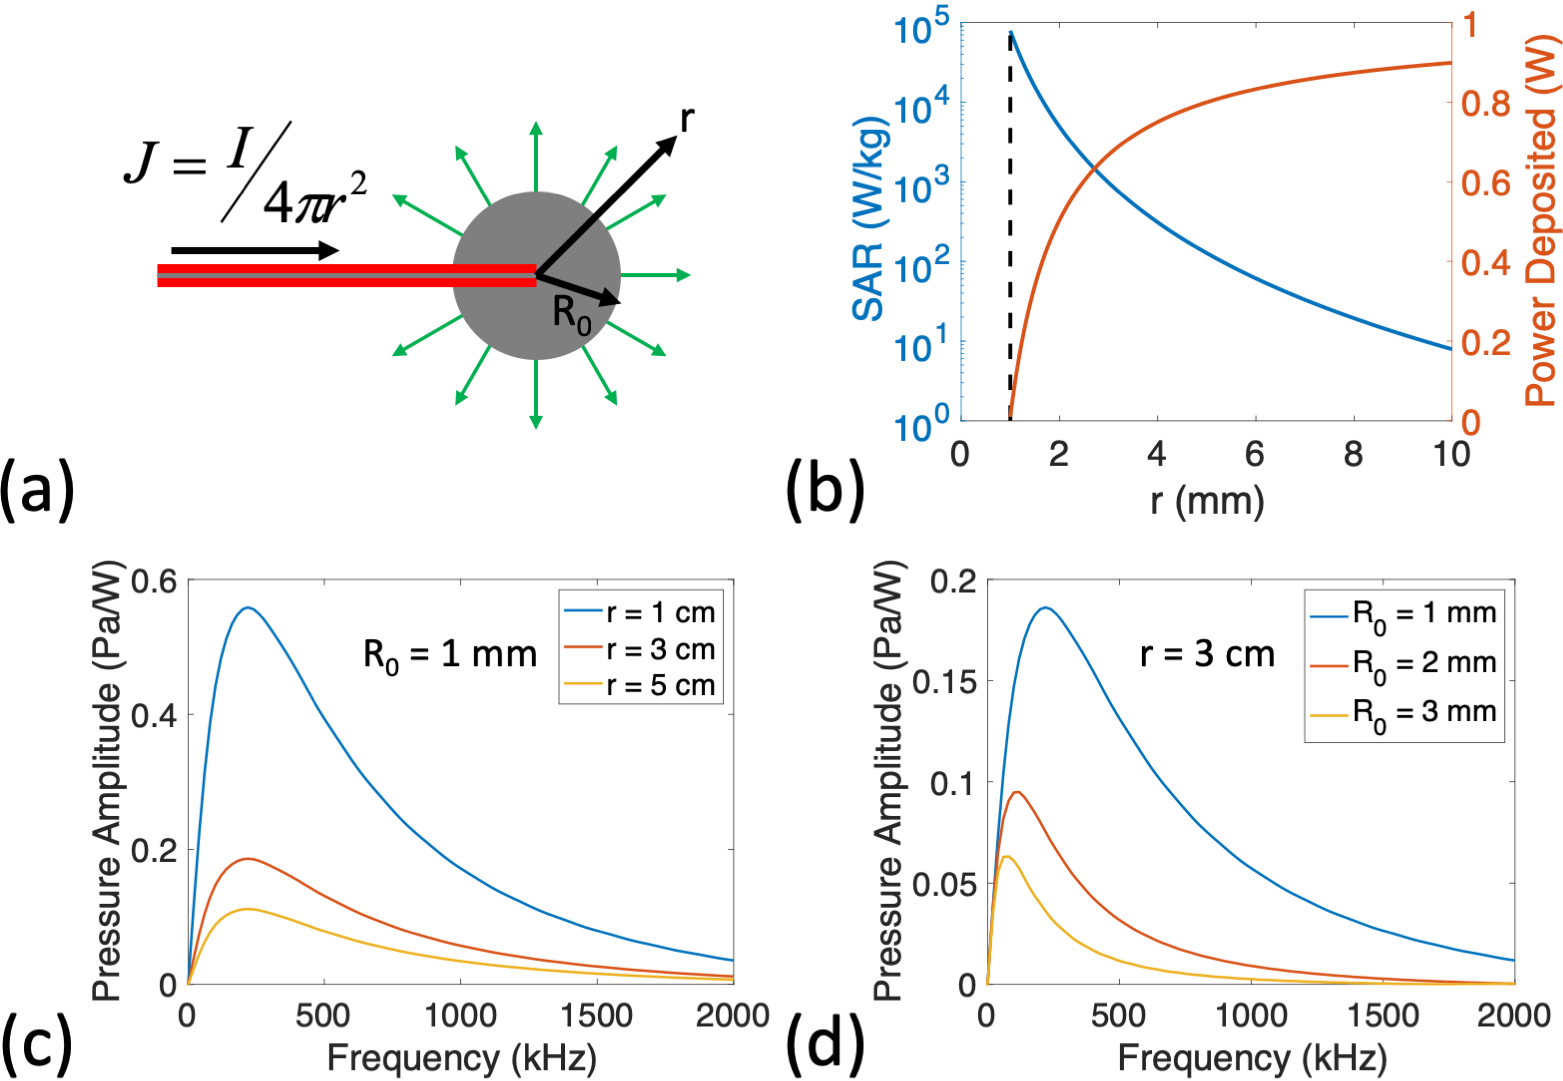
(a)
Illustration of the model in which current is driven into a spherical
electrode. (b) SAR vs radial position and total power deposited within a sphere
of radius r for the case R0 = 1 mm and Irms = 79 mA (total 1 W power deposition). The dotted line shows the position
of the electrode surface. (c,d) Amplitude of pressure waveform generated
(normalized to 1 W deposited at lead tip) vs modulation frequency of
100% AM
RF transmit
for (c) R0 = 1 mm at multiple radial positions,
and for (d) r = 3 cm for multiple electrode sizes.
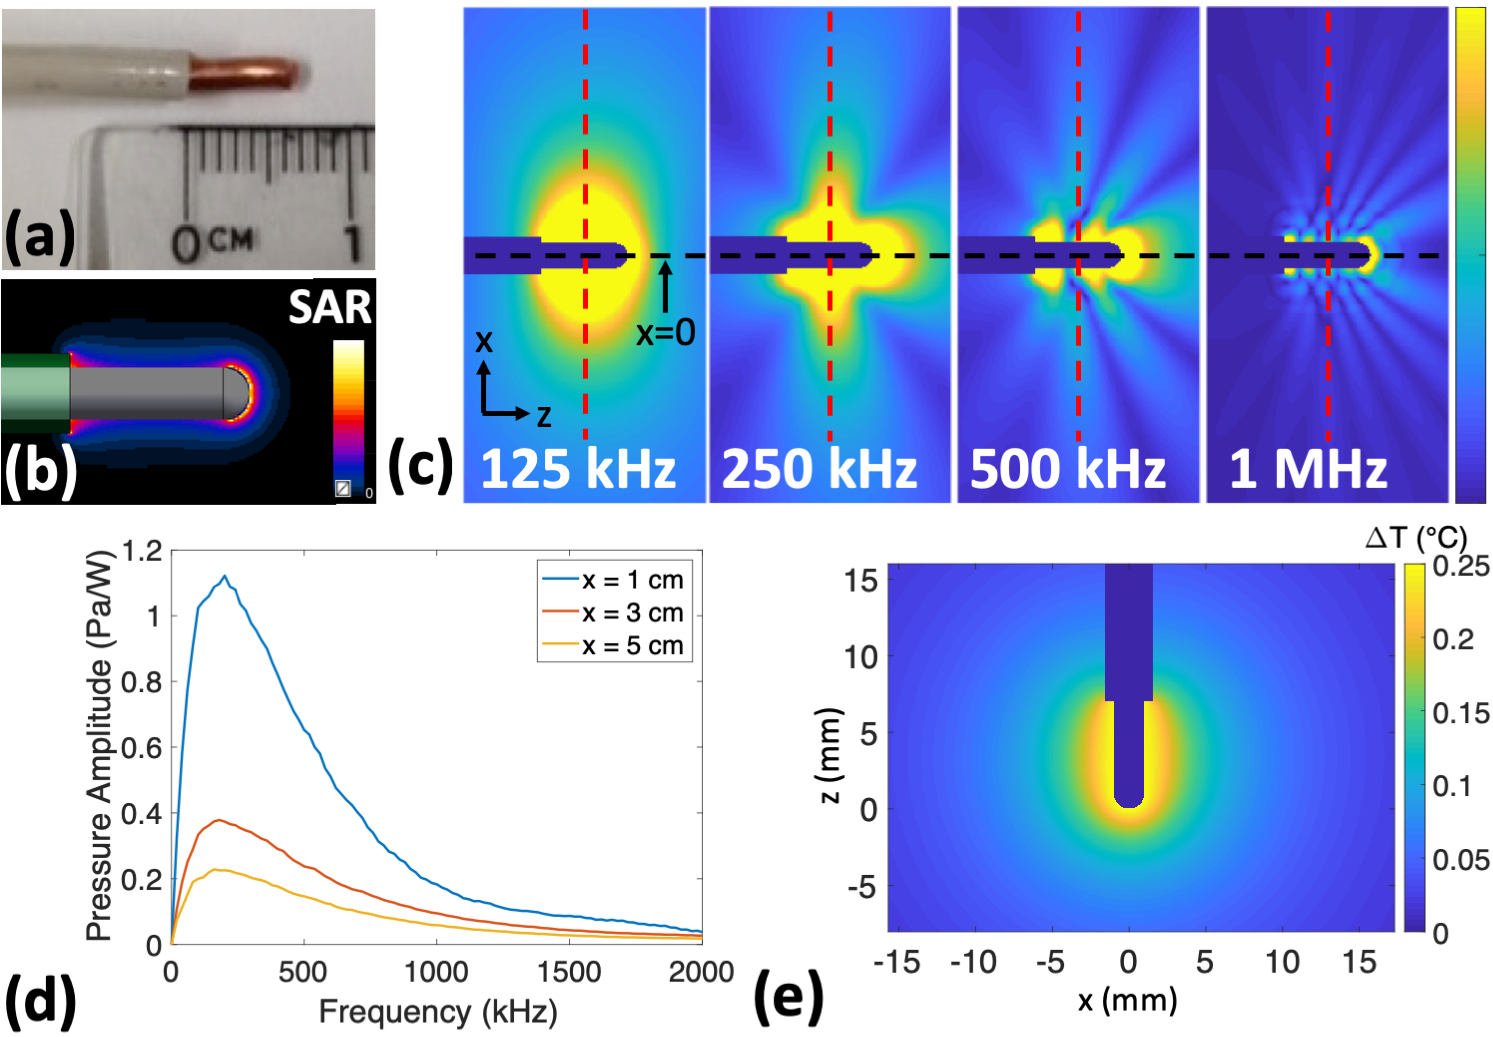
(a)
Model lead tip being simulated (7 mm exposed conductor, 2.04
mm conductor diameter, 3.10 mm insulation outer diameter). (b) Simulated SAR
distribution around the lead tip. (c) Simulated TAUS acoustic fields for
different continuous wave modulation frequencies. (d)
Amplitude of pressure waveform generated (normalized to 1 W deposited at lead
tip) vs modulation frequency of 100% AM RF transmit at multiple distances from the
lead tip along the red dotted lines in part c. (e) Simulated worst-case steady-state temperature distribution from 4.7 mW average power (ΔTmax = 0.25oC).
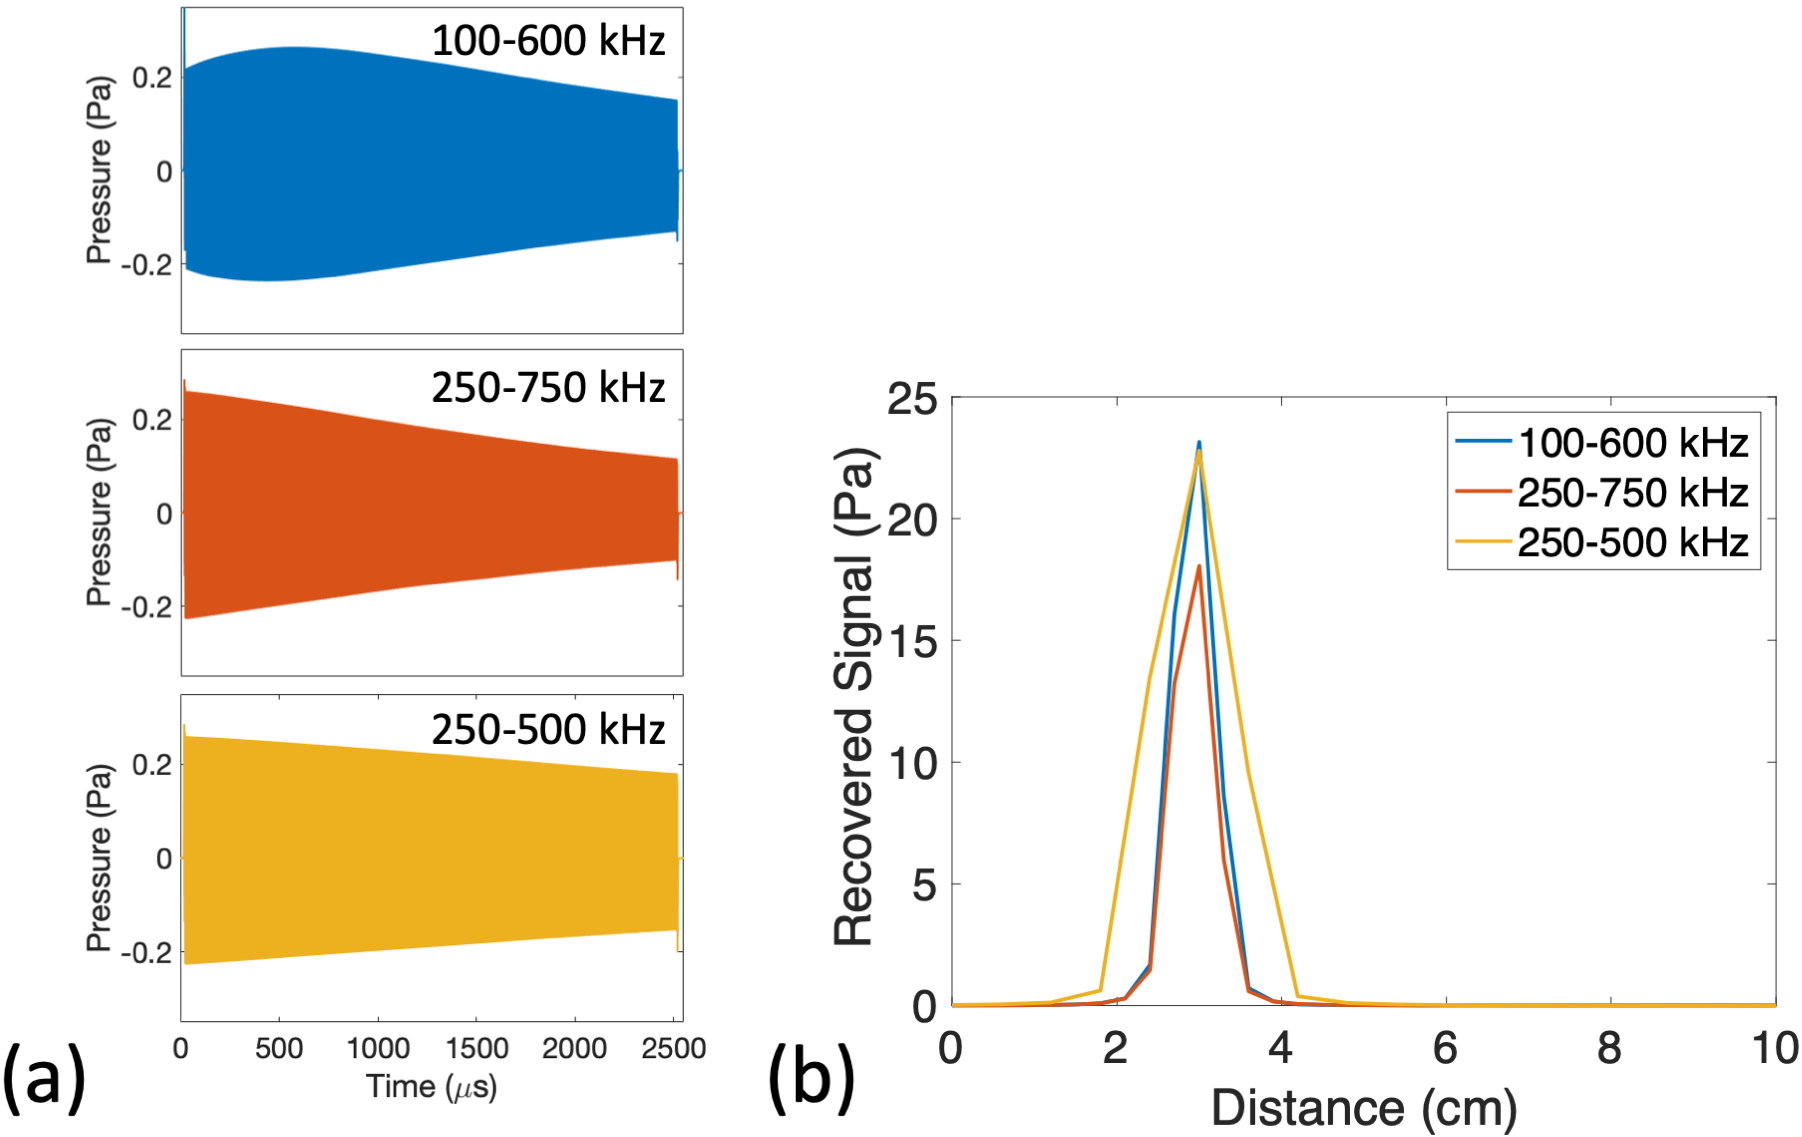
Simulated
FMCW TAUS signals for the spherical electrode model. RF transmit signals with 100% AM RF
transmit using chirps of 2.5 ms duration and varying bandwidths were
simulated. The induced lead current and corresponding lead tip power for each RF
transmit (89 mArms, 1.26 W) were selected so that a 0.25% RF transmit duty cycle would induce a maximum steady-state temperature
rise of 0.25 oC for an electrode with R0 = 1mm. (a) Excited pressure signals over
time at r = 3
cm for R0 = 1 mm. (b) Recovered signal level vs
distance following FMCW postprocessing
for the signals in part a.
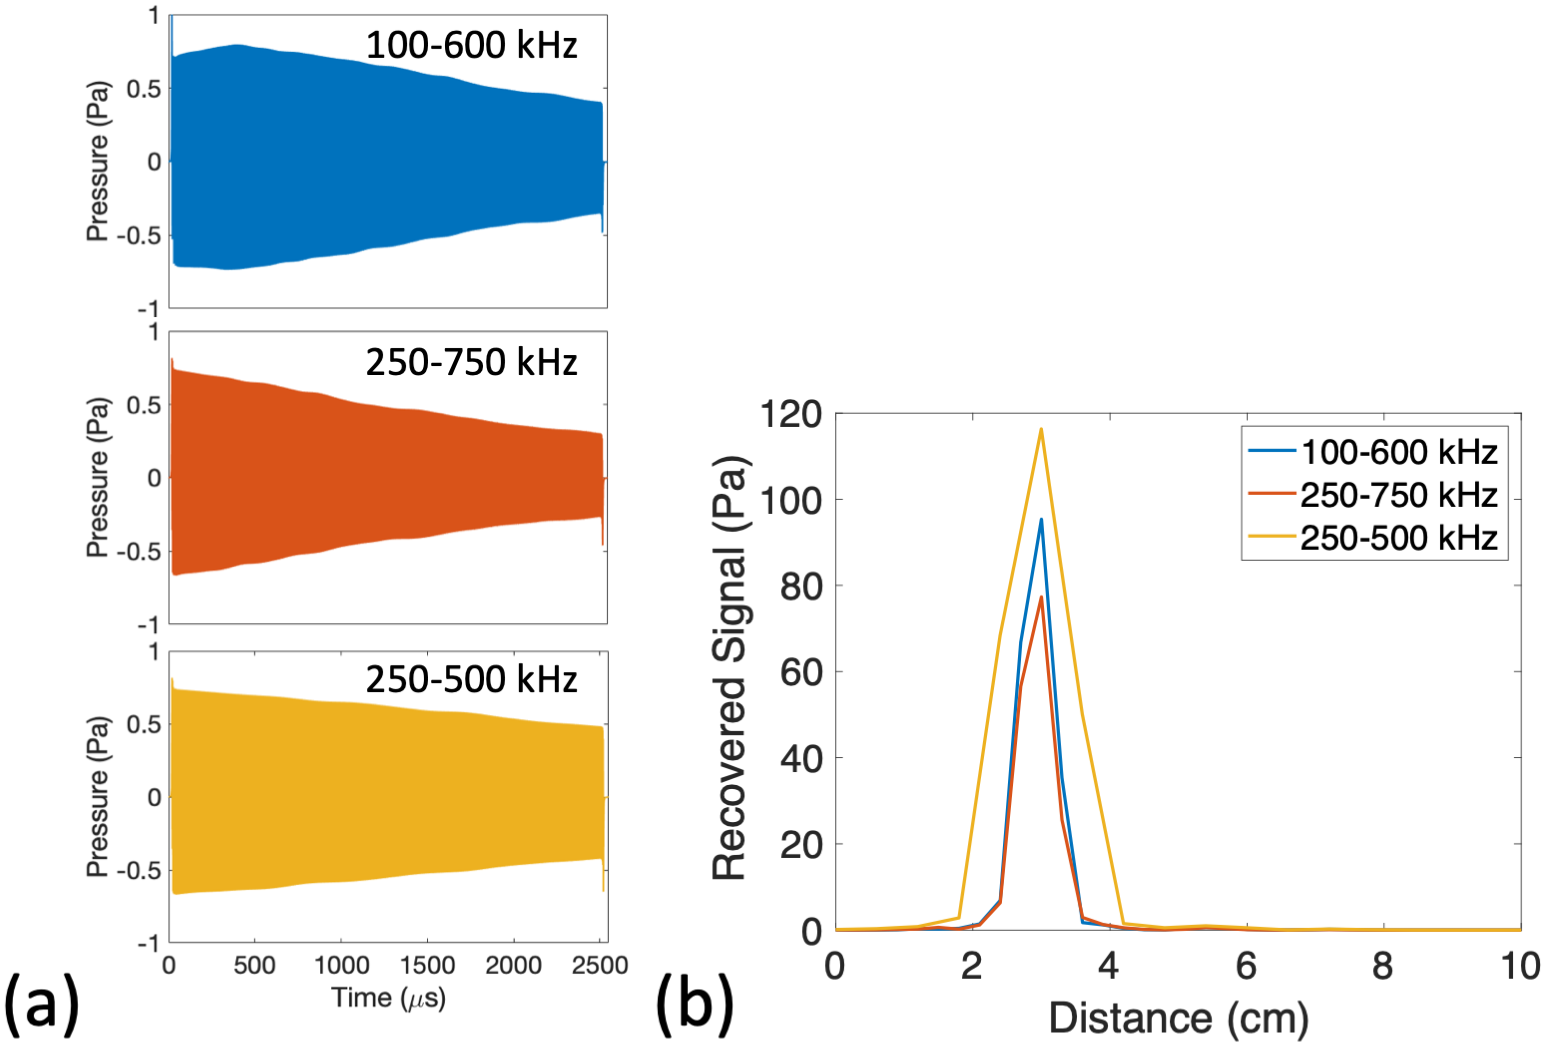
Simulated
FMCW TAUS signals for the model lead tip. RF
transmit signals with 100% AM using chirps of 2.5 ms
duration and varying bandwidths were simulated. The lead tip power deposition during each RF transmit (1.88
W) was selected
so that a 0.25% RF transmit duty cycle would
induce
a maximum steady-state temperature rise of 0.25 oC.
(a) Excited
pressure
signals over time at x
= 3
cm along the red dotted lines in Fig 3c. (b) Recovered signal level vs distance following FMCW postprocessing.