0115
Prediction of subject-specific local SAR in patients with deep brain stimulation leads using artificial neural networks1Biomedical Engineering, Northwestern University, Chicago, IL, United States, 2Radiology, Northwestern University, Chicago, IL, United States, 3Northwestern Medicine, Chicago, IL, United States, 4Neurosurgery, Albany Medical Center, Albany, NY, United States
Synopsis
Patients with deep brain stimulation (DBS) implants can significantly benefit from MRI; however, their access is limited due to safety concerns associated with RF heating of implants. RF heating depends significantly on the trajectory of an implanted lead, but there is a lack of surgical guidelines about positioning the extracranial portion of the leads, resulting in substantial patient-to-patient variation in DBS lead trajectories. Thus, quick and reliable patient-specific assessment of RF heating is highly desirable. Here we present an artificial neural network (ANN) model that demonstrates great potential in predicting local SAR at the tips of the DBS leads.
Introduction
MRI can significantly aid intraoperative and postoperative monitoring of patients with deep brain stimulation (DBS) implants. However, interactions between MRI RF fields and implanted DBS leads compromise patient safety due to induced currents on the leads, which can cause excessive heating in the tissue. It is well established that RF heating of an implanted lead is highly sensitive to its trajectory and orientation with respect to the scanner’s electric field (E-field).1-10 Specifically, the tangential component of the incident electric field (Etan) along the trajectory of an elongated implant is known to be a crucial determinant of RF heating at the implant’s tip.11 Since the incident E-field is an a-priori known signature of an RF coil and the trajectory of an implant lead can be easily extracted from computed tomography (CT) images,3-5 identifying a reliable map from Etan to the specific absorption rate (SAR)/RF heating can provide a fast and reliable method for immediate patient-specific assessment of RF heating. This will be particularly useful in techniques that rely on patient-specific determination of SAR to adjust imaging parameters or hardware configuration for imaging patients with implants, such as those recently introduced in the framework of parallel transmit and reconfigurable MRI technology.7,9,10,12,13 Currently, such techniques heavily rely on full-wave electromagnetic simulations that are both computationally expensive and time-consuming. In this study, we present a promising, novel concept for SAR prediction utilizing artificial neural networks (ANN) that can be trained to predict local SAR at the tips of the DBS leads using the Etan components along the trajectory of the leads to inform the ANN.Methods
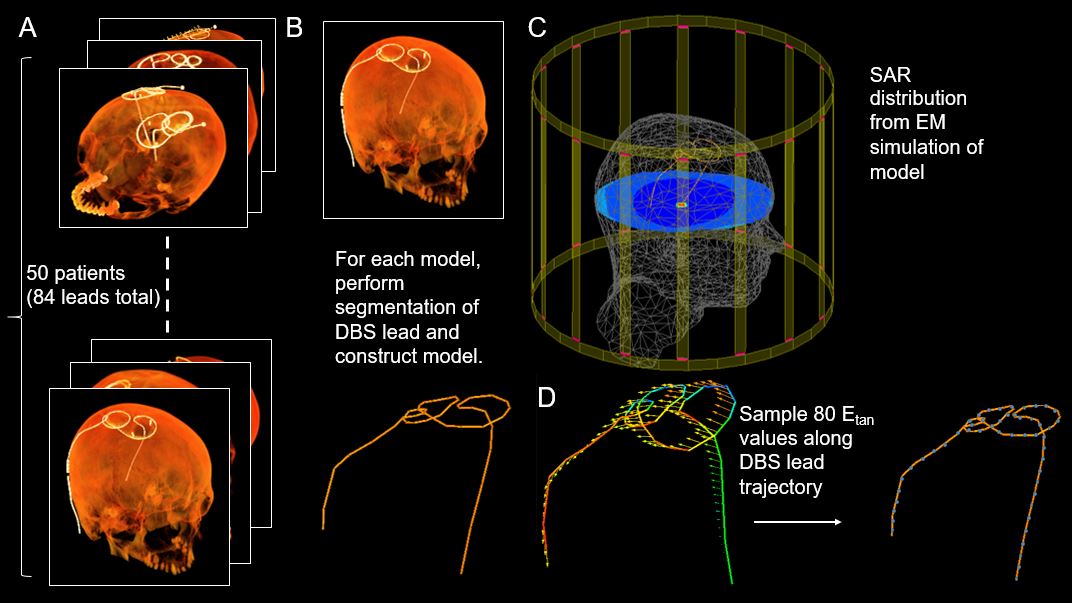
Patient models: Postoperative CT images of 50 patients operated at two DBS centers (Northwestern Memorial Hospital and Albany Medical Center) with implanted DBS leads were used for model construction. From these images, 34 patients had bilateral leads and 16 patients had a unilateral lead.Data Preprocessing: Realistic, patient-derived DBS lead trajectories (40 cm) were extracted from CT images for a total of 84 trajectories (Figures 1 and 2). Segmented lead trajectories were manually reconstructed, and leads were modeled as platinum iridium conductive wires (σ = 4 x 10⁶ S/m, diameter = 1 mm) embedded within a urethane insulation (σ = 0 S/m, εr = 3.5, diameter = 2 mm) with 2 mm exposed tips. These resulting, isolated DBS lead models were co-registered with a homogenous head model for electromagnetic simulations. Simulations were implemented in ANSYS Electronic Desktop 2019 R1 (ANSYS, Canonsburg, PA) using a low pass birdcage head coil tuned at 64 MHz. For each lead model, the following metrics were computed: 1g-averaged SAR at the tips of the leads in a 203 mm3 region of tissue surrounding the tip, B1+ field on a plane intersecting the DBS lead tips, and Etan values acquired at 5 mm increments along the DBS leads over a complete time cycle. The peak-to-peak Etan values were calculated for each sampling point (80 samples per lead) of each lead model, and these values served as the features for the ANN model.
Network Architecture and Evaluation: An ANN was developed in Python with Keras and Scikit-Learn libraries, and backpropagation was conducted with the Adam optimizer. Using the peak-to-peak Etan values of each DBS lead trajectory, the ANN was trained to predict SAR at the tip of the DBS leads. For training and testing, leave-one-out cross validation was conducted. Predicted SAR values from the ANN were compared to SAR values calculated during simulations, and ANN performance was evaluated with the root-mean-squared-error (RMSE) and coefficient of determination (R2). The resulting network architecture consisted of two hidden layers with 70 and 60 hidden nodes in the first and second hidden layers, respectively (Figure 3).
Results
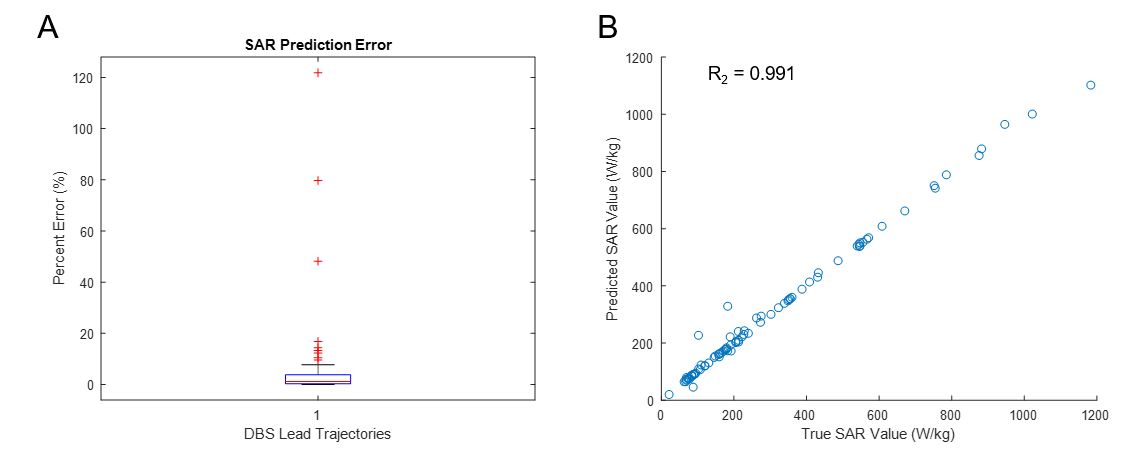
From leave-one-out cross-validation, the ANN models could predict SAR at the DBS lead tips with a percent error of 5.418 % ± 16.502 % (Figure 4). Average training and testing RMSE were 9.128 W/kg ±14.922 W/kg and 9.570 W/kg ± 22.880 W/kg, respectively.Conclusion and Future Work
In this study, we introduced an ANN that could predict SAR at the tip of implanted DBS leads from peak-to-peak Etan values from DBS lead models with varying patient-derived, extracranial trajectory configurations. Leave-one-out cross validation demonstrated that it was feasible to develop models that could accurately predict local SAR despite the high variability in the SAR values. Future work includes expanding the dataset to incorporate DBS lead trajectories from another institution and optimizing the ANN architecture. Additionally, an ANN model can be extended to evaluate artificial DBS lead trajectories and RF heating of other implants.Acknowledgements
This work was supported by the following NIH grants: R00EB021320, R03EB025344, and R03EB024705.References
[1] E. Mattei et al., "Complexity of MRI induced heating on metallic leads: experimental measurements of 374 configurations," Biomedical engineering online, vol. 7, no. 1, p. 11, 2008.
[2] C. McElcheran et al., "Numerical Simulations of Realistic Lead Trajectories and an Experimental Verification Support the Efficacy of Parallel Radiofrequency Transmission to Reduce Heating of Deep Brain Stimulation Implants during MRI," Nature Scientific Reports vol. 9, no. 1, p. 2124, 2019.
[3] L. Golestanirad et al., "Changes in the specific absorption rate (SAR) of radiofrequency energy in patients with retained cardiac leads during MRI at 1.5 T and 3T," Magnetic resonance in medicine, vol. 81, no. 1, pp. 653-669, 2019.
[4] C. McElcheran et al., "Parallel Transmission for Heating Reduction in Realistic Deep Brain Stimulation Lead Trajectories," Proc. Intl. Soc. Mag. Reson. Med. , vol. 25, 2017.
[5] L. Golestanirad; et al., "Safety of MRI on patients with abandoned/retained cardiac leads: Patient-derived simulation studies at 64MHz and 127MHz," Proc. Intl. Soc. Mag. Reson. Med, vol. 25, 2017.
[6] L. Golestanirad et al., "Variation of RF heating around deep brain stimulation leads during 3.0 T MRI in fourteen patient-derived realistic lead models: The role of extracranial lead management," Proc. Intl. Soc. Mag. Reson. Med. 25 2017.
[7] L. Golestanirad, B. Keil, L. M. Angelone, G. Bonmassar, A. Mareyam, and L. L. Wald, "Feasibility of using linearly polarized rotating birdcage transmitters and close‐fitting receive arrays in MRI to reduce SAR in the vicinity of deep brain simulation implants," Magnetic resonance in medicine, vol. 77, no. 4, pp. 1701-1712, 2017.
[8] C. McElcheran, L. Golestanirad, and S. Graham, "Heating Reduction in Unilateral And Bilateral Implanted Leads At 3T Using Parallel Radiofrequency Transmission in a Heterogeneous Head Model," Proc. Intl. Soc. Mag. Reson. Med., vol. 24, 2016.
[9] L. Golestanirad et al., "A Patient-adjustable MRI coil for implant-friendly imaging of deep brain stimulation: Design, construction, and patient-specific numerical simulations," Proc. Intl. Soc. Mag. Reson. Med. 24, 2016.
[10] L. Golestanirad, L. M. Angelone, M. I. Iacono, H. Katnani, L. L. Wald, and G. Bonmassar, "Local SAR near deep brain stimulation (DBS) electrodes at 64 MHz and 127 MHz: A simulation study of the effect of extracranial loops " Magnetic Resonance in Medicine vol. 88, no. 4, pp. 1558-1565, 2016.
[11] S. M. Park, R. Kamondetdacha, and J. A. Nyenhuis, "Calculation of MRI-induced heating of an implanted medical lead wire with an electric field transfer function," Journal of Magnetic Resonance Imaging, vol. 26, no. 5, pp. 1278-1285, 2007.
[12] C. McElcheran et al., "Low Heating B1 Mapping in Parallel Transmit for Deep Brain Stimulators," Proc. Intl. Soc. Mag. Reson. Med., vol. 25, 2017.
[13] Clare McElcheran, L. Golestanirad, and S. Graham, "Reduced Heating of Implanted Electrical Conductors Using Parallel Radiofrequency Transmission," Proc. Intl. Soc. Mag. Reson. Med. 22 2014.
Figures