0107
Deep learning for improved workflow in MRgFUS treatment planning1Department of Diagnostic Radiology and Nuclear Medicine, University of Maryland School of Medicine, Baltimore, MD, United States, 2Siemens Medical Solutions USA Inc, Malvern, PA, United States, 3Center for Metabolic Imaging and Therapeutics (CMIT), University of Maryland Medical Center, Baltimore, MD, United States, 4Siemens Healthcare GmbH, Erlangen, Germany
Synopsis
Transcranial MRI-guided focused ultrasound (tcMRgFUS) is a promising technique to treat multiple diseases. Here we examined the feasibility of leveraging deep-learning to convert MRI dual echo UTE images directly to synthesized CT skull images. We demonstrated that the derived model is capable of not only segmenting the UTE images to generate synthetic CT skull masks that are highly comparable to true CT skull masks, but is also able to reliably predict the CT skull intensities in Hounsfield units. Furthermore, we demonstrated that synthetic CT skull can be reliably used for skull-density-ratio (SDR) determination and predicting target temperature rise in tcMRgFUS.
INTRODUCTION
Transcranial MRI-guided focused ultrasound (tcMRgFUS) is a promising novel technique that is capable of treating multiple disorders and diseases1-3. tcMRgFUS treatment planning is usually performed in three steps: (i) CT skull images are acquired to estimate regional skull density and also to account for skull geometry and attenuation1,4, (ii) MRI scan is acquired to identify the ablation target region in the brain, and (iii) the CT and MR images are fused to facilitate treatment planning. Simplification of clinical workflow and minimizing radiation dose burden are highly desirable for patients undergoing tcMRgFUS. Ultra-short echo time (UTE) MRI has proven to be an important technique for imaging bone (with short T2) and could potentially be an alternative to CT imaging5. Recent successful implementations of deep learning in medical imaging demonstrate that it is a promising approach in many fields such as imaging reconstruction6 and segmentation7. The purpose of this study is to evaluate the feasibility of using a deep learning based neural network in synthesizing skull CT images from dual echo UTE MRI images and to assess its applicability in the context of tcMRgFUS treatment planning.METHODS
Image acquisition and data preprocessingThe retrospective study was approved by local IRB. Data was obtained from 40 subjects (66.5±11.2 yo, 15 Female). MR images were acquired on a 3T system (MAGNETOM Trio a Tim System, Siemens Healthcare, Erlangen, Germany). A prototype 3D radial UTE sequence5,8,9 was acquired with following parameters: TE1/TE2=0.07ms/4ms, TR=5ms, FA=5°, spatial resolution=1.3x1.3x1.3mm3. CT images were acquired using a 64-slice CT scanner (Philips Brilliance 64, Philips, WA), spatial resolution=0.48x0.48x1mm3. MRI UTE images were corrected for signal inhomogeneity with N3 bias correction using MIPAV. UTE volumes for each subject were then normalized by signal intensity from brain tissue in first echo UTE images to account for signal variability across subjects. CT images were then registered and resampled to the corresponding UTE images using FSL. CT skull images were derived by segmenting the registered CT images using Otsu’s method10.
Deep Learning model and Neural network training
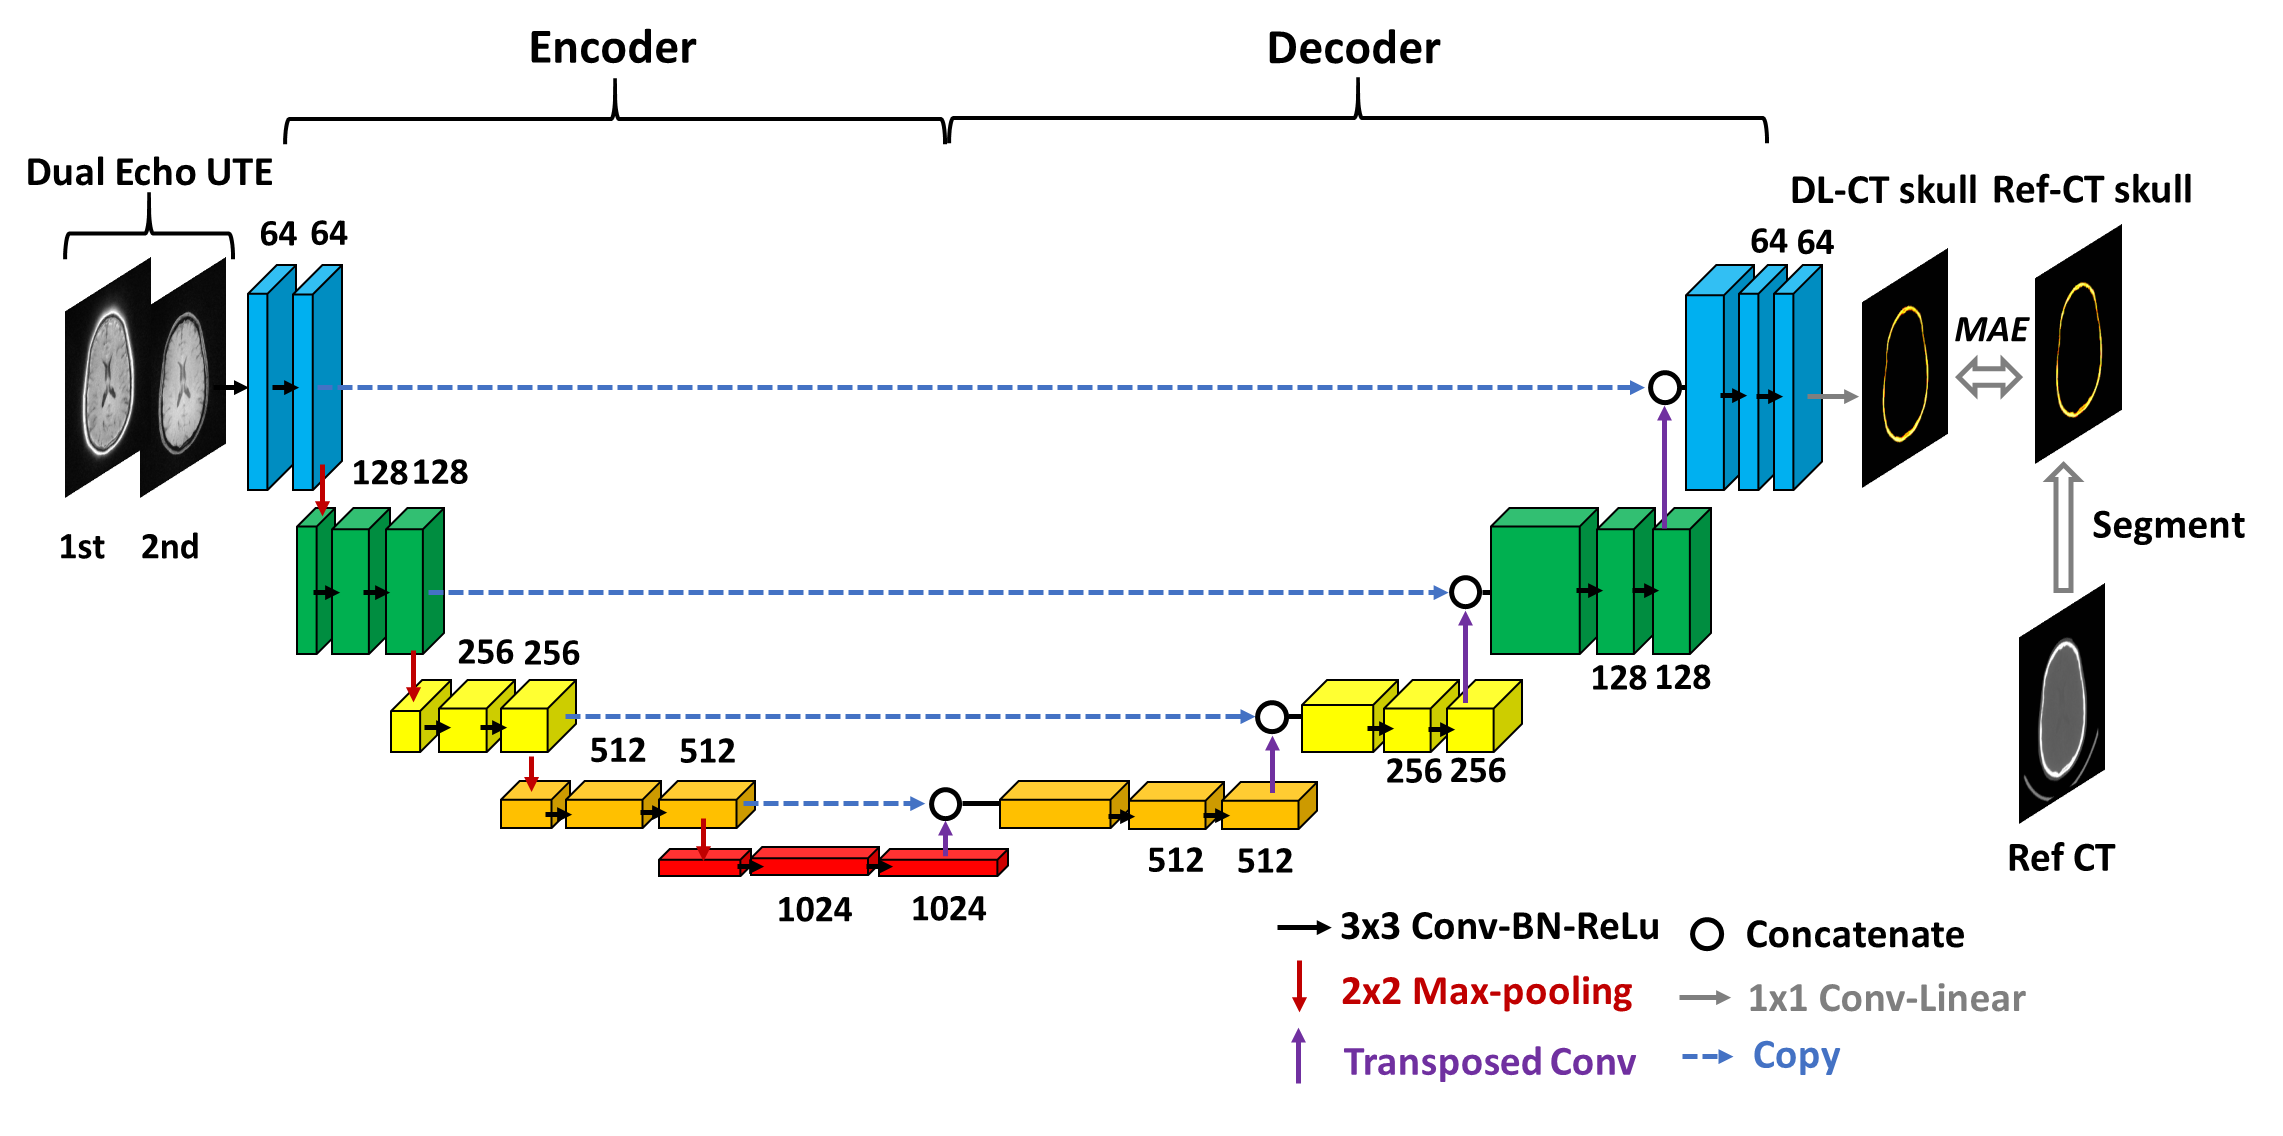
A schematic diagram of the deep learning model architecture is illustrated in Figure 1. It is based on U-Net convolution-neural-network (CNN)11. Dual echo UTE images were used as input to the neural network, and reference CT skull images as prediction target. UTE-CT image pairs from 32 subjects were used as training dataset and 8 as testing dataset. The network was defined, trained and tested using Keras with Tensorflow backend. Loss=Mean Absolute Error (MAE), ADAM algorithm12, epochs=100, learning rate=0.001.
Evaluation of model performance
The performance of neural network model is evaluated using five-fold cross validation method. The following four metrics were used to compare the synthesized CT skull to reference CT skull: 1) dice coefficient of skull masks; 2) voxel wise correlation coefficient; 3) average of voxel-wise absolute differences; 4) global CT HU values for each subject by averaging all the voxels within the CT skull mask.
Skull Density Ratio (SDR) validation
The derived model was validated by comparing whole skull Skull-Density-Ratio (SDR) from DL synthesized CT skull to that from the reference CT skull (Neuro ExAblate 4000, Insightec). The focal target was set as the center of AC-PC line.
Acoustic and temperature simulation
Acoustic and temperature simulation were performed to evaluate the DL CT skull5. We first performed acoustic field simulations to calculate the resulting acoustic profile. The acoustic fields within the head were simulated using a 3-D finite differences algorithm, which aims to solve the full Westervelt equation13. Temperature simulation was estimated using the inhomogeneous Pennes equation14 of heat conduction.
RESULTS AND DISCUSSION
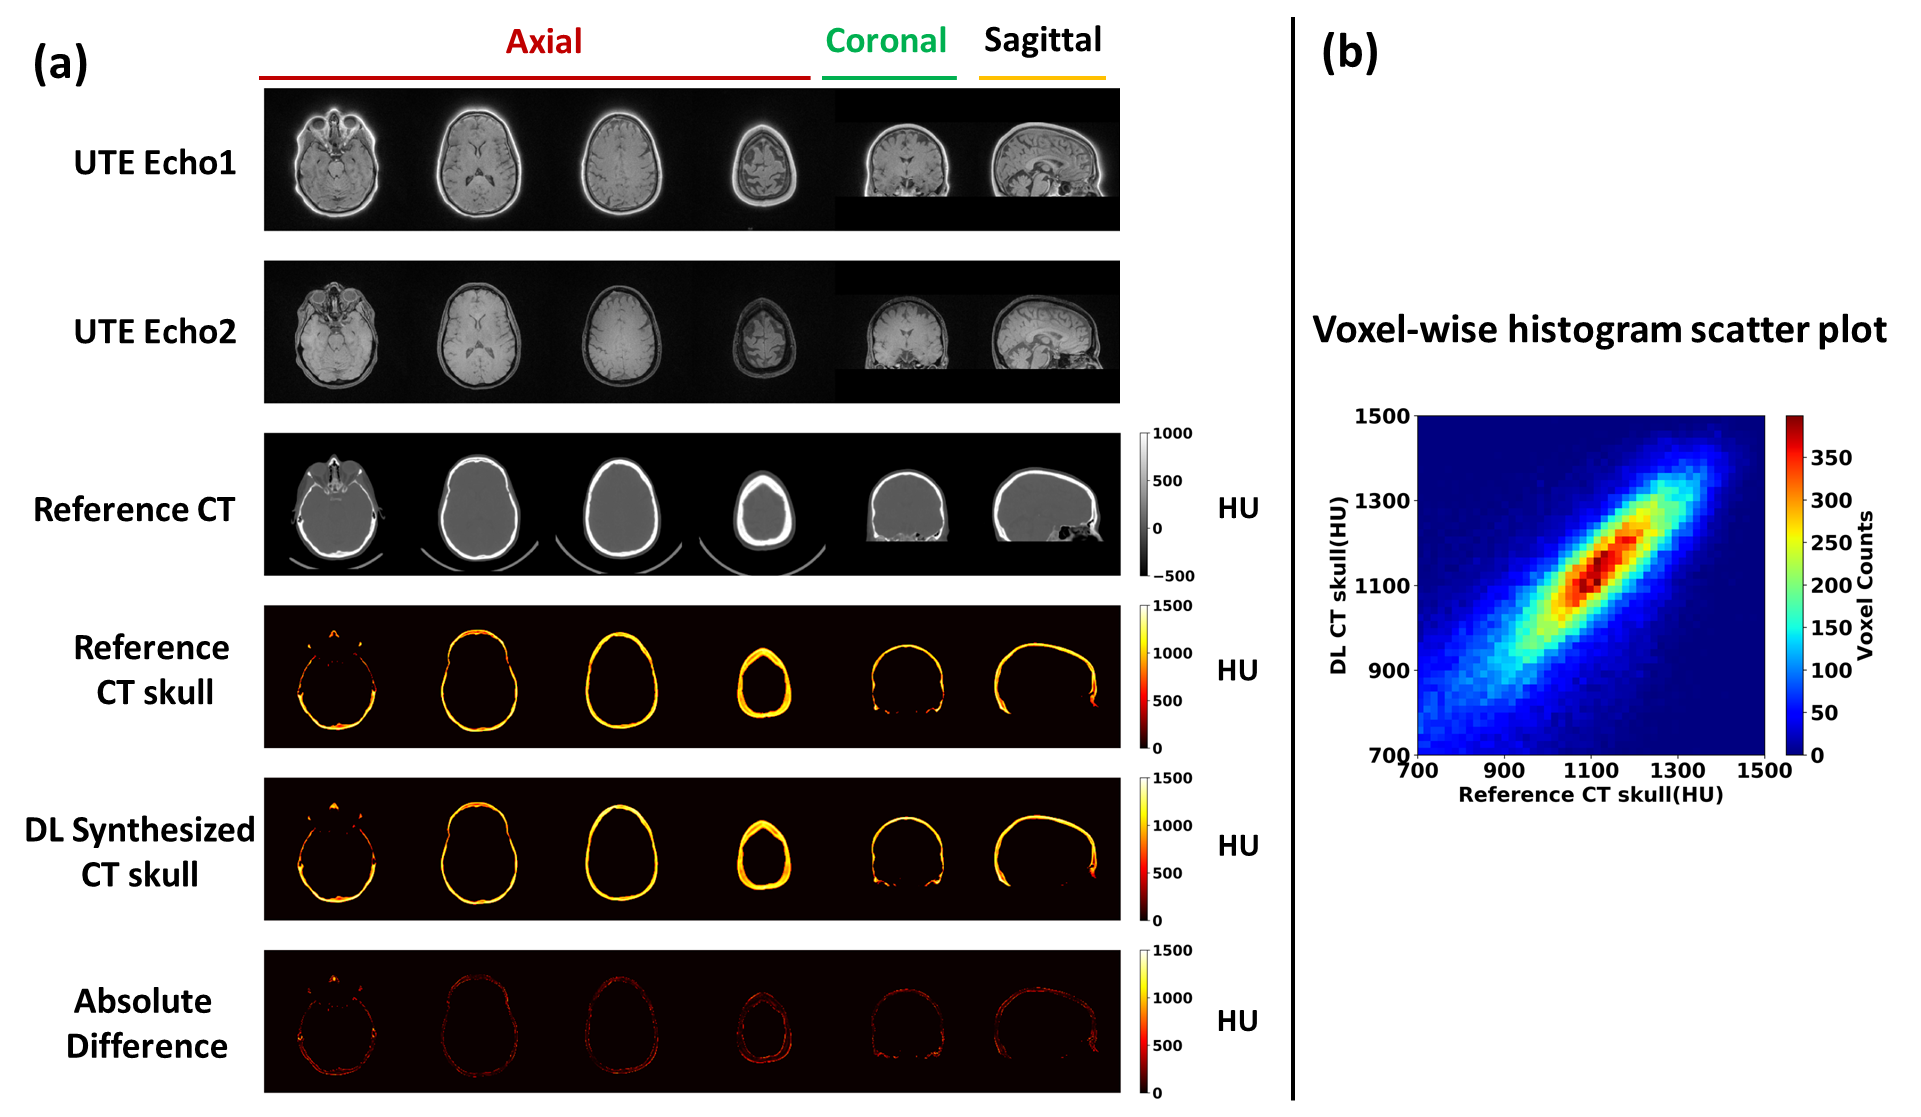
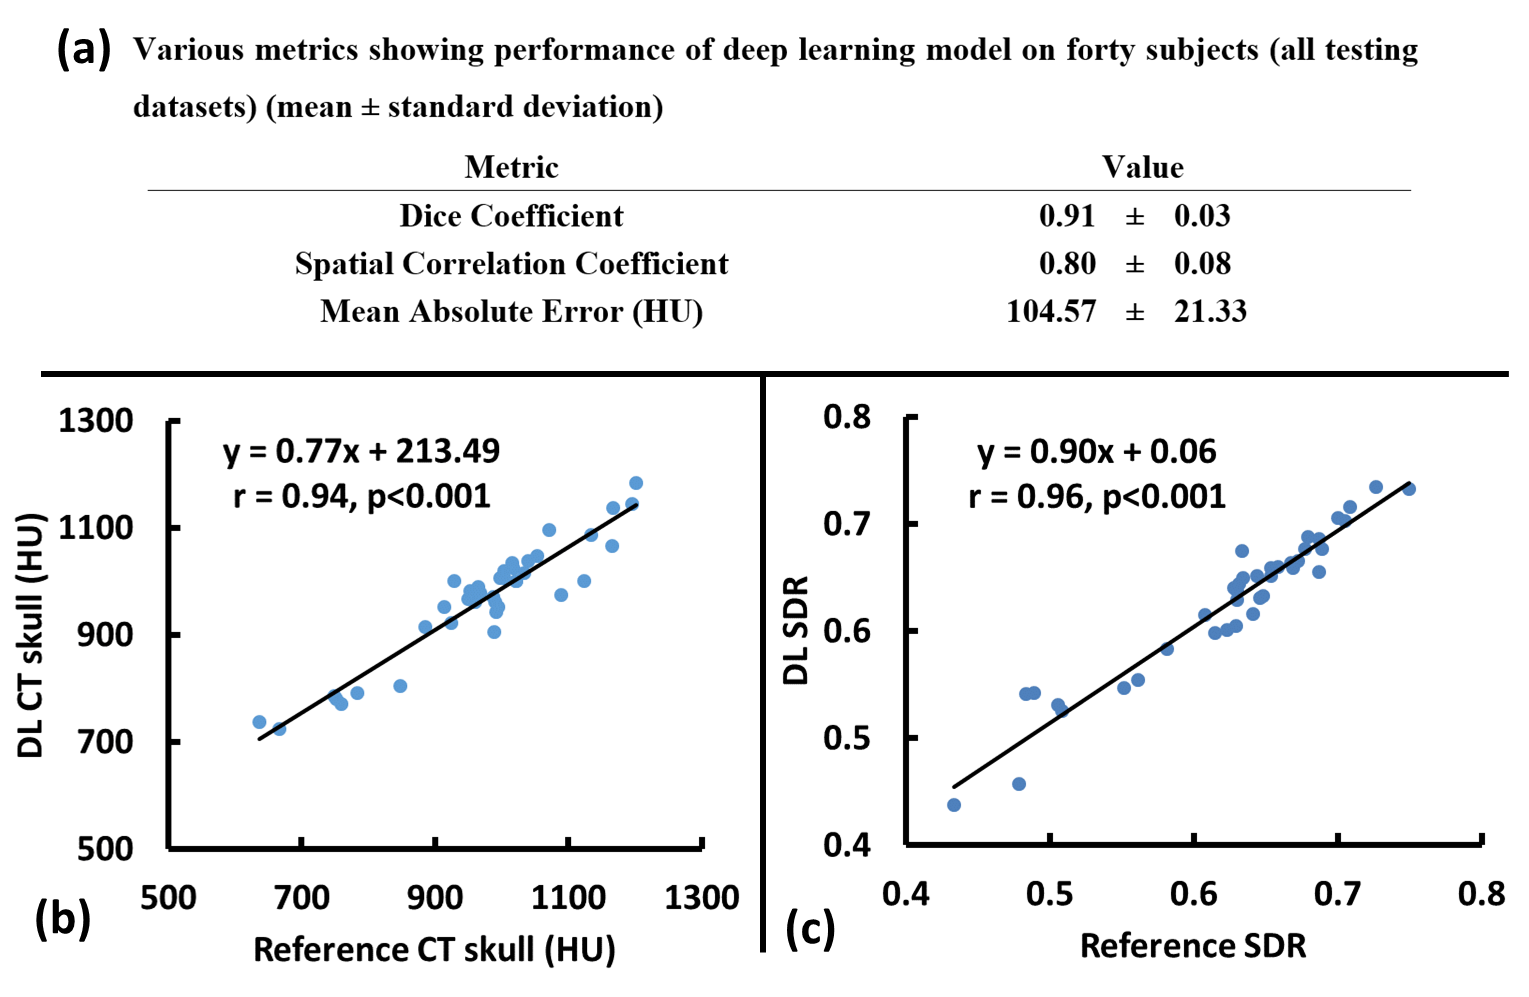
As seen from images from one representative testing subject (Figure 2), DL synthesized CT skull images are comparable with the reference CT skull images and difference images show minimal discrepancy (Figure 2a); Figure 2b shows the voxel wise 2D histogram scatter plot between reference skull CT intensity and DL synthesized skull CT signal intensity from this subject. The signal intensity between the two are highly correlated (r=0.80).Figure 3a summarizes various metrics estimating the performance of the deep learning model on all 40 testing subjects from cross validation results. Figure 3b shows the relationship between average CT HU values between DL synthesized CT skull and reference CT skull (r=0.94) for all 40 testing subjects from cross validation results. Figure 3c shows the correlation between the global SDR values between the CT skull and the DL synthesized skull (r=0.96).
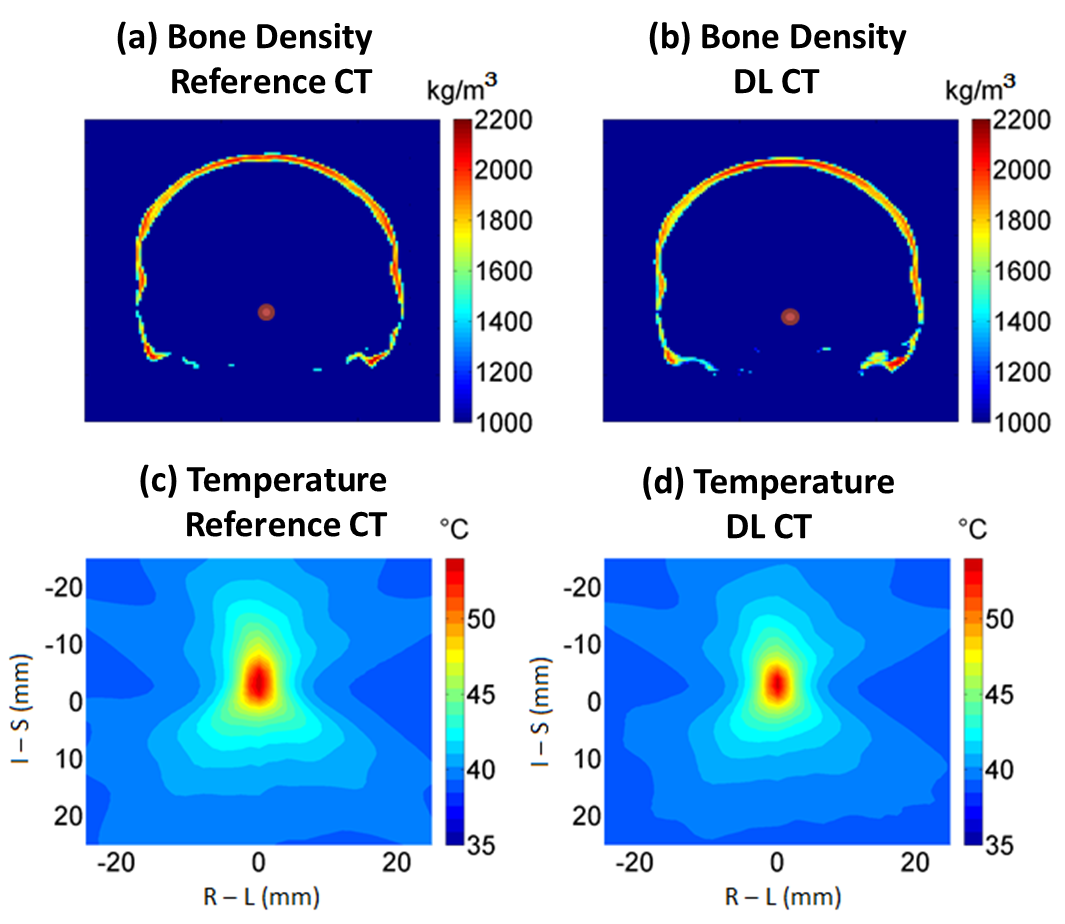
Figure 4ab shows examples of the calculated bone density maps from the same patient as in Figure 2. The average density difference of the skull is less than 50 kg/m3, indicating less than an average of 2.5% error for UTE derived acoustic properties compared with reference CT images. A peak temperature of 55.3°C and 54.2°C for the reference CT and DL synthesized CT using a base brain temperature of 37°C in the simulations. The spatial temperature patterns are also highly comparable (Figure 4cd).
CONCLUSION
Deep learning can be utilized to simplify workflow of tcMRgFUS and reduce patient exposure to radiation. Future studies will include training neural network with more datasets to improve performance and incorporating newer models such as 3D U-Net and GAN15.Acknowledgements
No acknowledgement found.References
1. Elias WJ, Huss D, Voss T et al. A pilot study of focused ultrasound thalamotomy for essential tremor. N Engl J Med 2013;369:640-648.
2. Jeanmonod D, Werner B, Morel A, Michels L, Zadicario E, Schiff G, Martin E. Transcranial magnetic resonance imaging-guided focused ultrasound: noninvasive central lateral thalamotomy for chronic neuropathic pain. Neurosurg Focus 2012;32:E1.
3. Monteith S, Sheehan J, Medel R, Wintermark M, Eames M, Snell J, Kassell NF, Elias WJ. Potential intracranial applications of magnetic resonance-guided focused ultrasound surgery. J Neurosurg 2013;118:215-221.
4. McDannold N, Park EJ, Mei CS, Zadicario E, Jolesz F. Evaluation of three-dimensional temperature distributions produced by a low-frequency transcranial focused ultrasound system within ex vivo human skulls. IEEE Trans Ultrason Ferroelectr Freq Control 2010;57:1967-1976.
5. Guo S, Zhuo J, Li G, Gandhi D, Dayan M, Fishman P, Eisenberg H, Melhem ER, Gullapalli RP. Feasibility of ultrashort echo time images using full-wave acoustic and thermal modeling for transcranial MRI-guided focused ultrasound (tcMRgFUS) planning. Phys Med Biol 2019;64:095008.
6. Hammernik K, Klatzer T, Kobler E, Recht MP, Sodickson DK, Pock T, Knoll F. Learning a variational network for reconstruction of accelerated MRI data. Magn Reson Med 2018;79:3055-3071.
7. Moeskops P, Viergever MA, Mendrik AM, de Vries LS, Benders MJ, Isgum I. Automatic Segmentation of MR Brain Images With a Convolutional Neural Network. IEEE Trans Med Imaging 2016;35:1252-1261.
8. Speier P, Trautwein F. Robust radial imaging with predetermined isotropic gradient delay correction. Proc Int Soc Mag Reson Med 2006:2379.
9. Speier P, Trautwein F. A calibration for radial imaging with large inplane shifts. Proc Int Soc Mag Reson Med 2005:2295.
10. Otsu N. A Threshold Selection Method from Gray-Level Histograms. IEEE Transactions on Systems, Man and Cybernetics 1979;9:62-66.
11. Ronneberger O, Fischer P, Brox T. U-net: Convolutional networks for biomedical image segmentation. In: International Conference on Medical Image Computing and Computer-Assisted Intervention Cham, Switzerland: Springer; 2015;234–241.
12. Kingma D, Jimmy B. Adam: A Method for Stochastic Optimization. arXiv preprint 2014;arXiv:1412.6980.
13. Hamilton MF and Blackstock DT. Nonlinear acoustics. Academic Press 1988.
14. Pennes HH. Analysis of tissue and arterial temperature in the resting human forearm. Am Physiological Soc 1948;1;93-122.
15. Nie D, Trullo R, Lian J, Petitjean C, Ruan S, Wang Q, Shen D. Medical Image Synthesis with Context-Aware Generative Adversarial Networks. Med Image Comput Comput Assist Interv 2017;10435:417-425.
Figures