0103
Simultaneous MR acoustic radiation force imaging and MR thermometry: comparison of coherent echo-shifted and RF spoiled gradient echo sequence1Shenzhen Institutes of Advanced Technology, Chinese Academy of Sciences, Shenzhen, China
Synopsis
Simultaneous MR acoustic radiation force imaging and MR thermometry (STARFI) based on coherent echo-shifted sequence (cES) was proposed and comprehensively compared to RF spoiled gradient echo (spGRE). The calculated displacement of cES STARFI was always larger than the value of spGRE STARFI through both the simulation and experiments, while the accuracy of the temperature monitoring of cES was maintained. The temperature and displacement map acquired during HIFU heating were in good accordance with each other. The cES STARFI can be an alternative for comprehensively monitoring of HIFU treatment with increased displacement sensitivity and time efficiency compared to spGRE STARFI.
Introduction
MR acoustic radiation force imaging (MR-ARFI) and MR thermometry (MRT) represent the mechanical and thermal effects, which are two of the most important effects of high intensity focused ultrasound (HIFU) therapy. To comprehensively monitor and evaluate HIFU treatment, simultaneous MR-ARFI and MRT imaging (STARFI) have been proposed since 20121-5. Most of the STARFI researches were based on RF-spoiled GRE (spGRE), which was the most frequently used MRT sequence. In this study, STARFI based on coherent echo shifted (cES) sequence was proposed and comprehensively compared to the spGRE STARFI. The echo shifting gradients of cES makes the sequence motion sensitive. It was assumed that multiple pathways could contribute to the displacement accumulated phase without RF spoiling, making this sequence more sensitive to the HIFU pulse induced displacement. Simulation and experiments validated our hypothesis. The increased displacement sensitivity might lower the needed acoustic power for focalization and improve the safety of HIFU treatment.Theory and methods
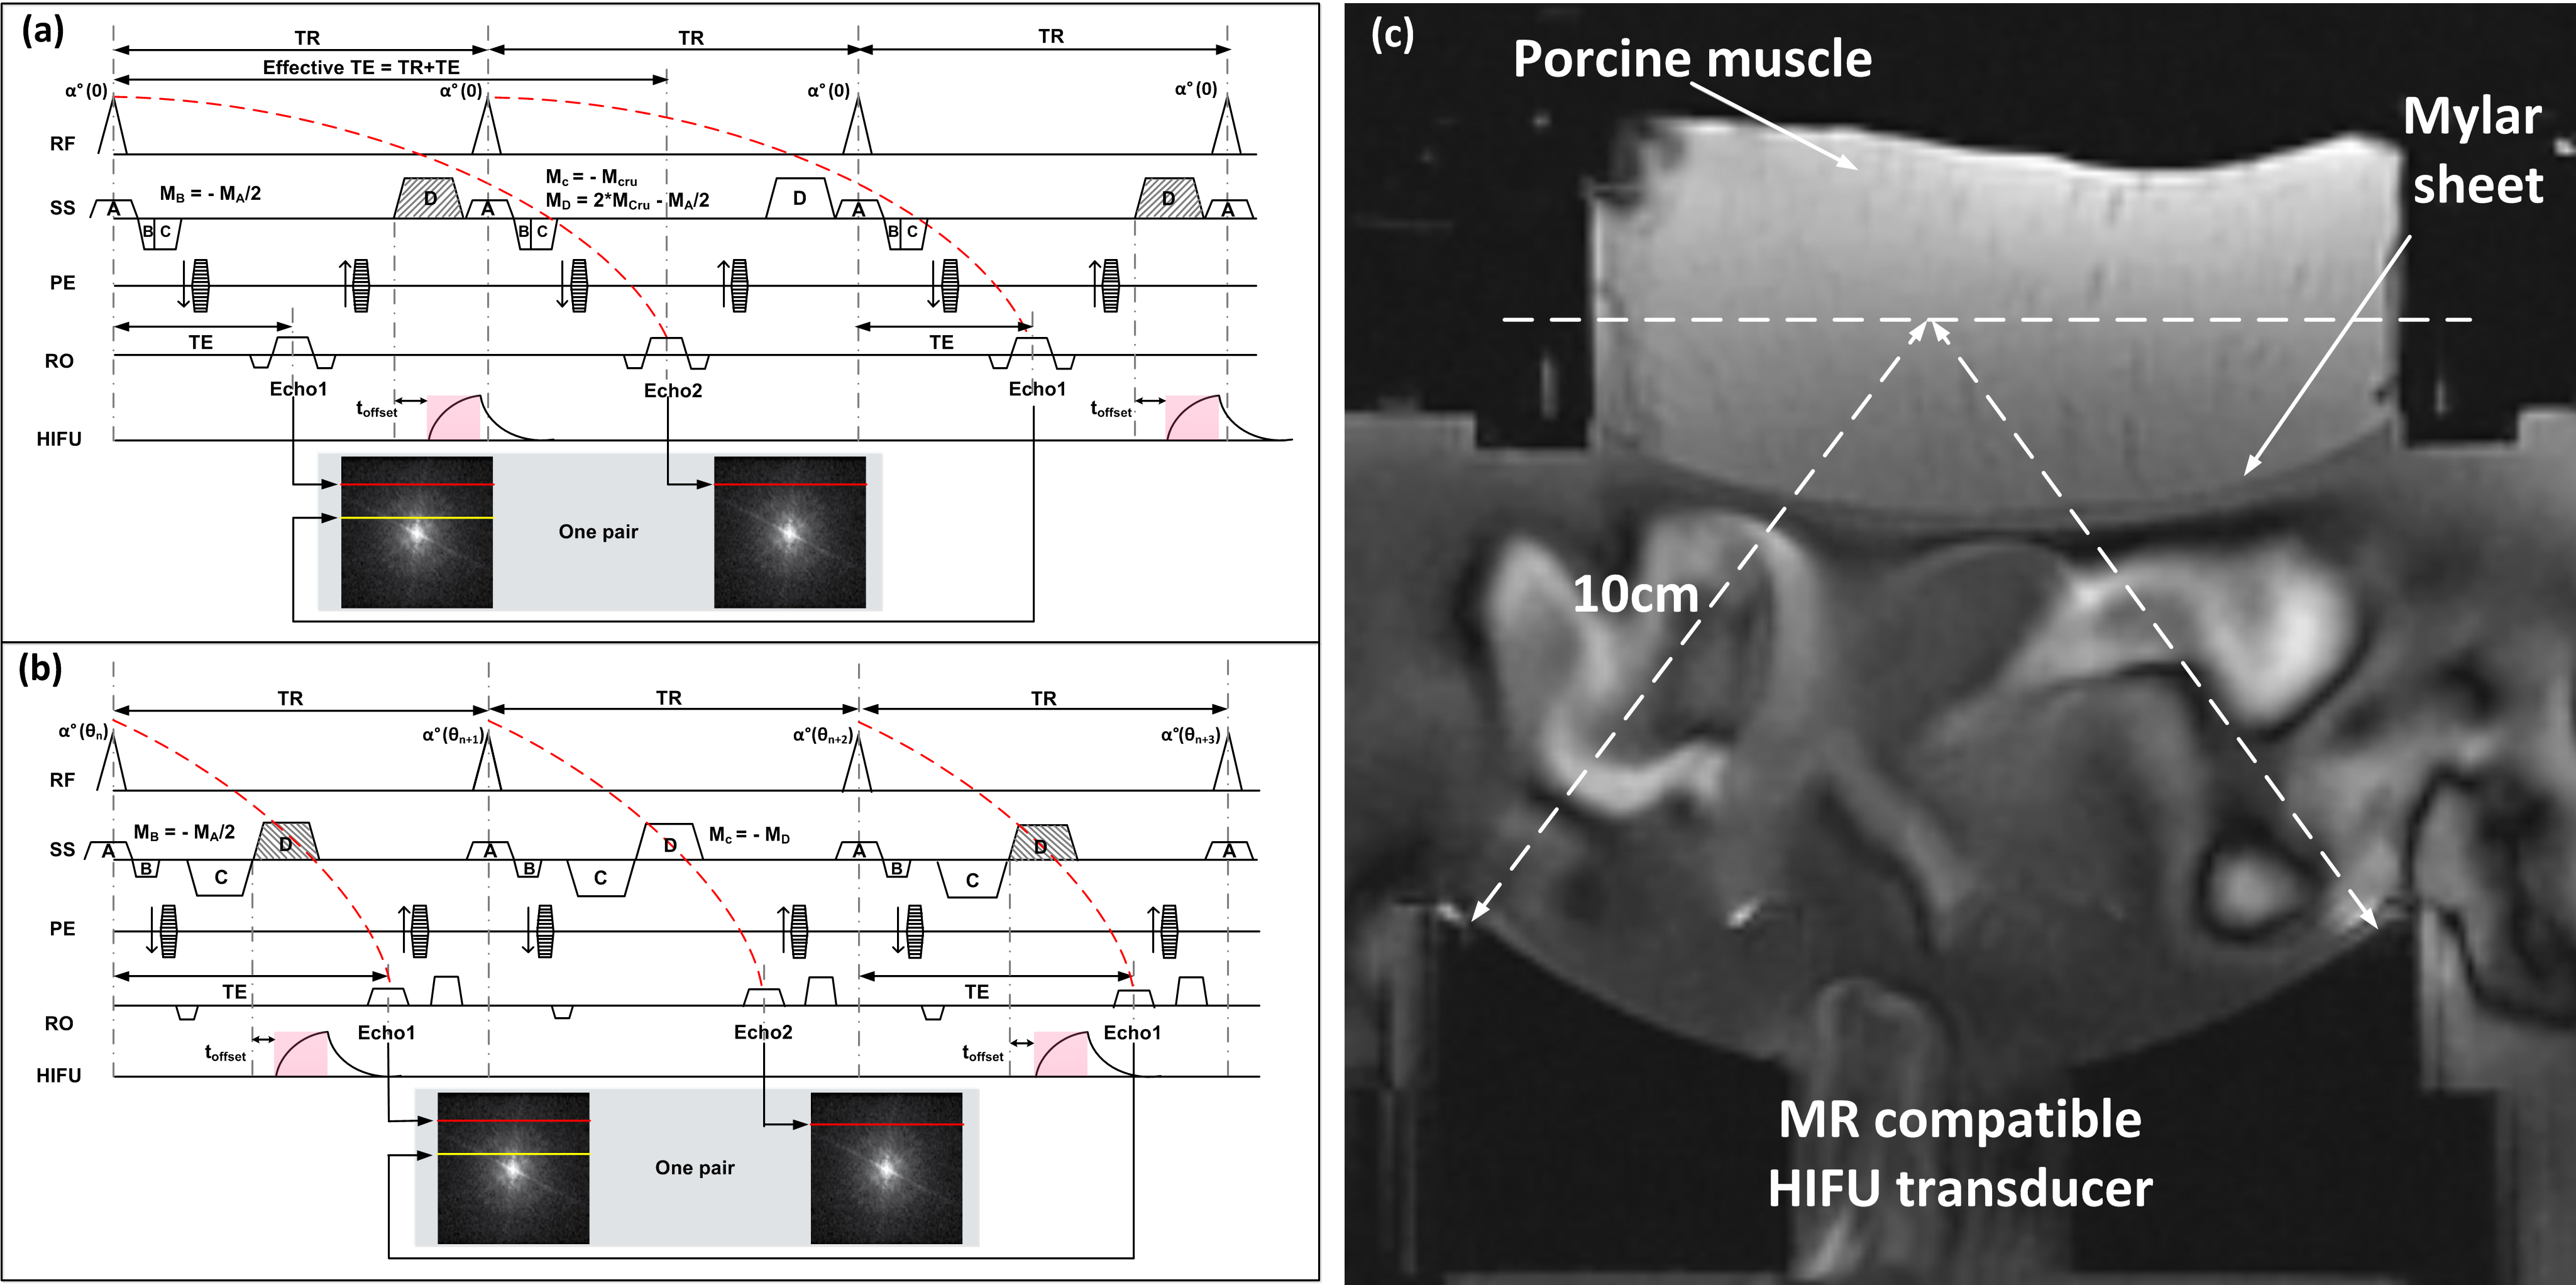
Fig 1. showed the cES and the spGRE sequences in our study. The HIFU pulse was interleaved ON/OFF in successive TRs. Based on the assumption that the temperature change between Echo 1 and Echo 2 was negligible, displacement could be separated by phase subtraction between the two echoes: $$D_{cES}=\frac{\triangle\phi_D}{2\pi\gamma M_D}=\frac{\phi_{echo2}-\phi_{echo1}}{2\pi\gamma M_D}$$ $$D_{spGRE}=\frac{\triangle\phi_D}{2\pi\gamma M_D}=\frac{\phi_{echo1}-\phi_{echo2}}{2\pi\gamma M_D}$$ ,where $$$\gamma$$$ is the gyro-magnetic ratio, $$$M_D$$$ is the moment of displacement encoding gradient (DEG). Four pairs of images before HIFU sonication were acquire to ensure that the steady state of MR signal had been reached. Image of pair #4 was used as the reference for temperature calculation, according to the following formulas: $$\triangle T_{cES}=\frac{\triangle \phi_T}{\alpha2\pi\gamma B_0TE_{eff}}=\frac{\phi_{echo1}-\phi_{ref_-echo1}}{\alpha2\pi\gamma B_0(TE+TR)}$$ $$ \triangle T_{spGRE}=\frac{\triangle \phi_T}{\alpha2\pi\gamma B_0TE}=\frac{\phi_{echo2}-\phi_{ref_-echo2}}{\alpha2\pi\gamma B_0TE}$$, where $$$\alpha$$$ (-0.01 ppm/ºC) is the PRFS coefficient6, B0 is the main magnetic field strength. Bloch equation was used to simulate the influence of T1/T2 on the calculated displacement of cES and spGRE STARFI. The instant tissue displacement at the focus was modeled based on overdamped harmonic response7. All MRI scans were performed on a 3.0T MR system (uMR790, Shanghai United Imaging Healthcare, Shanghai, China). The system set-ups was shown in Fig 1(c). The influence of the toffset on the displacement map was studied first to determine the optimal toffset used in the following experiments. The acoustic power was increased linearly to analysis the displacement sensitivity of these two sequences. Then the HIFU heating experiment was carried out, and monitored by both the cES and spGRE. The measurement differences between these two methods were compared.Results
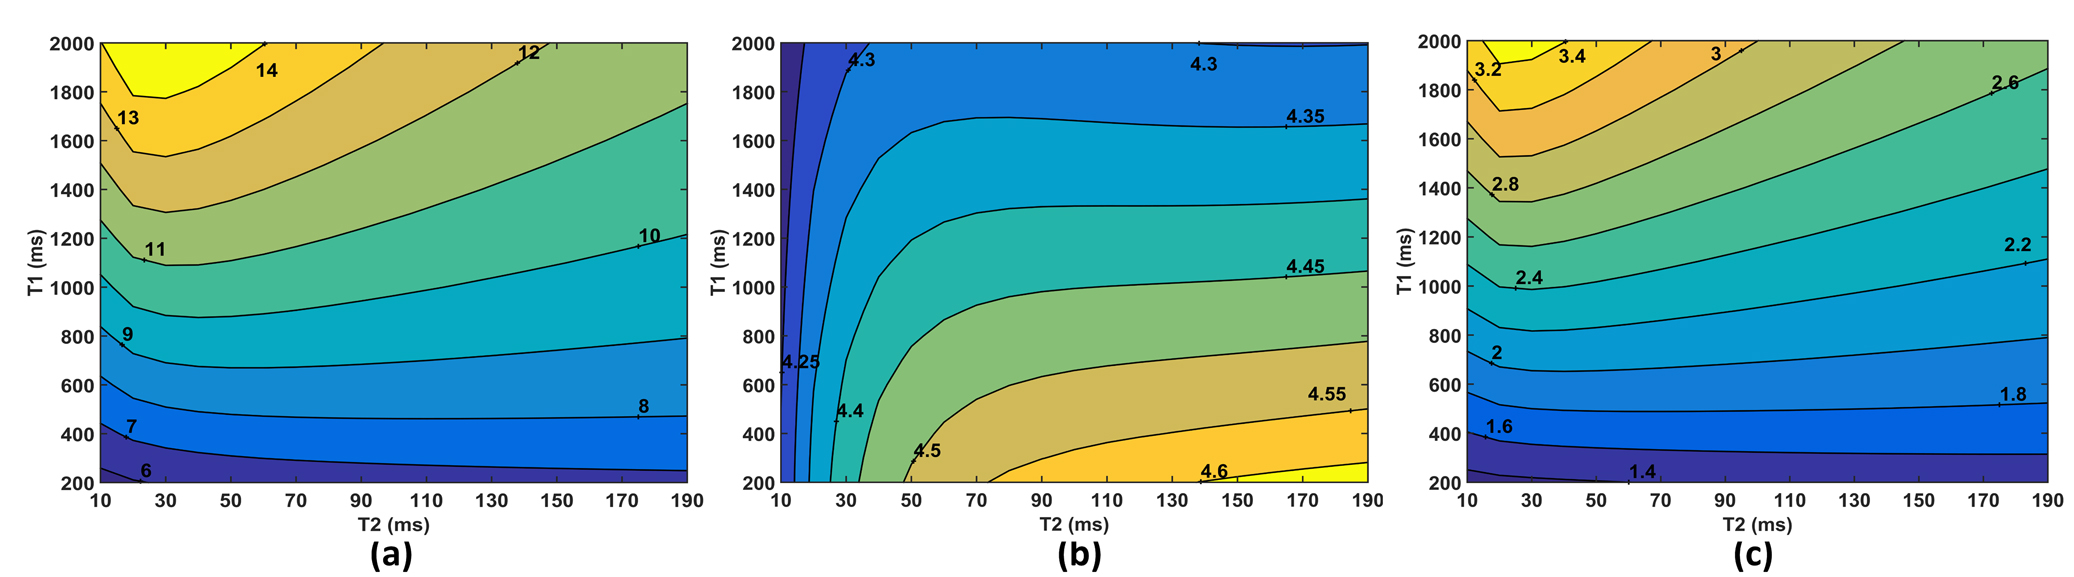
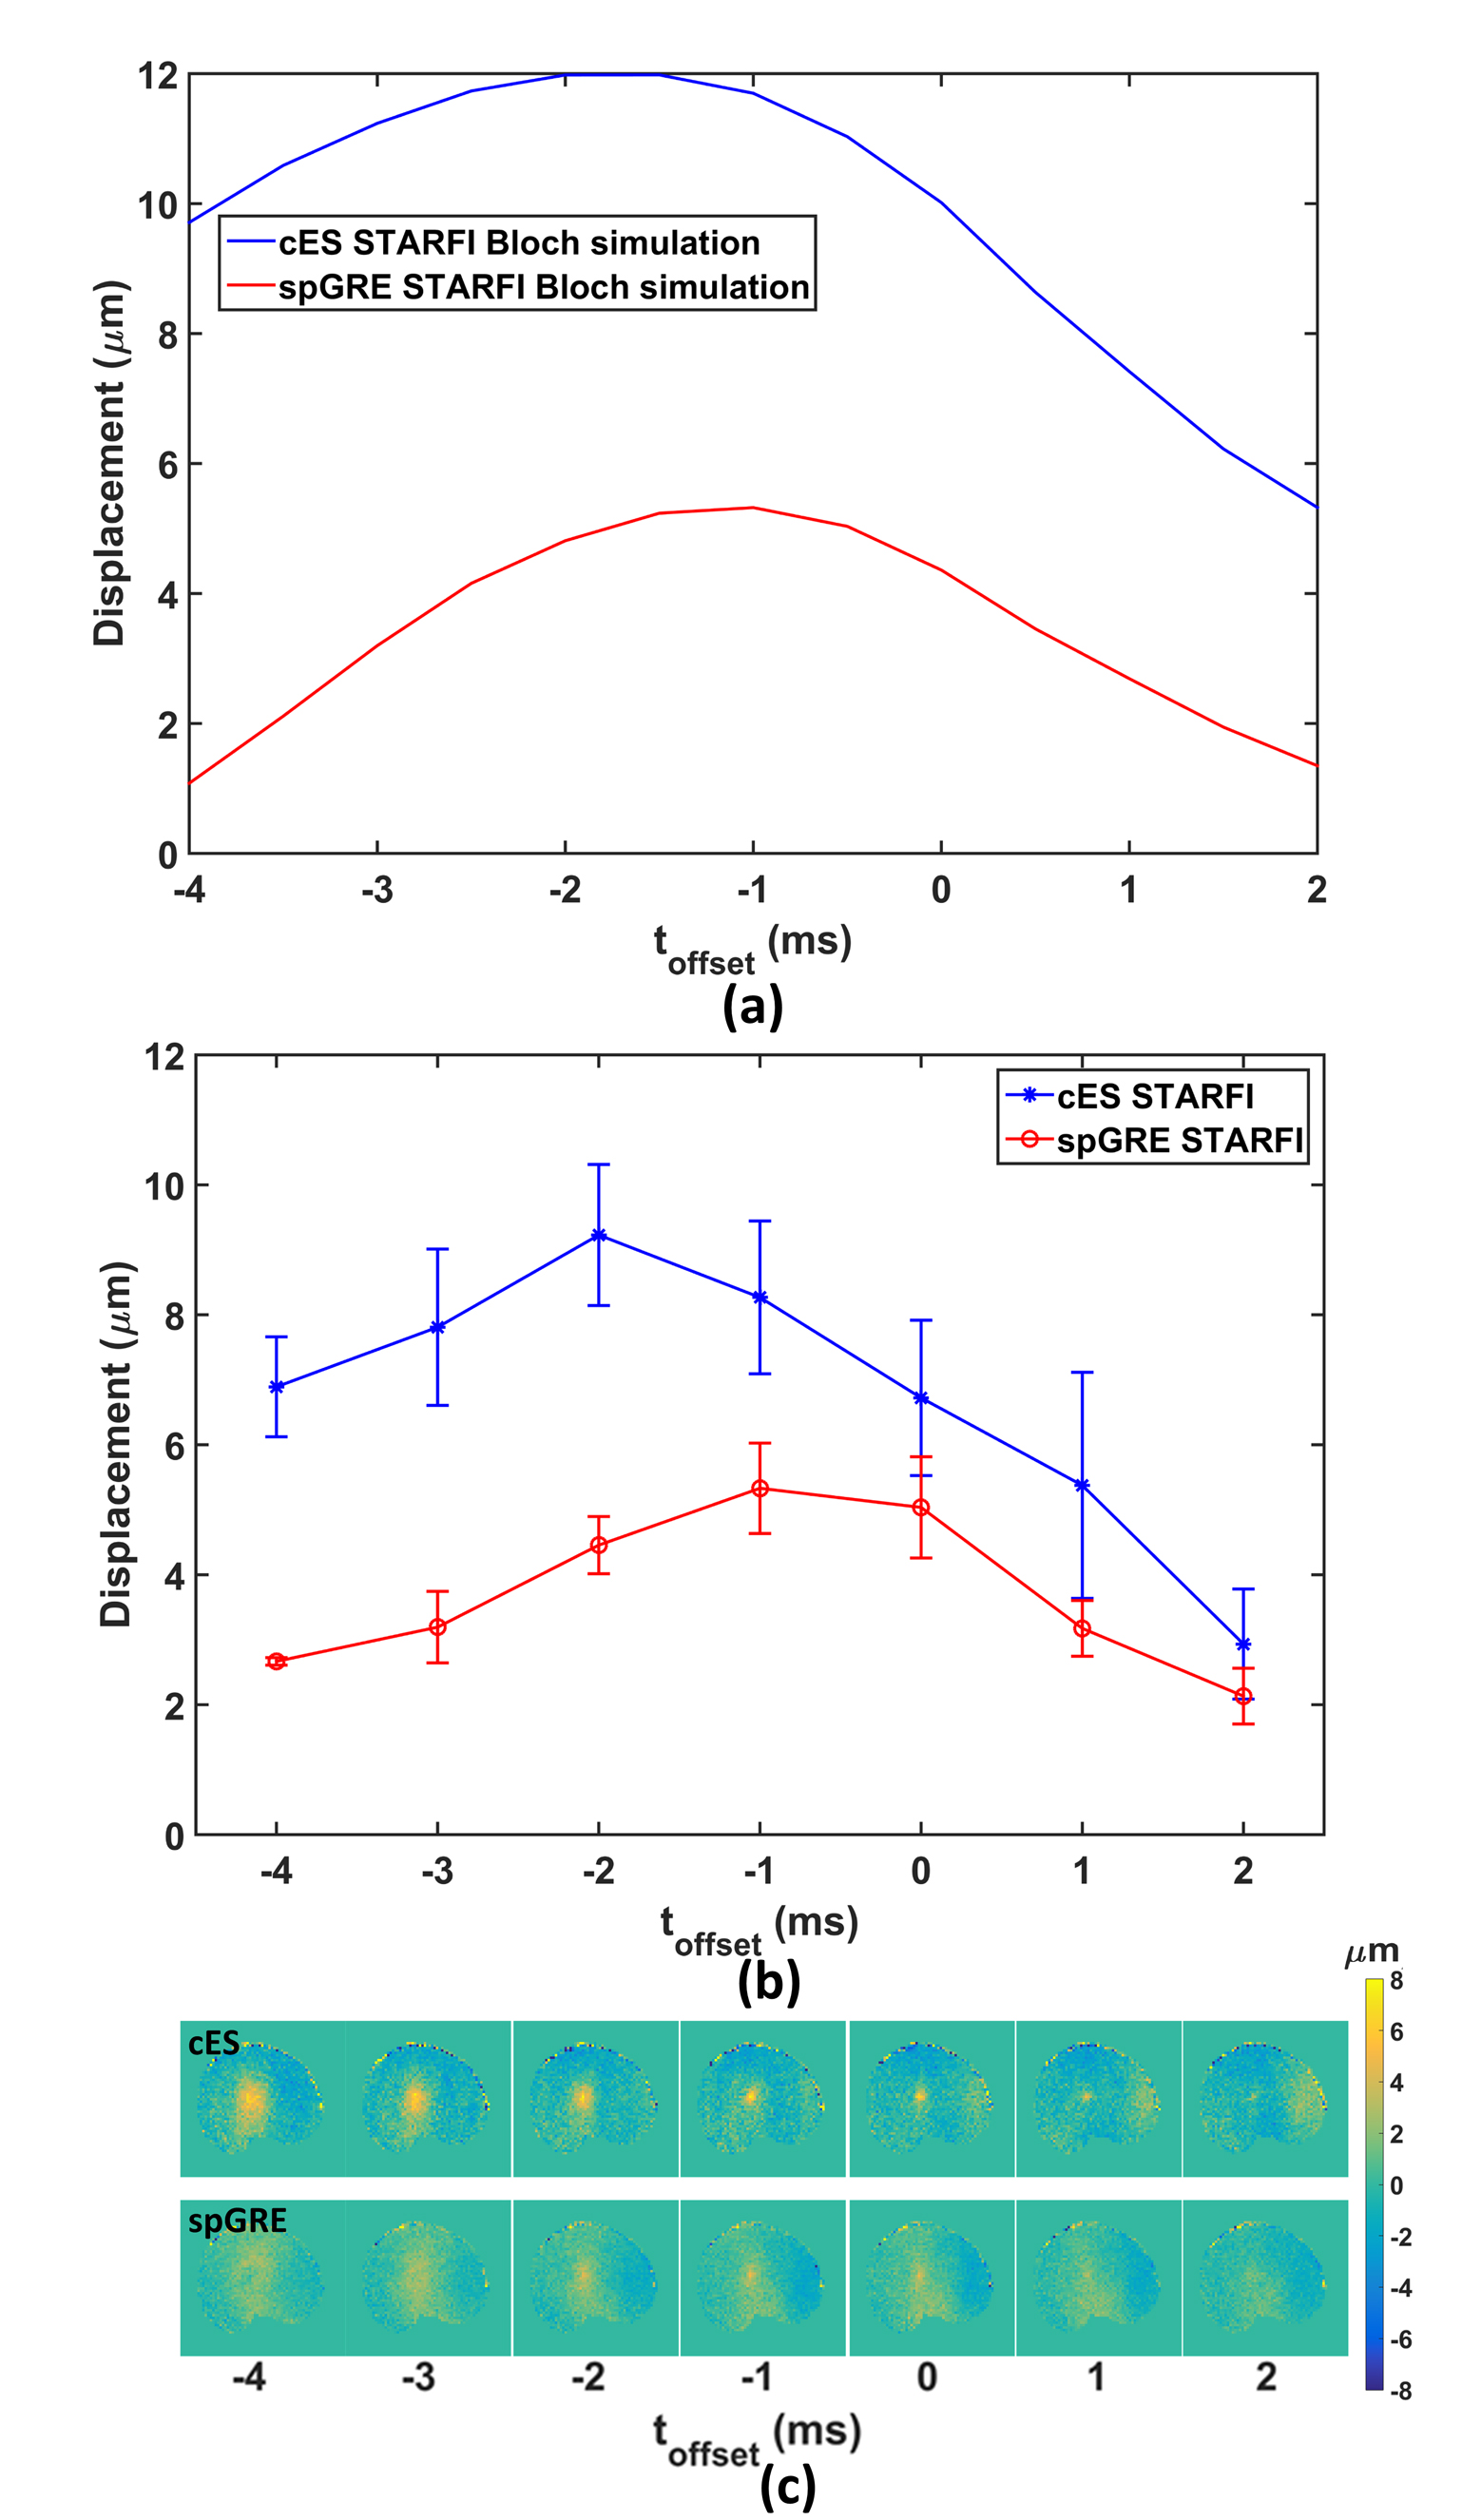
The Bloch simulation of displacement based on cES and spGRE STRAFI were given in Fig. 2 (a) and (b). The results demonstrated that the displacement obtained by cES was always larger than that obtained by spGRE STARFI. The displacement measured from cES STARFI becomes larger with prolonged T1. Comparatively, the displacement of spGRE STARFI shows little dependence on T1/T2.As illustrated in Fig.3, the toffset between the start time point of HIFU and the displacement encoding gradient (DEG) would have a significant influence on the calculated displacement of both cES and spGRE STARFI, while the input HIFU power and duration were kept constant. Figure 3(a) and (b) are the simulated and experimental displacements of cES and spGRE STARFI. The trends of simulation and experiments were in good accordance.
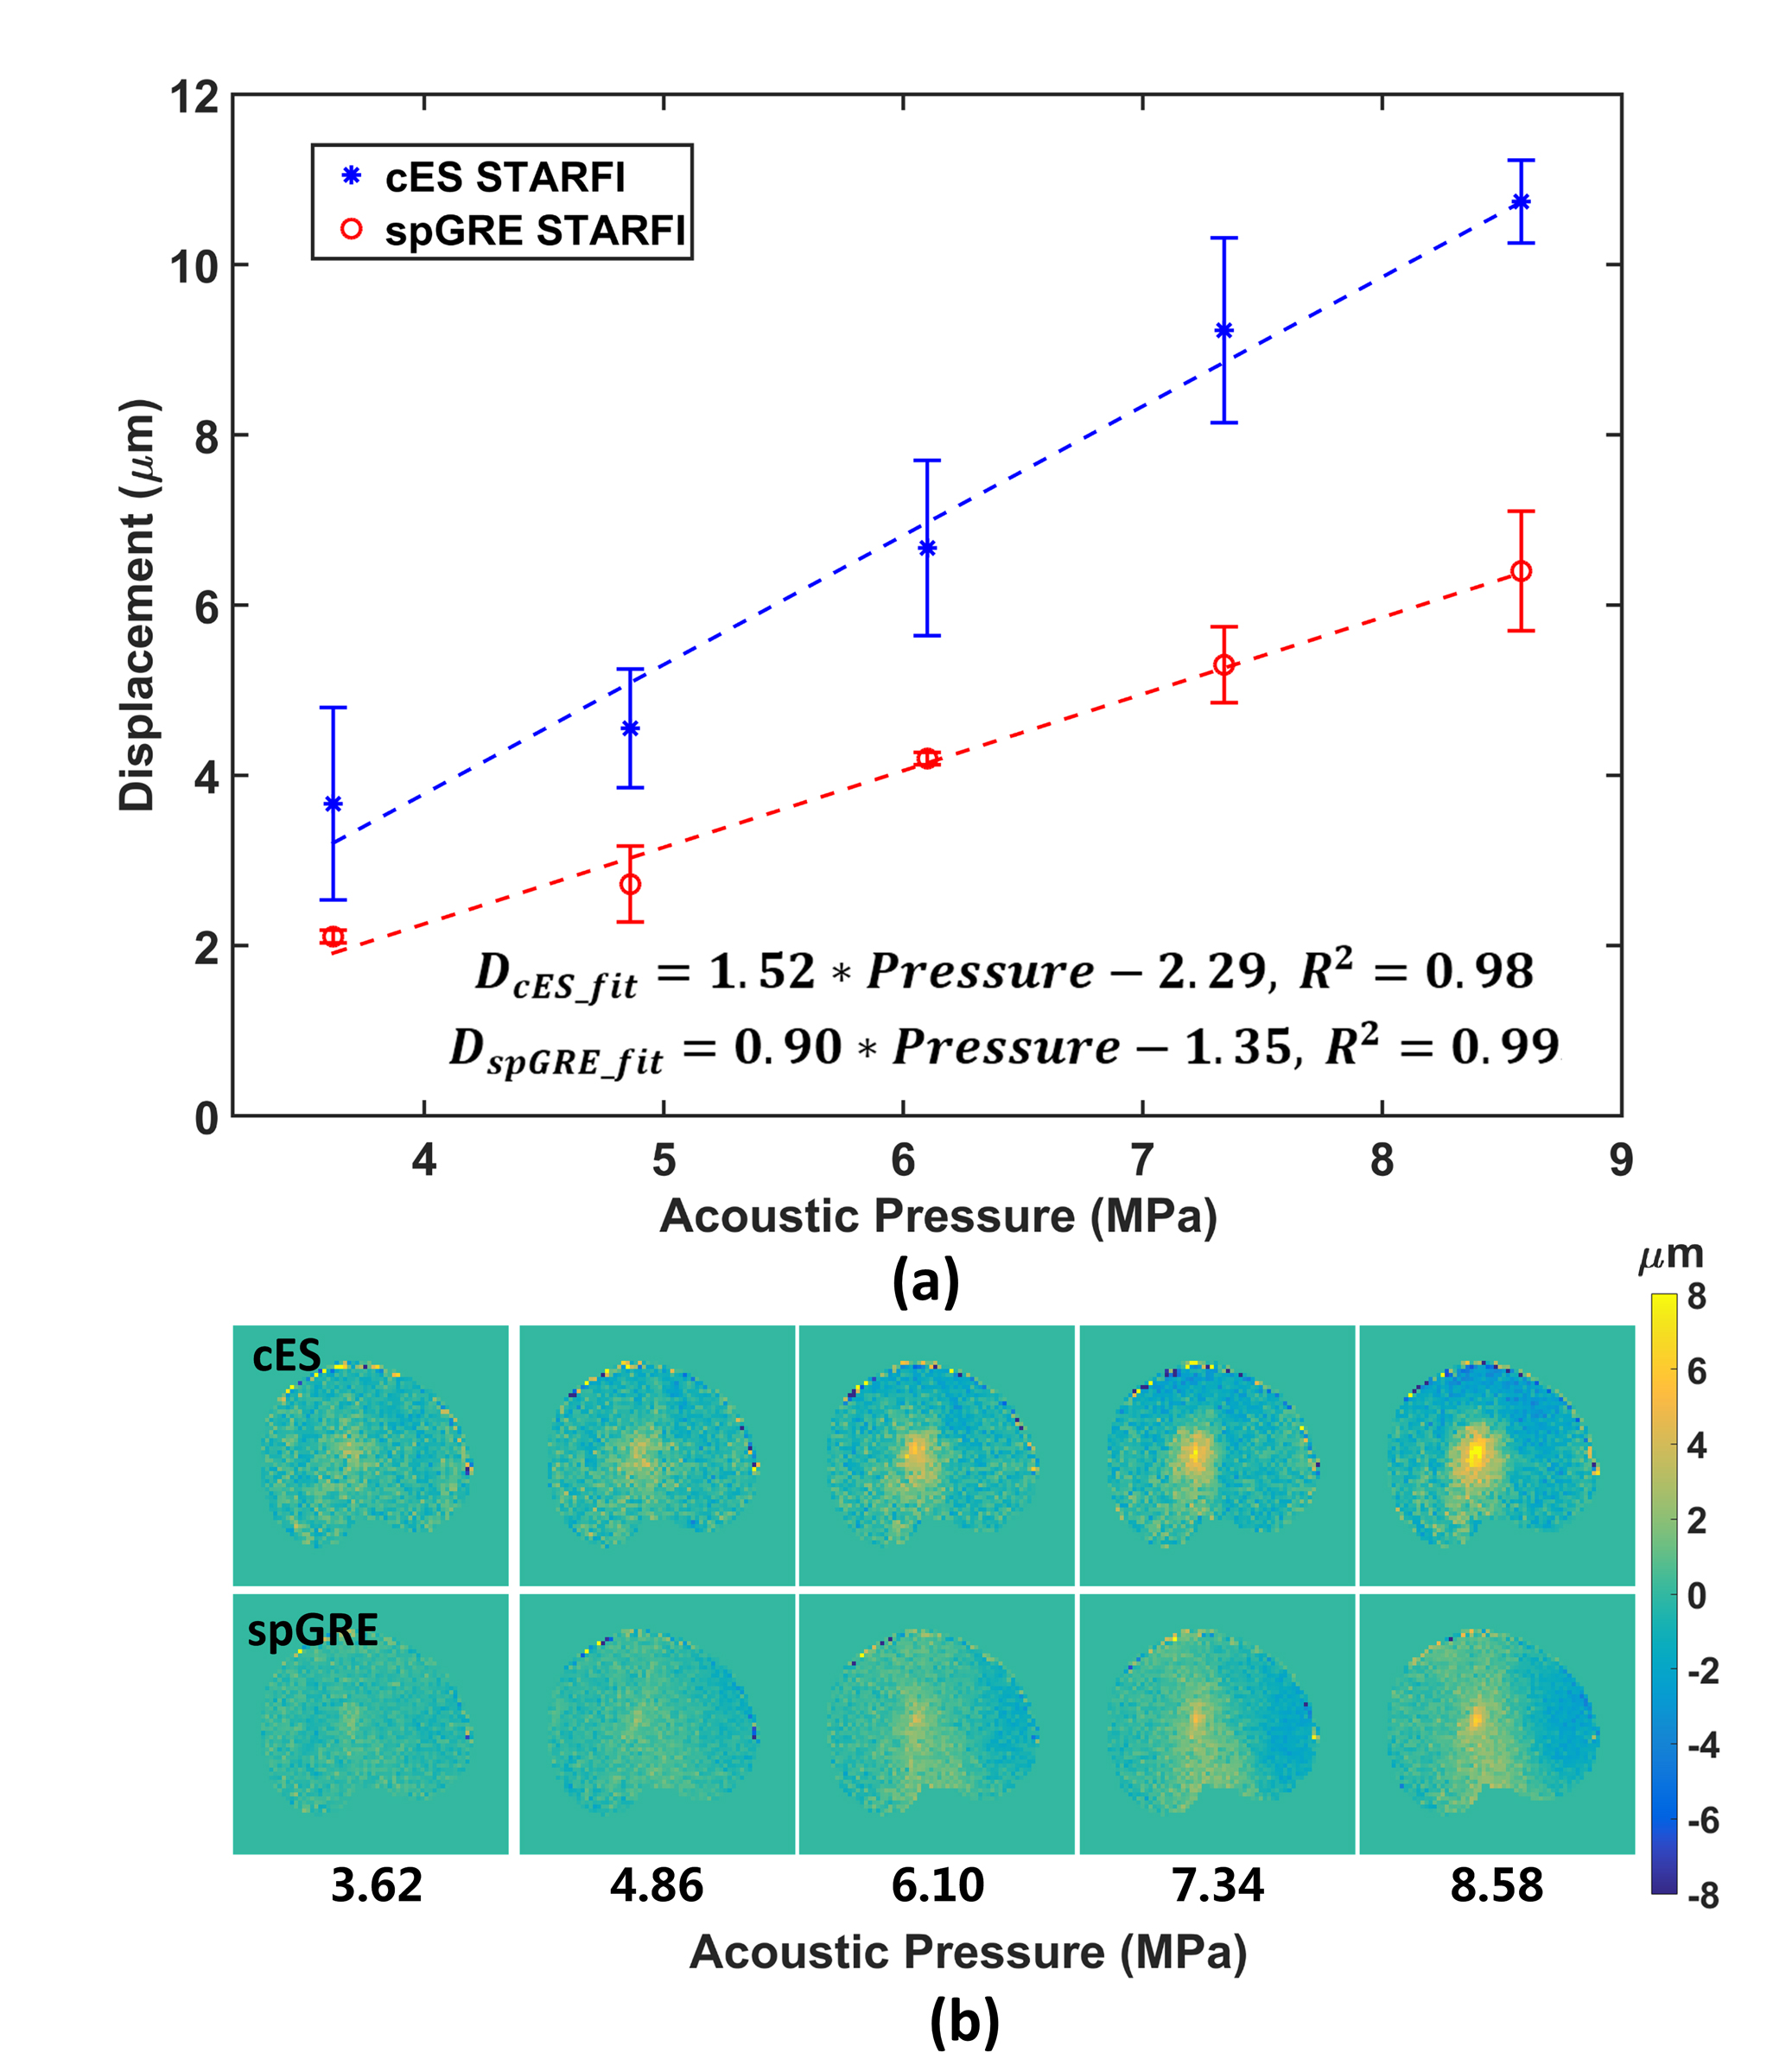
Fig 4 compared the displacement detected by cES and spGRE STARFI by linearly increasing the HIFU pressure. The measured apparent displacement was linearly increased with acoustic pressure for both sequences. However, their regression slopes were different. In the case of cES STARFI, the slope was 1.52 μm/MPa, while the slope of spGRE STARFI was only 0.90 μm/MPa.
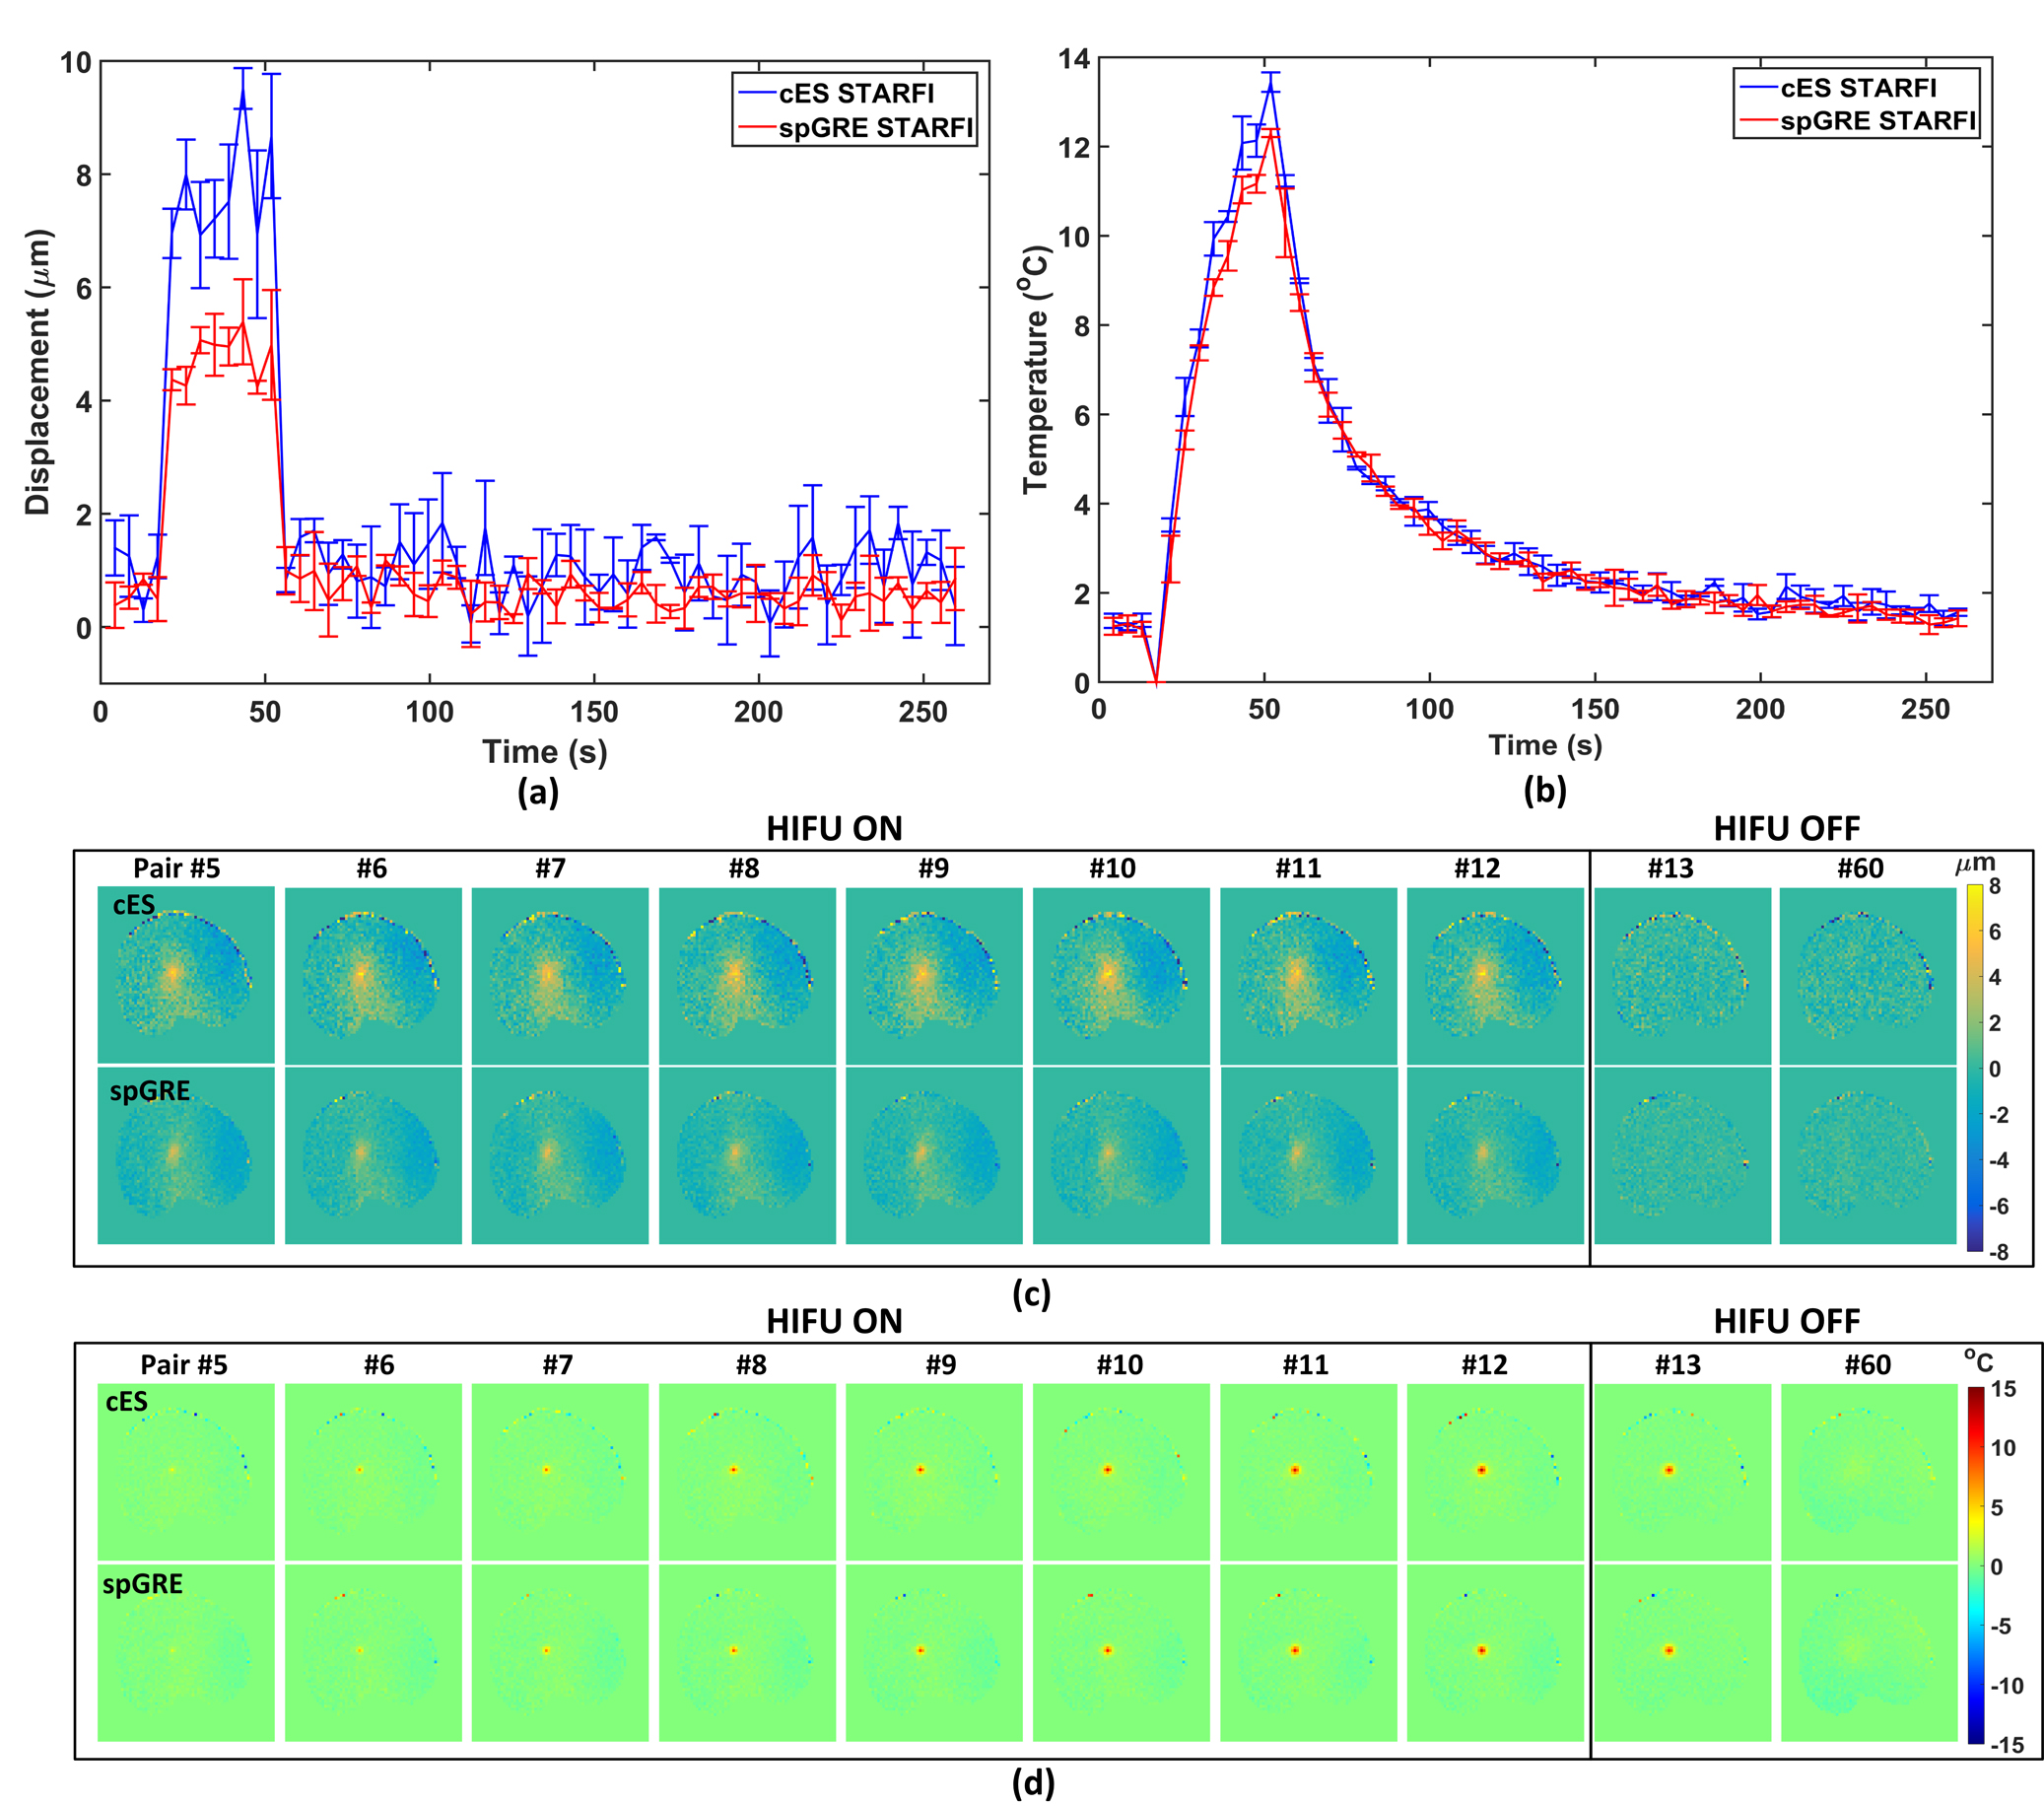
Fig. 5(a) revealed that the displacements calculated by cES STARFI were always larger than that of spGRE STARFI. Fig. 5(b) showed the temperature curves during the heating and cooling process. The maximum temperature rise in the focus was 13.44 ± 0.22 ºC when calculated by cES STARFI and 12.34 ± 0.09 ºC when calculated by spGRE STARFI at the end of HIFU sonication. The difference between the maximum temperature change of these two sequences was 1.10 ºC. The temperature change and the instantly acquired displacement curves showed great consistency between both sequences.
Discussion
Simultaneous MR-ARFI and MRT imaging based on cES was comprehensively compared to spGRE. The cES is more time efficient than spGRE STARFI, as cES allows TE to be greater than TR. Besides, the echo shifting gradients of cES was intrinsically motion sensitive, making the sequence suitable for MR-ARFI. In cES STARFI, gradient C and D were naturally separate in time. This time interval can facilitate to accumulate sufficient tissue displacement before the start of the DEG. Without RF spoiling, multiple pathways can contribute to the displacement induced phase change. Both the simulation and experiment results demonstrated that with the same HIFU input power and DEG moment, the apparent displacement obtained by cES STARFI was larger than spGRE. On the other hand, the HIFU heating experiment verified that the accuracy of the temperature monitoring was maintained.Conclusion
The sequence could be an alternative for comprehensively monitoring MR guided focused ultrasound treatment. The increased displacement sensitivity allows for lowering the needed acoustic power for focalization and improve the safety of HIFU treatment.Acknowledgements
This work was supported by the Key Laboratory for Magnetic Resonance and Multimodality Imaging of Guang-dong Province (No. 2014B030301013), the National Natural Science Foundation (Nos. 81327801, 81527901,11504401)References
1. Auboiroux V, Viallon M, Roland J, Hyacinthe JN, Petrusca L, Morel DR, Goget T, Terraz S, Gross P, Becker CD, Salomir R. ARFI-prepared MRgHIFU in liver: Simultaneous mapping of ARFI-displacement and temperature elevation, using a fast GRE-EPI sequence. Magnet Reson Med 2012;68(3):932-946. 2. Kaye EA, Pauly KB. Adapting MRI acoustic radiation force imaging for in vivo human brain focused ultrasound applications. Magnet Reson Med 2013;69(3):724-733.
3. Mougenot C, Waspe A, Looi T, Drake JM. Variable ultrasound trigger delay for improved magnetic resonance acoustic radiation force imaging. Phys Med Biol 2016;61(2):712-727.
4. Bour P, Marquet F, Ozenne V, Toupin S, Dumont E, Aubry JF, Lepetit-Coiffe M, Quesson B. Real-time monitoring of tissue displacement and temperature changes during MR-guided high intensity focused ultrasound. Magnet Reson Med 2017, 78(5): 1911-1921.
5. de Bever JT, Odeen H, Hofstetter LW, Parker DL. Simultaneous MR thermometry and acoustic radiation force imaging using interleaved acquisition. Magnet Reson Med 2018;79(3):1515-1524.
6. Poorter JD, Wagter CD, Deene YD, Thomsen C, Ståhlberg F, Achten E. Noninvasive MRI thermometry with the proton resonance frequency (PRF) method: in vivo results in human muscle. Magnet Reson Med 1995;33(1):74-81.
7. Souchon R, Salomir R, Beuf O, Milot L, Grenier D, Lyonnet D, Chapelon J-Y, Rouvière O. Transient MR elastography (t-MRE) using ultrasound radiation force: Theory, safety, and initial experiments in vitro. Magnet Reson Med 2008;60(4):871-881.
Figures