0101
Investigation of RF heating risk during MRI-guided cryoablation at 1.5T
Aiming Lu1, Christopher P Favazza1, David A Woodrum1, Joel P Felmlee1, Jacinta Browne1, Brian T Welch1, and Krzysztof R Gorny1
1Radiology, Mayo Clinic, Rochester, MN, United States
1Radiology, Mayo Clinic, Rochester, MN, United States
Synopsis
Cryoablation with MRI guidance is desirable is a feasible treatment for localized tumors. There is a MRI-conditional cryoablation system and, to the best of our knowledge, no previous report of RF heating/burn incidence. However, since the cryoneedles are metallic and the gas lines have metallic components, potential risks of RF heating/burn exists. In fact, an incidence of skin burn recently occurred in our institution during a MRI-guided liver treatment case. In this work, we demonstrated that RF heating could be significant during MRI-guided cryoablation and showed that several strategies could be potentially used to mitigate the risk.
Introduction
MRI-guided Cryoablation is a desirable minimally invasive treatment for localized tumors as MRI allows for guiding cryoprobe placement into the target tissue, monitoring treatment progress in real-time and assessing the treatment outcome1-12. Clinically, cryoablation is usually performed with a FDA-approved MRI-conditional system. The cryoneedles used by this system are metallic (Inconel) and the gas lines routing pressurized gases to the cryoneedles also have metallic components (70/30 Cu/Ni), thus RF heating/burn could potentially occur during MRI. Although no such incidents have been reported, a RF skin burn incidence occurred recently during a MRI-guided liver cryoablation in our institution. In this work, we demonstrate the RF heating risk during MRI-guided cryoablation and potential strategies to mitigate the risk in a set of phantom experiments.Materials and methods
Experiments were performed on a 1.5T scanner (Ingenia, Philips Healthcare, Best, Netherlands) using the Visual-ICE MRI system (Galil Medical, Yokneam, Israel) on porcine tissue phantoms. RF heating during MRI was investigated suing two routinely used pulse sequences during our procedures: a T2-weighted (T2W) sequence (SAR 2.1W/kg, scan time: 2’20’’) for cryoneedle location verification and treatment assessment, and a proton density-weighted (PDW) sequence (SAR 1.9 W/kg, scan time 34s) for monitoring the active treatment. The T2W sequence was used in this study by default. The PDW sequence was only used to study the impact of SAR on RF heating by modify its refocusing flip angle and RF pulse type to achieve SAR levels of 1.2 W/kg nad 0.7 W/kg as well. The Visual-ICE system was thoroughly inspected by the manufacturer and confirmed that there were no faulty components. Cryoneedles (IceRod MRI 1.5 straight/bent (90°), 17.5cm shaft length, 17G) and gas lines were positioned similar to configurations commonly used in prostate and liver/non-prostate treatments, as shown in Figure 1. Unless otherwise mentioned, a 14G catheter needle (AngiocathTM) was used to aid the cryoneed insertion, as is often done in our practice. A straight IceRod cryoneedle was advanced inside catheter into the phantom. The gas line was connected to the Visual-ICE system via a mobile connection panel (MCP). Fiber-optic temperature sensors (Neoptix, Qualitrol, Fairport, NY) were placed adjacent to the cryoneedle at the surface of the phantom and/or the tip of the cryoneedle to record temperature changes during imaging in all tests. In the “prostate” configuration, an acrylic grid was used for guiding cryoneedle-insertion and the IceRod cryoneedle was advanced ~8cm into the phantom using an Angiocath through the center and 4 corner grid holes. The center hole was roughly aligned to the scan bore center. At the grid location with the highest heating, the measurement was repeated with the cryoneedle inserted 2,4,6,8 and 10 cm into the phantom. In the “liver/non-prostate” configuration, the cryoneedle was inserted ~10cm into the phantom. Three experiments were conducted with the angiocath. In experiment 1, the gas line was run close to side of the bore. In experiment 2, both the straight and bent Ice-Rod needles were tested with the gas line run along roughly the center of the bore and along the side of the bore, respectively. In experiment 3, two tests were done with the MCP located close to the bore (Figure 1b) with and without the gas line connected to it. The third test was done with the MCP ~1m away from the bore ( distance limited by the gas line length) with the gas line connected to it. In experiment 4, the gas line run roughly along the side of the bore and tests were done with and without the angiocath.Results and discussion
RF heating was consistently observed in the experiments. For the prostate configuration, the measured temperature change during the T2W sequence at the surface of the phantom varied with cryoneedle insertion locations and depth. The highest temperature increase was 6.3°C when the cryoneedle was furthest from bore center (~5cm). Virtually no heating was observed when the gas line was disconnected from the MCP. In the liver configuration, significant (>85°C) and rapid (1.9°C/sec) temperature increases were observed in experiment 1. As shown in Figure 2, the angiocath used was charred near the tip, and signs of RF burns were observed along its length. Similar heating were found for straight and bent cryoprobes in experiment 2 (Figure 3,). Heating was strongly dependent on configuration of cryoneedle and the gas line. Positioning the cryoneedle gas lines along the bore center resulted in significant heating reduction. Figure 4 shows that the heating reduced with lowering SAR. Disconnecting the gas line from the MCP during MRI resulted in negligible RF heating. Moving the MCP away from the bore also appeared to reduce the heating. In experiment 4, temperature increases as high as 80°C were observed near the tip of the cryoneedle with the Angiocath, whereas a much lower temperature increase of ~20°C was observed without the Angiocath.Conclusion
Significant RF heating/burn from MRI has been observed during cryoablation depending on the configuration of the cryoneedles and gas lines. We have demonstrated several strategies which could be used to mitigate these risks, including careful configuration of the cryoneedles and gas lines, using low SAR sequences, disconnecting the gas lines when possible and optimally positioning the MCP unit.Acknowledgements
No acknowledgement found.References
1. van Oostenbrugge TJ, Langenhuijsen JF, Overduin CT, et al. J Vasc Interv Radiol 2017; 28(8): 1098-1107 2. Overduin CG, Jenniskens SFM, Sedelaar JPM, et al. Eur Radiol 2017; 27(11): 4828-483 3. Sewell PE, Howard JC, Shingleton WB, Harrison RB. South Med J 2003; 96(7): 708-710 4. Tatli S, Acar M, Tuncali K, et al. Diagn Interv Radiol 2010; 16(1): 90-95 5. Gangi A, Tsoumakidou G, Abdelli O, et al. Eur Radiol 2012; 22(8): 1829-1835 6. Aghayev A, Tatli S. Expert Rev Med Devices 2014; 11(1): 41-52 7. Glazer DI, Tatli S, Shyn PB, et al. AJR Am J Roentgenol 2017; 209(6): 1381-1389 8. Kinsman KA, White ML, Mynderse LA. Cardiovasc Intervent Radiol 2017; doi: 10.1007/s00270-017-1799-6 9. Woodrum DA, Kawashima A, Gorny KR, Mynderse LA. Magn Reson Imaging Clin N Am 2015; 23(4): 607-61910. Woodrum DA, Kawashima A, Karnes RJ. Urology 2013; 82(4): 870-87511. Ahrar K, Ahrar JU, Javadi S, et al. Invest Radiol. 2013 Jun; 48(6): 437–444.12. Bomers JG, Yakar D, Overduin, et al., Radiology 2013, 268:451-460.Figures
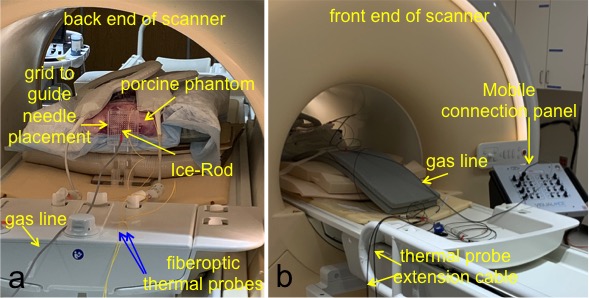
Fig 1. Experimental setup. a) “prostate” configuration where the cryoneedles are often inserted near iso-center and the gas lines run along the longitudinal direction. b) “liver/non-prostate” configuration where the cryoneedles are often inserted at certain angle in a transverse/oblique plane and the gas lines are run either on top of the patient in the middle of the bore or close to the edge of the bore.
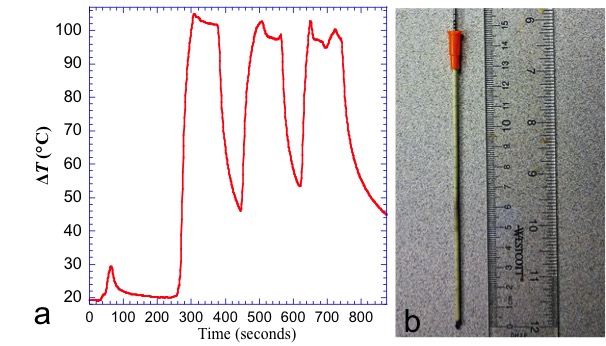
Fig 2. Significant temperature increase has been observed in the “liver/non-prostate” configuration when the gas line was run near the edge of the bore. (a) temperature measured at the surface of the phantom during the localizer sequence and T2W sequence (which were run three times). (b) the Angiocath was charred at the tip and shows burn marks along it.
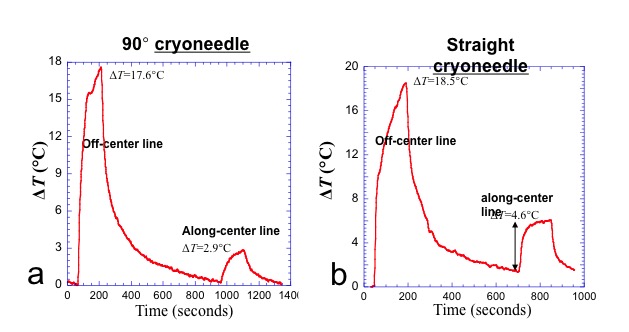
Fig 3. Plots show 90°and straight cryoneedle produced similar RF heating when configurations were similar. The T2W sequence was run twice with the gas placed away from the center of the bore and placed along the center of the bore. The temperature changes are very configuration dependent. a) 90° cryoneedle b) straight-needle.
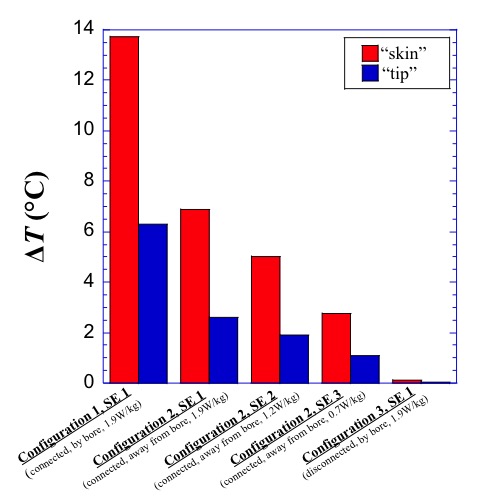
Fig 4. Bar graph shows the impact of the SAR level, location of the MCP, and whether the gas line was connected to the MCP on the RF heating near the tip of the cryoneedle and the surface of the phantom using the PDW sequence.