0100
Characterising thalamic and anterior cingulate GABA, Glx and GSH in the neonatal brain with HERMES1Centre for the Developing Brain, School of Biomedical Engineering and Imaging Sciences, King's College London, London, United Kingdom, 2Russell H. Morgan Department of Radiology and Radiological Science, Johns Hopkins School of Medicine, Baltimore, MD, United States, 3F.M. Kirby Research Center for Functional Brain Imaging, Kennedy Krieger Institute, Baltimore, MD, United States, 4Department of Forensic and Neurodevelopmental Sciences, Institute of Psychiatry, Psychology & Neuroscience, King's College London, London, United Kingdom, 5Department of Bioengineering, South Kensington Campus, Imperial College London, London, United Kingdom, 6Biomedical Engineering Department, School of Biomedical Engineering and Imaging Sciences, King's College London, London, United Kingdom
Synopsis
We measured GABA, Glx and GSH levels in a population of healthy neonates, using HERMES at 3T. We show that HERMES can be used to measure significant regional differences (in this case between the thalamus and anterior cingulate cortex). Further application of this method to study how these levels and balance are altered by early-life brain injury or genetic risk can provide important new knowledge about the pathophysiology underlying neurodevelopmental disorders.
INTRODUCTION:
The neuronal-glial unit has a fundamental role during early brain development. Central to this is healthy functioning of the main inhibitory and excitatory neurotransmitters GABA and Glutamate and the protective role of the major antioxidant glutathione (GSH). This early-life interplay between Glu, GABA, and GSH is crucial for regulating synapse activity and maturation1,2.Disruption to components of this carefully regulated system has life-long effects on brain organization and function. GABA, Glu, and GSH have all been implicated in the pathophysiology of several psychiatric disorders and neurodevelopmental conditions including Autism Spectrum Disorder3. However, until recently there has been no means to non-invasively measure glutamate, GABA and GSH together in the living human brain, let alone in the critical period of early development.
Using the recently described HERMES4 MRS sequence, in vivo overlapping GABA, Glx (glutamate+glutamine) and GSH signals can be detected simultaneously within a single experiment. Editing pulses are applied at 4.56ppm (GSHON), at 1.9ppm (GABAON), at both offsets simultaneously, at either, or neither. Hadamard combinations of the four sub-experiments yield GABA/Glx and GSH edited spectra without crosstalk or overlap.
There are several challenges inherent to studying low-concentration metabolites in neonates due to their small brain size (leading to difficulties with reliable shimming and partial volume effects), head movement during acquisition, and decreased SNR due to lower-than-adult GABA levels. As a result, only three studies have previously measured GABA with MRS in the neonatal period5,6,7. These have however used MEGA-PRESS8, which only provides GABA/Glx edited spectra. None have measured GSH despite its importance in controlling oxidative stress.
AIM:
We measured GABA, Glx and GSH levels in a population of healthy neonates, using HERMES at 3T. We aimed to see if regional differences could be identified between two areas (thalamus and anterior cingulate cortex, ACC) where dysfunction has been implicated in the pathophysiology of neurodevelopmental disorders.METHODS:
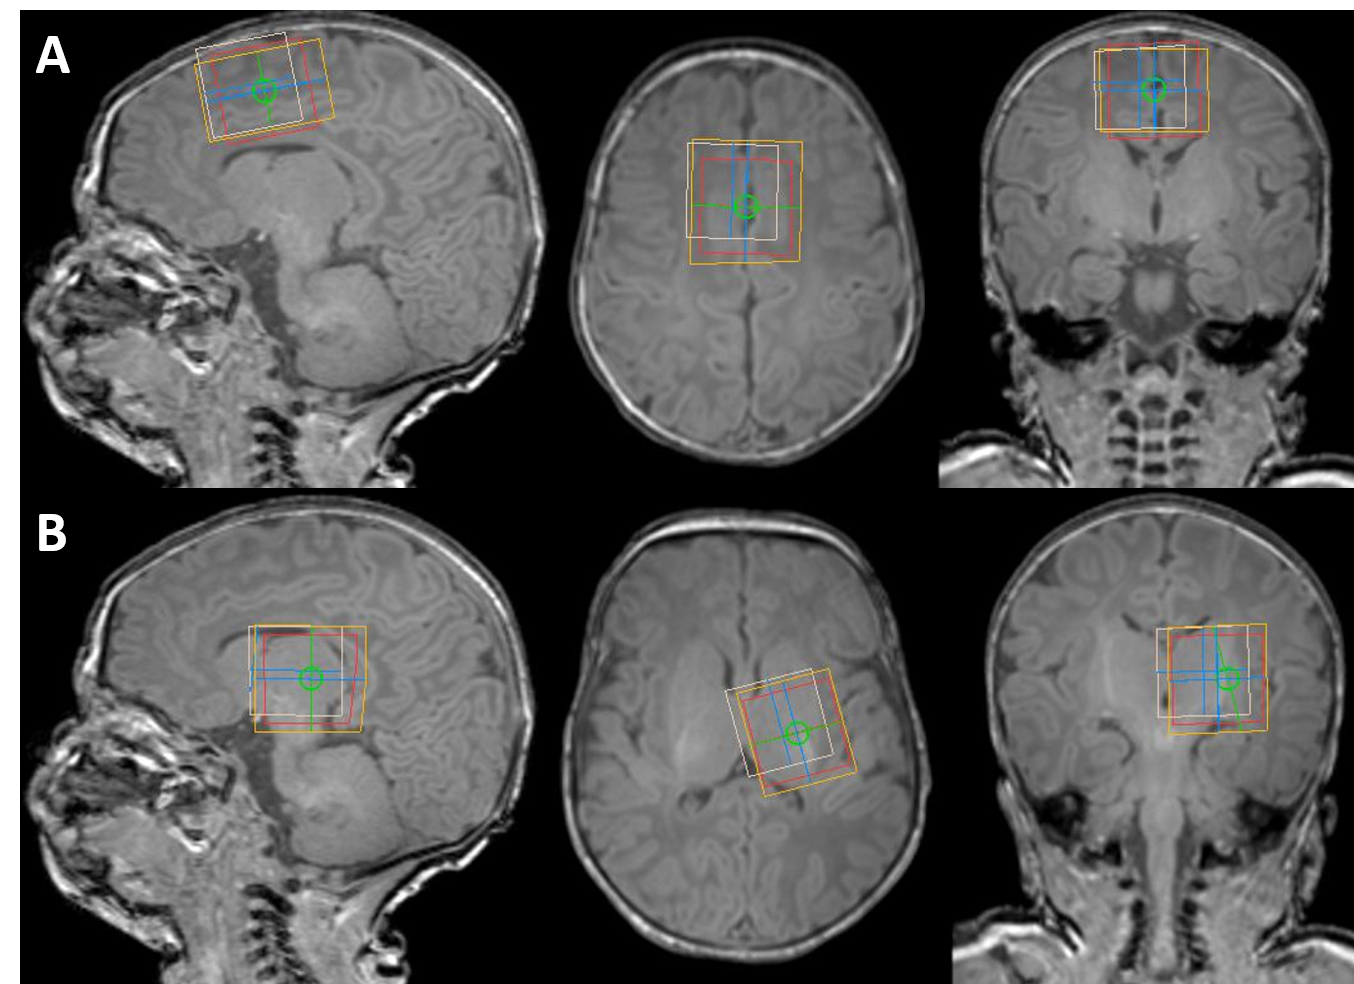
Subjects Nine healthy neonates were recruited, median age at scan: 41 (range: 39-47) weeks, median age at birth: 39 (31-41) weeks.Imaging Subjects were scanned without sedation following feeding on a Philips Achieva 3T scanner at the neonatal intensive care unit at St. Thomas’ Hospital London (32-channel head coil). A continuous soundtrack of recorded fMRI sequence gradient noise was used to help settle the baby and reduce the disturbing characteristic stop‐start noise pattern associated with the transition between acquisition sequences. Anatomical data were collected using MPRAGE. MRS data were acquired in two different voxels following ‘pencil-beam’ shimming: left thalamus 25x25x25mm3 and anterior cingulate cortex 31.25x25x20mm3 (see Figure 1), using HERMES (TR=2s, TE=80ms, 2kHz receiver bandwidth, 2048 data points, 320 averages, 90° excitation/180° refocusing pulses and 20ms editing pulses at 1.9 ppm and 4.56 ppm, VAPOR water suppression). Short-TE PRESS spectra were also acquired for the same voxels (TR=2s, TE=30ms, 64 averages) as well as spectra without water suppression, as a reference and for subsequent eddy current correction.
Analysis HERMES MRS data were pre-processed (eddy current correction, spectral registration) using Gannet 3.09. GABA, Glx and GSH levels were quantified relative to the unsuppressed water signal. Fit errors were also calculated. Following qualitative evaluation, 2 ACC datasets were excluded from further analysis due to movement artefacts.
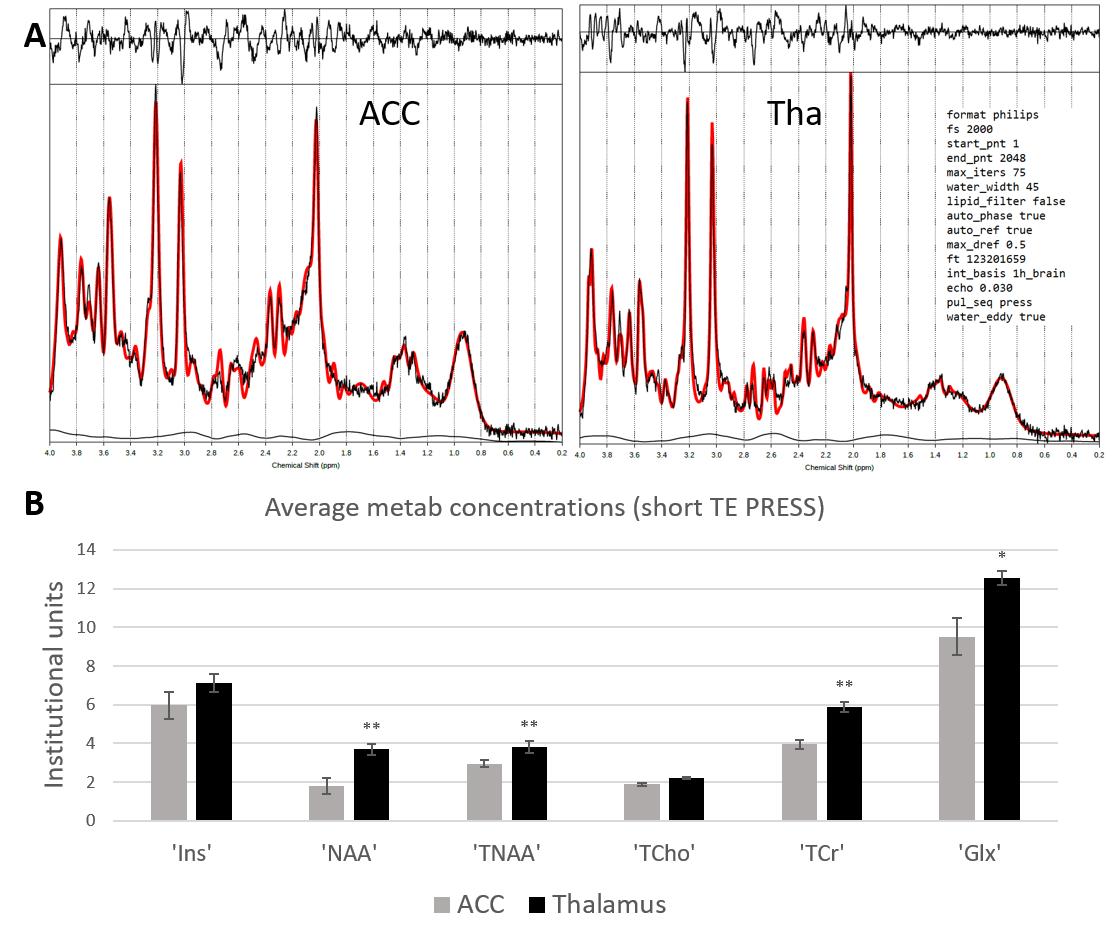
PRESS MRS data were pre-processed (eddy current correction, spectral registration) and fitted in TARQUIN10 using the default 1h_brain basis set and fitting parameters as described in Figure 3. Metabolites total creatine (tCr), glutamate+glutamine (Glx), myo-inositol (Ins), total N-acetyl-aspartate (tNAA=NAA+NAAG), NAA and total choline (tCho) were analysed.
All metabolites concentrations were estimated with respect to the unsuppressed water reference (using the Gannet/TARQUIN default relaxation parameters). Results are expressed as average estimated metabolic concentrations ± standard error of the mean across subjects. Unpaired t-tests were performed to investigate differences between metabolic concentrations in the two anatomical regions.
RESULTS:
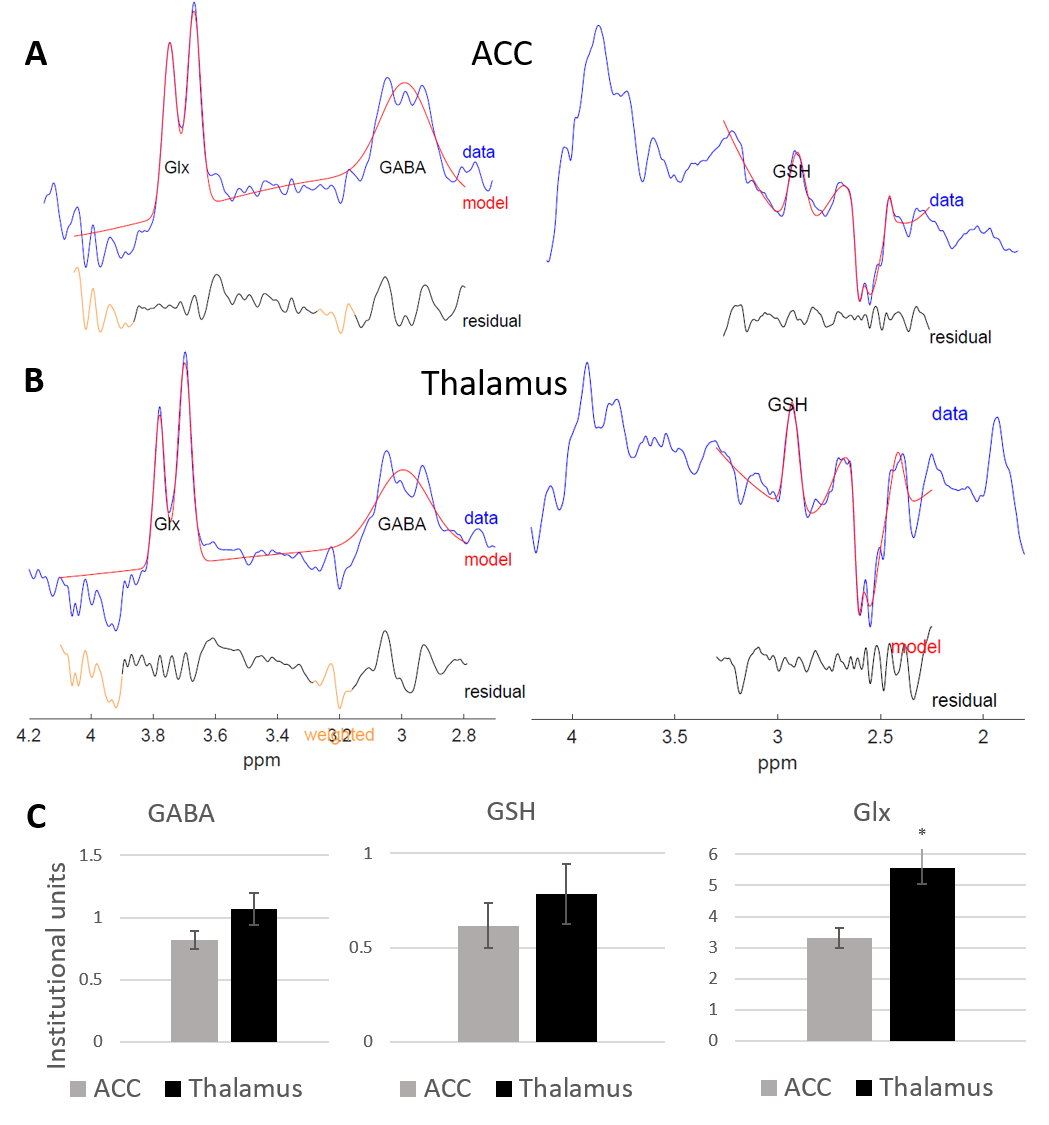
Figure 2 shows representative HERMES spectra, and the average GABA, Glx and GSH concentrations across all subjects. Average fit error estimates were all below 20% and Glx values were significantly higher in the thalamus than in the ACC (p<0.01, Table 1).Figure 3 shows representative PRESS spectra, and average estimated metabolic levels. tNAA, NAA, tCr and Glx levels were all significantly higher in the thalamus than in the ACC.
DISCUSSION:
We have performed the first HERMES MRS study in a cohort of healthy human neonates, at 3T. Many metabolites studied were found to have higher levels in the thalamus than in the ACC; this is consistent with the thalamus high level of metabolic activity in the neonatal period, as it has a key role in establishing neural circuits and network connectivity11. For this reason, although total creatine is often used as reference to express MRS results (metabolite ratios to tCr), regional differences of all metabolites were quantified with respect to the unsuppressed water reference.CONCLUSION:
Our results show robust GABA, Glx and GSH estimates in the healthy neonatal brain and furthermore, that HERMES can be used to measure significant regional differences (in this case between the thalamus and anterior cingulate cortex). Further application of this method to study how these levels and balance are altered by early-life brain injury or genetic risk can provide important new knowledge about the pathophysiology underlying neurodevelopmental disorders.Acknowledgements
This work was supported by a Project Grant from Action Medical Research [GN2728]; T.A. by a MRC Clinician Scientist Fellowship [MR/P008712/1]; and the Wellcome EPSRC Centre for Medical Engineering at Kings College London (WT 203148/Z/16/Z) and by the National Institute for Health Research (NIHR) Biomedical Research Centre based at Guy’s and St Thomas’ NHS Foundation Trust and King’s College London. The views expressed are those of the authors and not necessarily those of the NHS, the NIHR or the Department of Health.References
1. McGann JC and Mandel G. Neuronal activity induces glutathione metabolism gene expression in astrocytes. Glia, 2018; 66(9):2024-2039
2. Blankenship AG and Feller MB. Mechanisms underlying spontaneous patterned activity in developing neural circuits. Nat Rev Neurosci, 2010;11(1):18-29.
3. Canitano R and Pallagrosi M. Autism Spectrum Disorders and Schizophrenia Spectrum Disorders: Excitation/Inhibition Imbalance and Developmental Trajectories. Front Psychiatry, 2017;8:69.
4. Saleh MG, Oeltzschner G, Chan KL et al. Simultaneous Edited MRS of GABA and Glutathione. Neuroimage, 2016; 142: 576-582.
5. Tomiyasu M, Aida N, Shibasaki J et al. In vivo estimation of gamma-aminobutyric acid levels in the neonatal brain. NMR Biomed, 2017;30(1):e3666.
6. Kwon SH, Scheinost D, Lacadie C et al. GABA, resting-state connectivity and the developing brain. Neonatology, 2014;106(2):149-55.
7. Tanifuji, S, Akasaka, M, Kamei, A et al. Temporal brain metabolite changes in preterm infants with normal development. Brain Dev, 2017;39(3):196-202.
8. Mescher M, Merkle H, Kirsch J et al. Simultaneous in vivo spectral editing and water suppression. NMR Biomed, 1998;11(6):266-72.
9. Edden RAE, Puts NAJ, Harris AD et al. Gannet: A Batch-Processing Tool for the Quantitative Analysis of Gamma-Aminobutyric Acid–Edited MR Spectroscopy Spectra. J Magn Reson Imaging, 2014;40(6):1445-52
10. Wilson M, Reynolds G, Kauppinen RA et al. A constrained least-squares approach to the automated quantitation of in vivo 1H magnetic resonance spectroscopy data. MRM. 2011; 65(1):1-12
11. Kostović I, Sedmak G and Judaš M. Neural histology and neurogenesis of the human fetal and infant brain. Neuroimage. 2019;188:743-773
Figures