0099
Highlighting tract-specific microstructural abnormalities in single subjects using autoencoders1CUBRIC, Cardiff University, Cardiff, United Kingdom, 2MRC Centre for Neuropsychiatric Genetics and Genomics, Cardiff University, Cardiff, United Kingdom
Synopsis
Most clinical diffusion MRI studies rely on the statistical comparison of a group of patients against a group of healthy controls to make inference about disease. This stymies the potential power of microstructural MRI in the clinic, i.e., to identify microstructural abnormalities in a single patient. We present a framework to address this problem on a case-by-case basis, extending the reach of microstructural imaging to rare cases, where group comparisons are otherwise impossible. Our framework operates on the manifold of white matter pathways and uses autoencoders to learn normative microstructural features, and discriminate patients from controls in a paediatric population.
Introduction
Machine learning holds great promise for classifying patients using diffusion MRI within a voxel or tract-based framework1-7. However, datasets can frequently be imbalanced (e.g., contain less samples from extremely rare cases), making group comparisons less robust. Deep autoencoders (AE) offer a great opportunity to overcome these problems in the context of anomaly detection (often referred to as one-class classification). In this work, we investigate individual differences in children with copy number variants (CNVs) at high genetic risk of neurodevelopmental and psychiatric disorders8, which are relatively rare and challenging to recruit for imaging9. We propose the following anomaly detection framework: First, we learn a normative set of features derived from tract profiles obtained from typically developing (TD) young people. Second, we apply the framework to unseen tract-profiles, to determine whether these deviate from TD children (based on the hypothesis that deviations will stand out from the normal distribution10).Methods
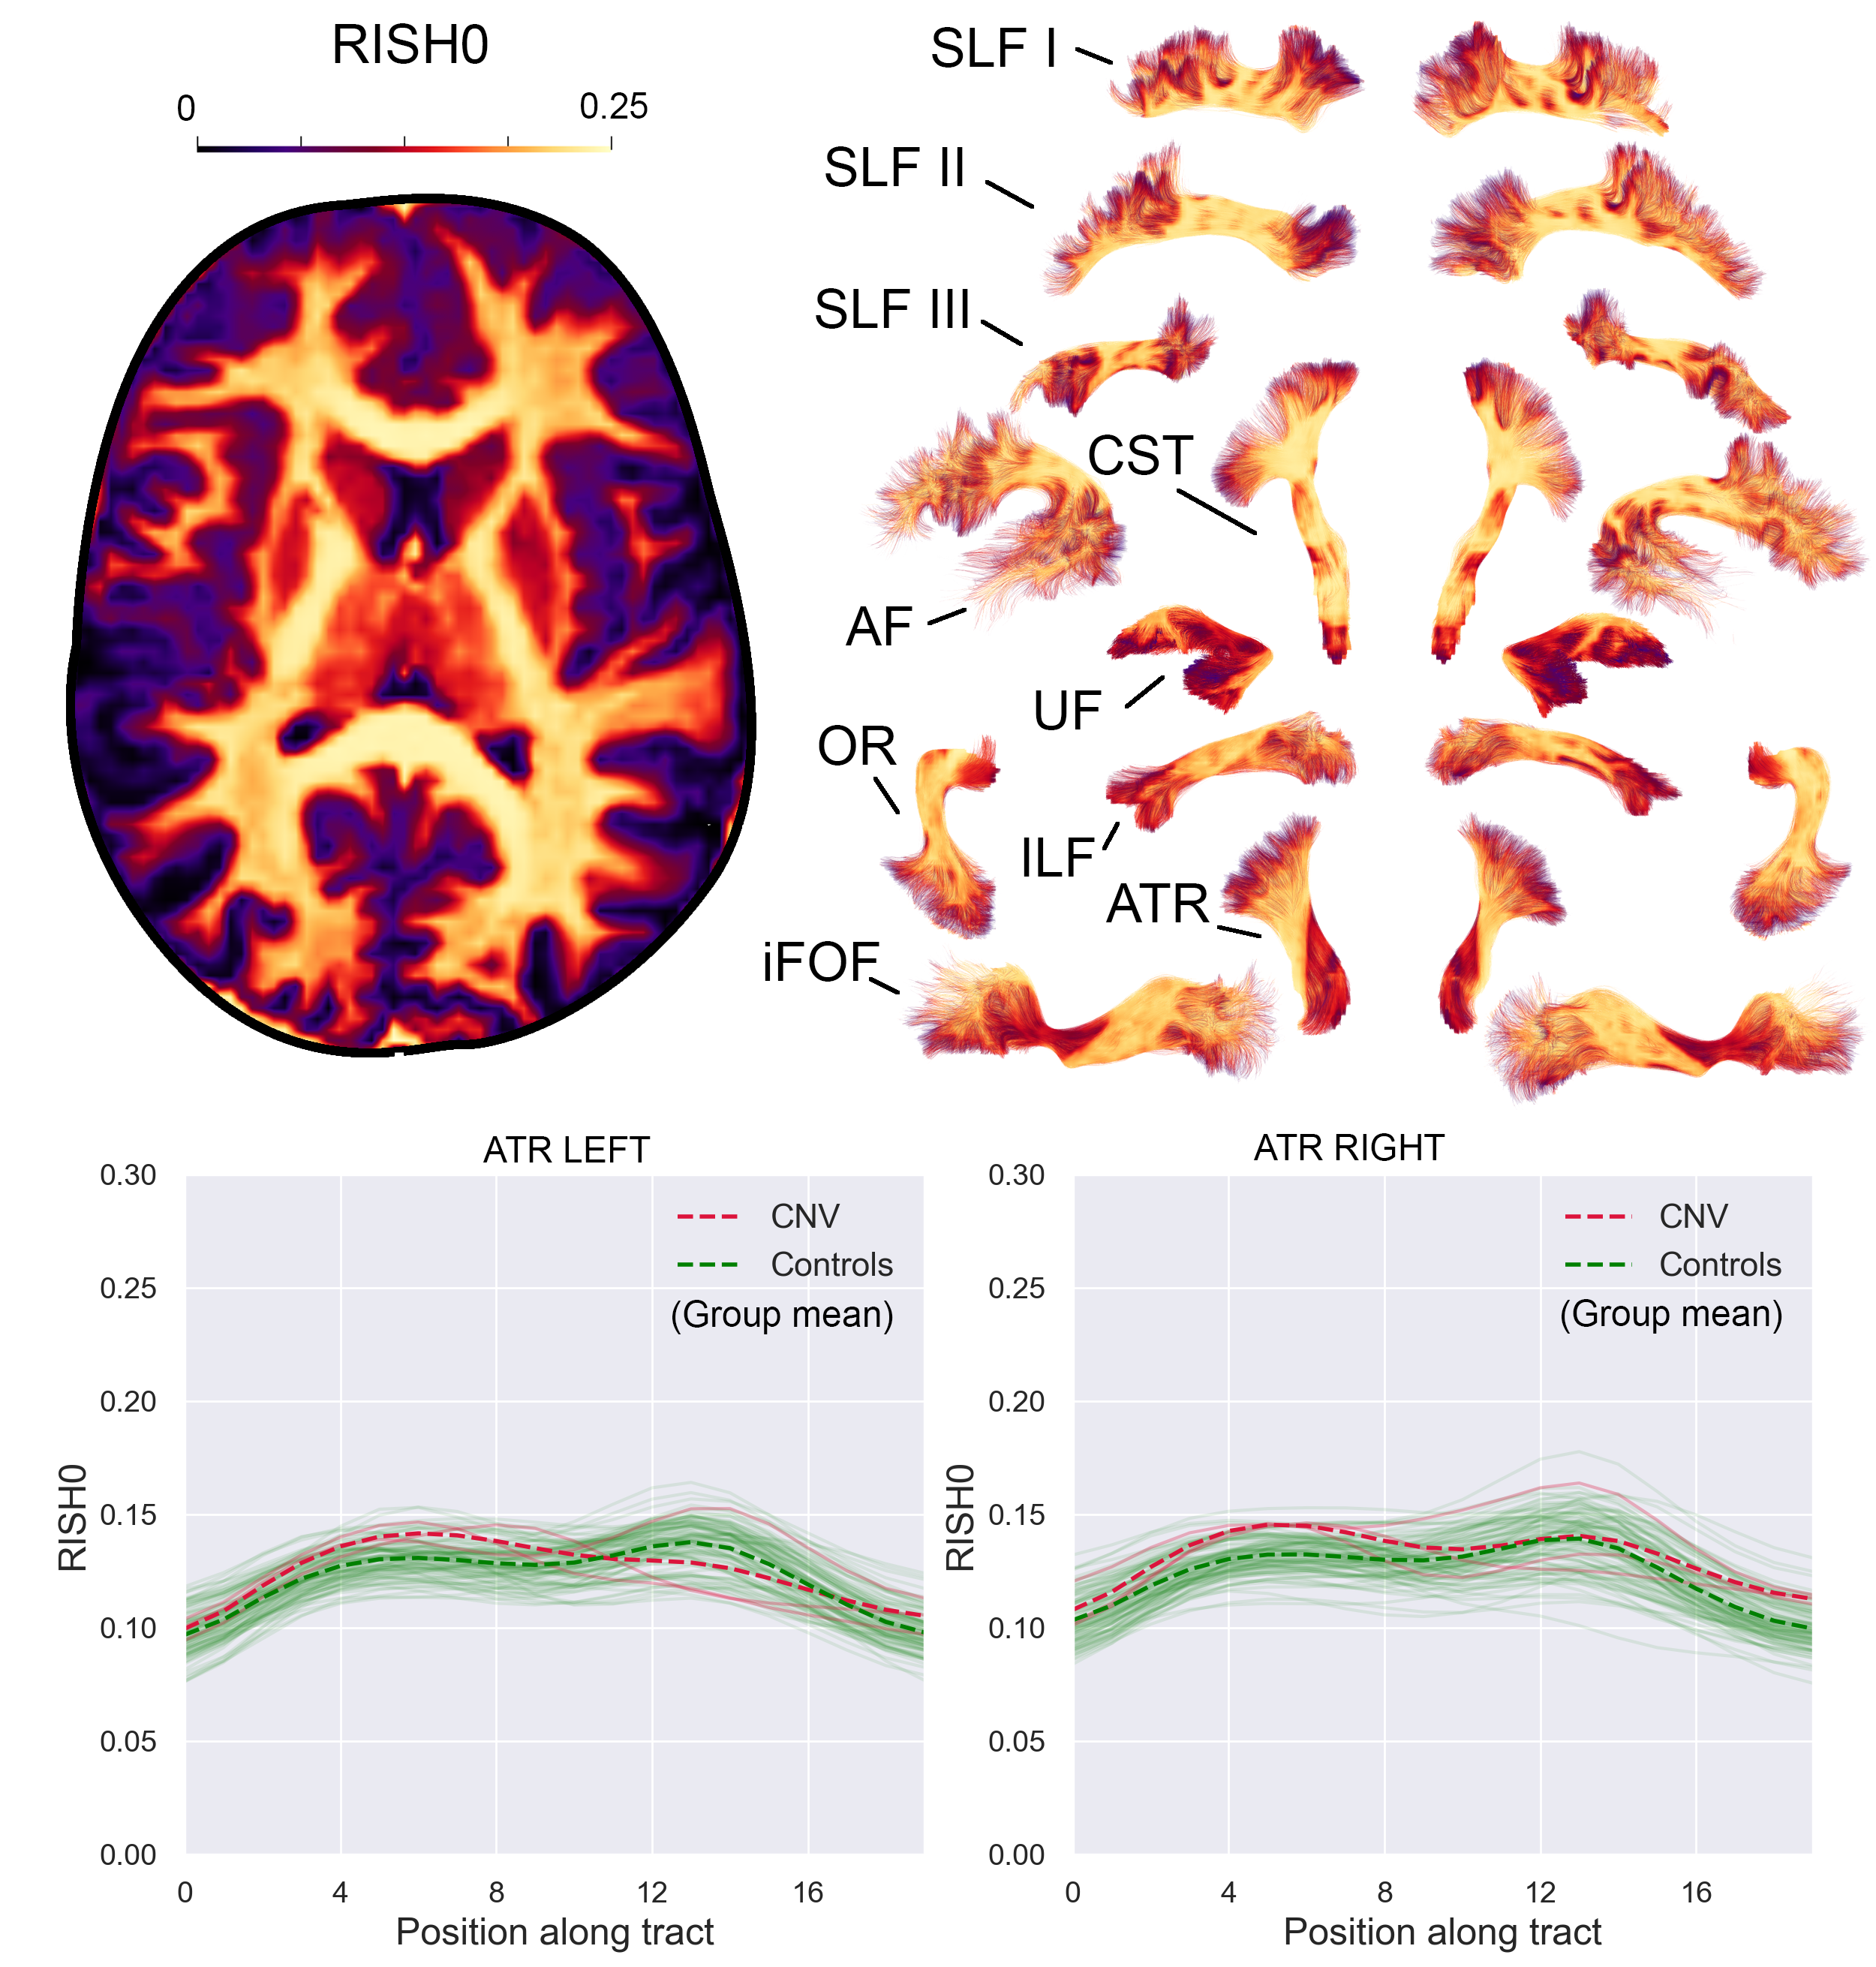
Data Acquisition & Preprocessing: Data from 90 TD (age 8-18) and 3 children with a CNV (age 13-15) were acquired on a Siemens 3T Connectom system with ultra-strong gradients (300mT/m) with 14 b0 images, 30 directions at b = 500, 1200 s/mm², 60 directions at b = 2400, 4000, 6000 s/mm² and 2×2×2 mm³ voxels (TE/TR: 59/3000 ms). Data were denoised11, corrected for signal drift12, motion13, distortion14, gradient non-linearities15 and Gibbs ringing16. Rotationally-invariant spherical harmonic (RISH)17 features (order = 0) were derived for each subject. Automated white matter tract segmentation was performed using TractSeg18 to obtain 20 bundles of interest (Fig. 1). For each bundle, along-tract profiling19 was performed sampling at 20 locations (Fig. 1) and the resulting 20 tract-profiles were concatenated to form a feature vector (n = 20 tracts × 20 locations = 400 features) for each subject. The complete data workflow pipeline is described in Fig 2.Network architecture: AEs are a type of neural network trained to reproduce and reconstruct data by learning a compressed representation of their input. In comparison to principal component analysis (PCA), AEs confer the added value of allowing non-linear transformations. Our AE implementation consists of 5 fully connected layers (400×128×64×128×400 units) with tanh activation between the layers. 10% of the data was held out for testing during the training phase (epochs: 100, learning rate: 1.5e-3, optimiser: Adam, loss: mean squared error).
Results
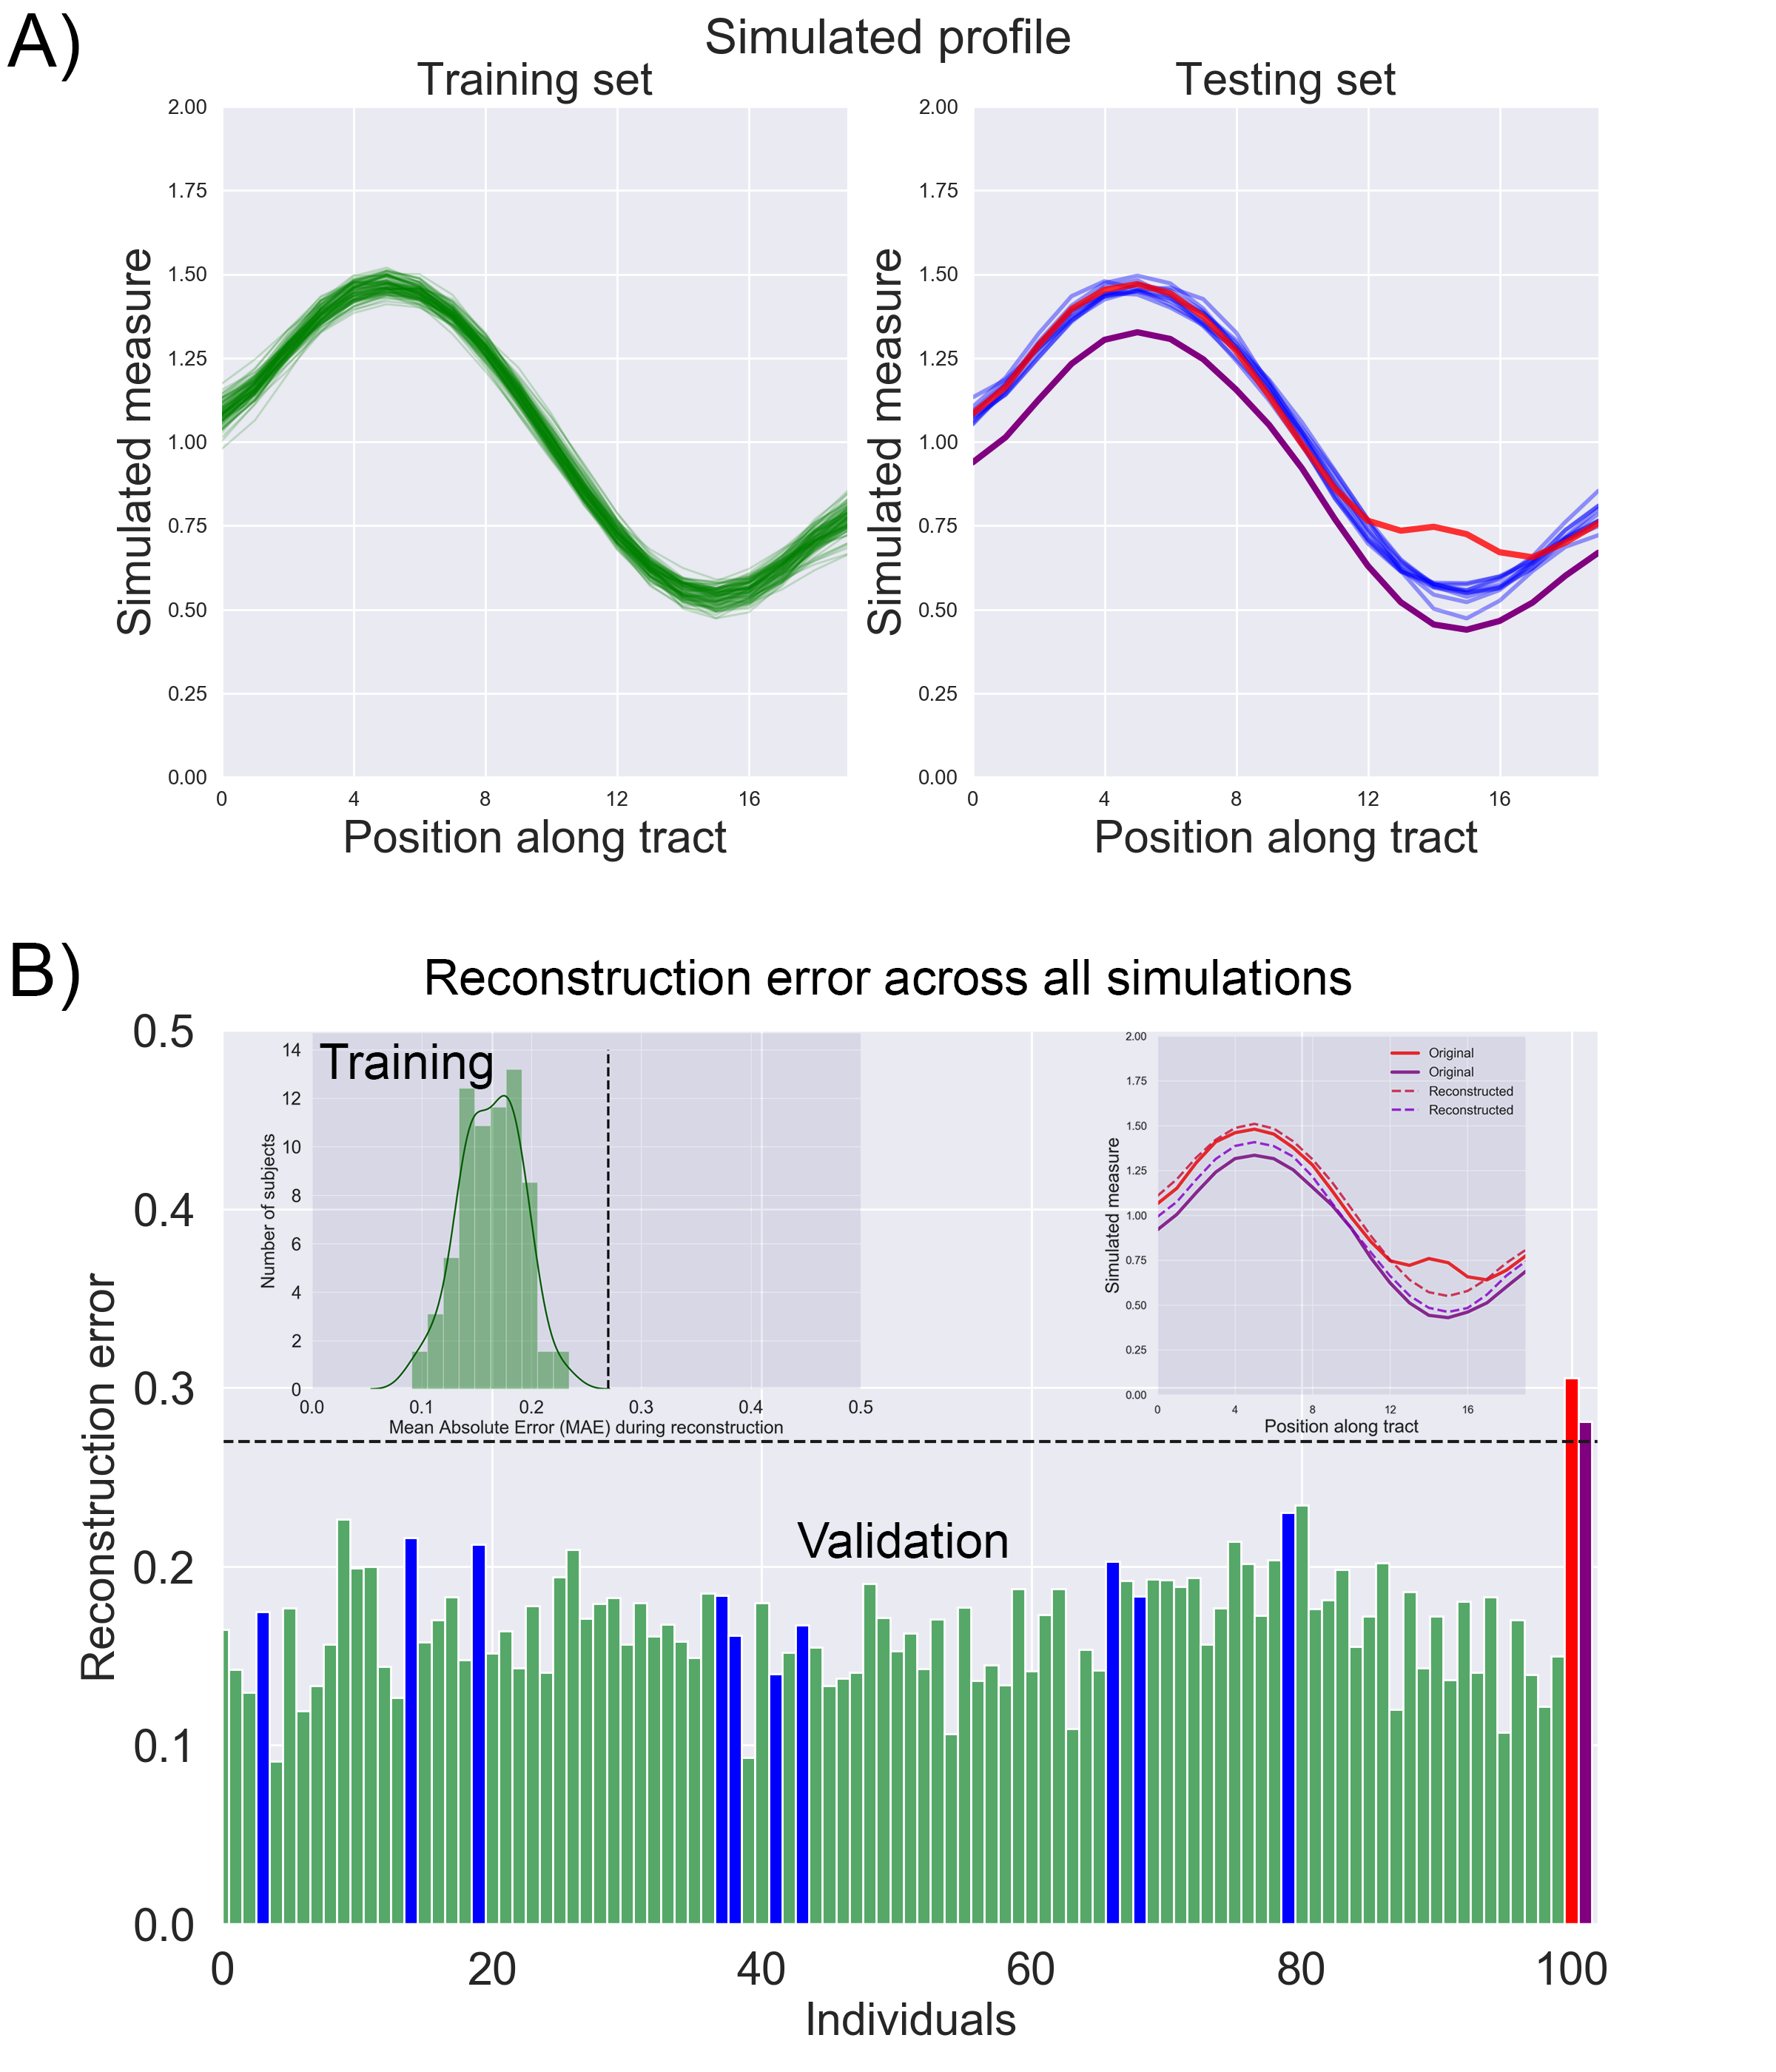
Simulations: To provide an entry-level understanding of the framework, we simulated 100 TD and 2 high-risk tract profiles (Fig. 3, top panel). Using the training set, a 0.27 mean absolute error (MAE) outlier threshold was fixed based on the inspection of the error probability density function (bottom panel). Both simulated high-risk profiles were correctly identified as outliers as they exceeded the normal MAE threshold.In vivo data: Fig. 4 shows the reconstruction error on real data. Reconstruction anomalies were identified in 2 of the 3 CNV subjects based on the MAE. Identifying subjects as outliers is compelling, but interpretation is also required. Therefore, we compared the reconstructed profiles along each tract for a representative TD and individual with a CNV. Fig. 5 shows deviations in the reconstructed profiles across multiple white matter tracts for the CNV carrier (MAE: 0.19), where the error is lower in the TD subject (MAE: 0.11). For comparison, the framework also outperformed traditional outlier detection (PCA + Mahalanobis distance, not reported due to space constraints) mostly due to its ability to handle high-dimensional data non-linearly.
Discussion
The presented framework of deep AEs for anomaly detection enabled tract-specific characterisation of white matter microstructure in a subject-specific manner. In the context of our model, trained using healthy paediatric data, our findings revealed that clinical cases (CNVs) were successfully classified as outliers, compared with unseen healthy controls. This extends the possibility of using anomaly detection in extremely rare cases (as little as n = 1), where group comparisons are otherwise impossible. Hyper-parameter tuning remains to be explored to assess the generalizability of the framework and its application to other pathology.Conclusion
Our novel anomaly detection framework paves the way to progress from the traditional paradigm group-based comparison of patients against controls, to a personalised medicine approach, and take microstructural imaging from the bench to the bedside.Acknowledgements
No acknowledgement found.References
1. O’Donnell, Lauren J., and Thomas Schultz. "Statistical and machine learning methods for neuroimaging: examples, challenges, and extensions to diffusion imaging data." Visualization and Processing of Higher Order Descriptors for Multi-Valued Data. Springer, Cham, 2015. 299-319.
2. Zhang, Fan, et al. "Whole brain white matter connectivity analysis using machine learning: an application to autism." Neuroimage 172 (2018): 826-837.
3. Ravi, Daniele, et al. "Current Applications and Future Promises of Machine Learning in Diffusion MRI." International Conference on Medical Image Computing and Computer-Assisted Intervention. Springer, Cham, 2018.
4. Bloy, Luke, et al. "HARDI based pattern classifiers for the identification of white matter pathologies." International Conference on Medical Image Computing and Computer-Assisted Intervention. Springer, Berlin, Heidelberg, 2011.
5. Yeatman, Jason D., et al. "A browser-based tool for visualization and analysis of diffusion MRI data." Nature communications 9.1 (2018): 940.
6. Sarica, Alessia, et al. "The corticospinal tract profile in amyotrophic lateral sclerosis." Human brain mapping 38.2 (2017): 727-739.
7. Dou, Xuejiao, et al. "Characterizing White Matter Connectivity in Alzheimer's Disease and Mild Cognitive Impairment: Automated Fiber Quantification Analysis with Two Independent Datasets." SSRN (2019).
8. Chawner, Samuel JRA, et al. "Genotype–phenotype associations in children with copy number variants associated with high neuropsychiatric risk in the UK (IMAGINE-ID): a case-control cohort study." The Lancet Psychiatry 6.6 (2019): 493-505.
9. Villalón-Reina, Julio E., et al. "Altered white matter microstructure in 22q11. 2 deletion syndrome: a multisite diffusion tensor imaging study." Molecular psychiatry (2019): 1-14.
10. Sakurada, Mayu, and Takehisa Yairi. "Anomaly detection using autoencoders with nonlinear dimensionality reduction." Proceedings of the MLSDA 2014 2nd Workshop on Machine Learning for Sensory Data Analysis. ACM, 2014.
11. Veraart, Jelle, et al. "Denoising of diffusion MRI using random matrix theory." NeuroImage 142 (2016): 394-406.
12. Vos, Sjoerd B., et al. "The importance of correcting for signal drift in diffusion MRI." Magnetic resonance in medicine 77.1 (2017): 285-299.
13. Andersson, Jesper LR, and Stamatios N. Sotiropoulos. "An integrated approach to correction for off-resonance effects and subject movement in diffusion MR imaging." Neuroimage 125 (2016): 1063-1078.
14. Andersson, Jesper LR, et al. "How to correct susceptibility distortions in spin-echo echo-planar images: application to diffusion tensor imaging." Neuroimage 20.2 (2003): 870-888.
15. Glasser, Matthew F., et al. "The minimal preprocessing pipelines for the Human Connectome Project." Neuroimage 80 (2013): 105-124.
16. Kellner, Elias, et al. "Gibbs‐ringing artifact removal based on local subvoxel‐shifts." Magnetic resonance in medicine 76.5 (2016): 1574-1581.
17. Mirzaalian, Hengameh, et al. "Inter-site and inter-scanner diffusion MRI data harmonization." NeuroImage 135 (2016): 311-323.
18. Wasserthal, Jakob, et al. "Tractseg-fast and accurate white matter tract segmentation." NeuroImage 183 (2018): 239-253.
19. Cousineau, Martin, et al. "A test-retest study on Parkinson's PPMI dataset yields statistically significant white matter fascicles." NeuroImage: Clinical 16 (2017): 222-233.
Figures