0097
Neurometabolism in children with chronic liver disease or portosystemic shunting: a 1H-MRS/MRI study at 7T1Centre d'Imagerie Biomedicale, Ecole Polytechnique Federale de Lausanne, Lausanne, Switzerland, 2Advanced Clinical Imaging Technology, Siemens Healthcare AG, Lausanne, Switzerland, 3Department of Radiology, Lausanne University Hospital and University of Lausanne, Lausanne, Switzerland, 4LTS5, École Polytechnique Fédérale de Lausanne, Lausanne, Switzerland, 5Swiss Pediatric Liver Center, Department of Pediatrics, Gynecology and Obstetrics, University Hospitals Geneva, and University of Geneva Medical School, Geneva, Switzerland, 6Pediatric Neurology Unit, Department of Pediatrics, Gynecology and Obstetrics, University Hospitals Geneva, and University of Geneva Medical School, Geneva, Switzerland
Synopsis
Children with chronic liver disease (CLD) or congenital portosystemic shunts (CPSS) show neurocognitive deficits that are not entirely reversible following liver transplantation or shunt closure. We measured for the first time the neurometabolic profile, brain volumetry and T1 relaxation times of children with CLD and CPSS at 7T. In patients with compensated CLD, there were no significant neurometabolic alterations as assessed by 1H-MRS, while small changes in amygdala and hippocampus volumes were measured. In CPSS, however, neurometabolic changes were pronounced, together with a marked decrease in all measured brain volumes, and likely related to measurably impaired neurocognitive functioning.
Background
As many as 40-50% of children with chronic liver disease (CLD) or congenital portosystemic shunts (CPSS) present with neurocognitive deficits that are not entirely reversible following liver transplantation or shunt closure1, the underlying mechanisms of which are largely unknown. Understanding the molecular underpinnings by non-invasive means could inform disease management. Very few MRI studies have been performed in children with CLD, and those that were limited by low magnetic fields (1.5T)2. One study showed that 60% of children with CLD or porto-systemic shunting referred to a tertiary liver center displayed a hyperintense T1 signal in the globus pallidus compatible with chronic HE as described in adults3. The resolution of the 1H-MRS data at 1.5T was insufficient to measure separately Gln from Glu or to characterize neurometabolism in detail. Our aim was to take advantage of the increased resolution provided by the 7T scanners to measure for the first time in detail the neurometabolic profile, brain volumetry and T1 relaxation times of children with CLD and CPSS and correlate these findings with neurocognitive and biological results.Methods
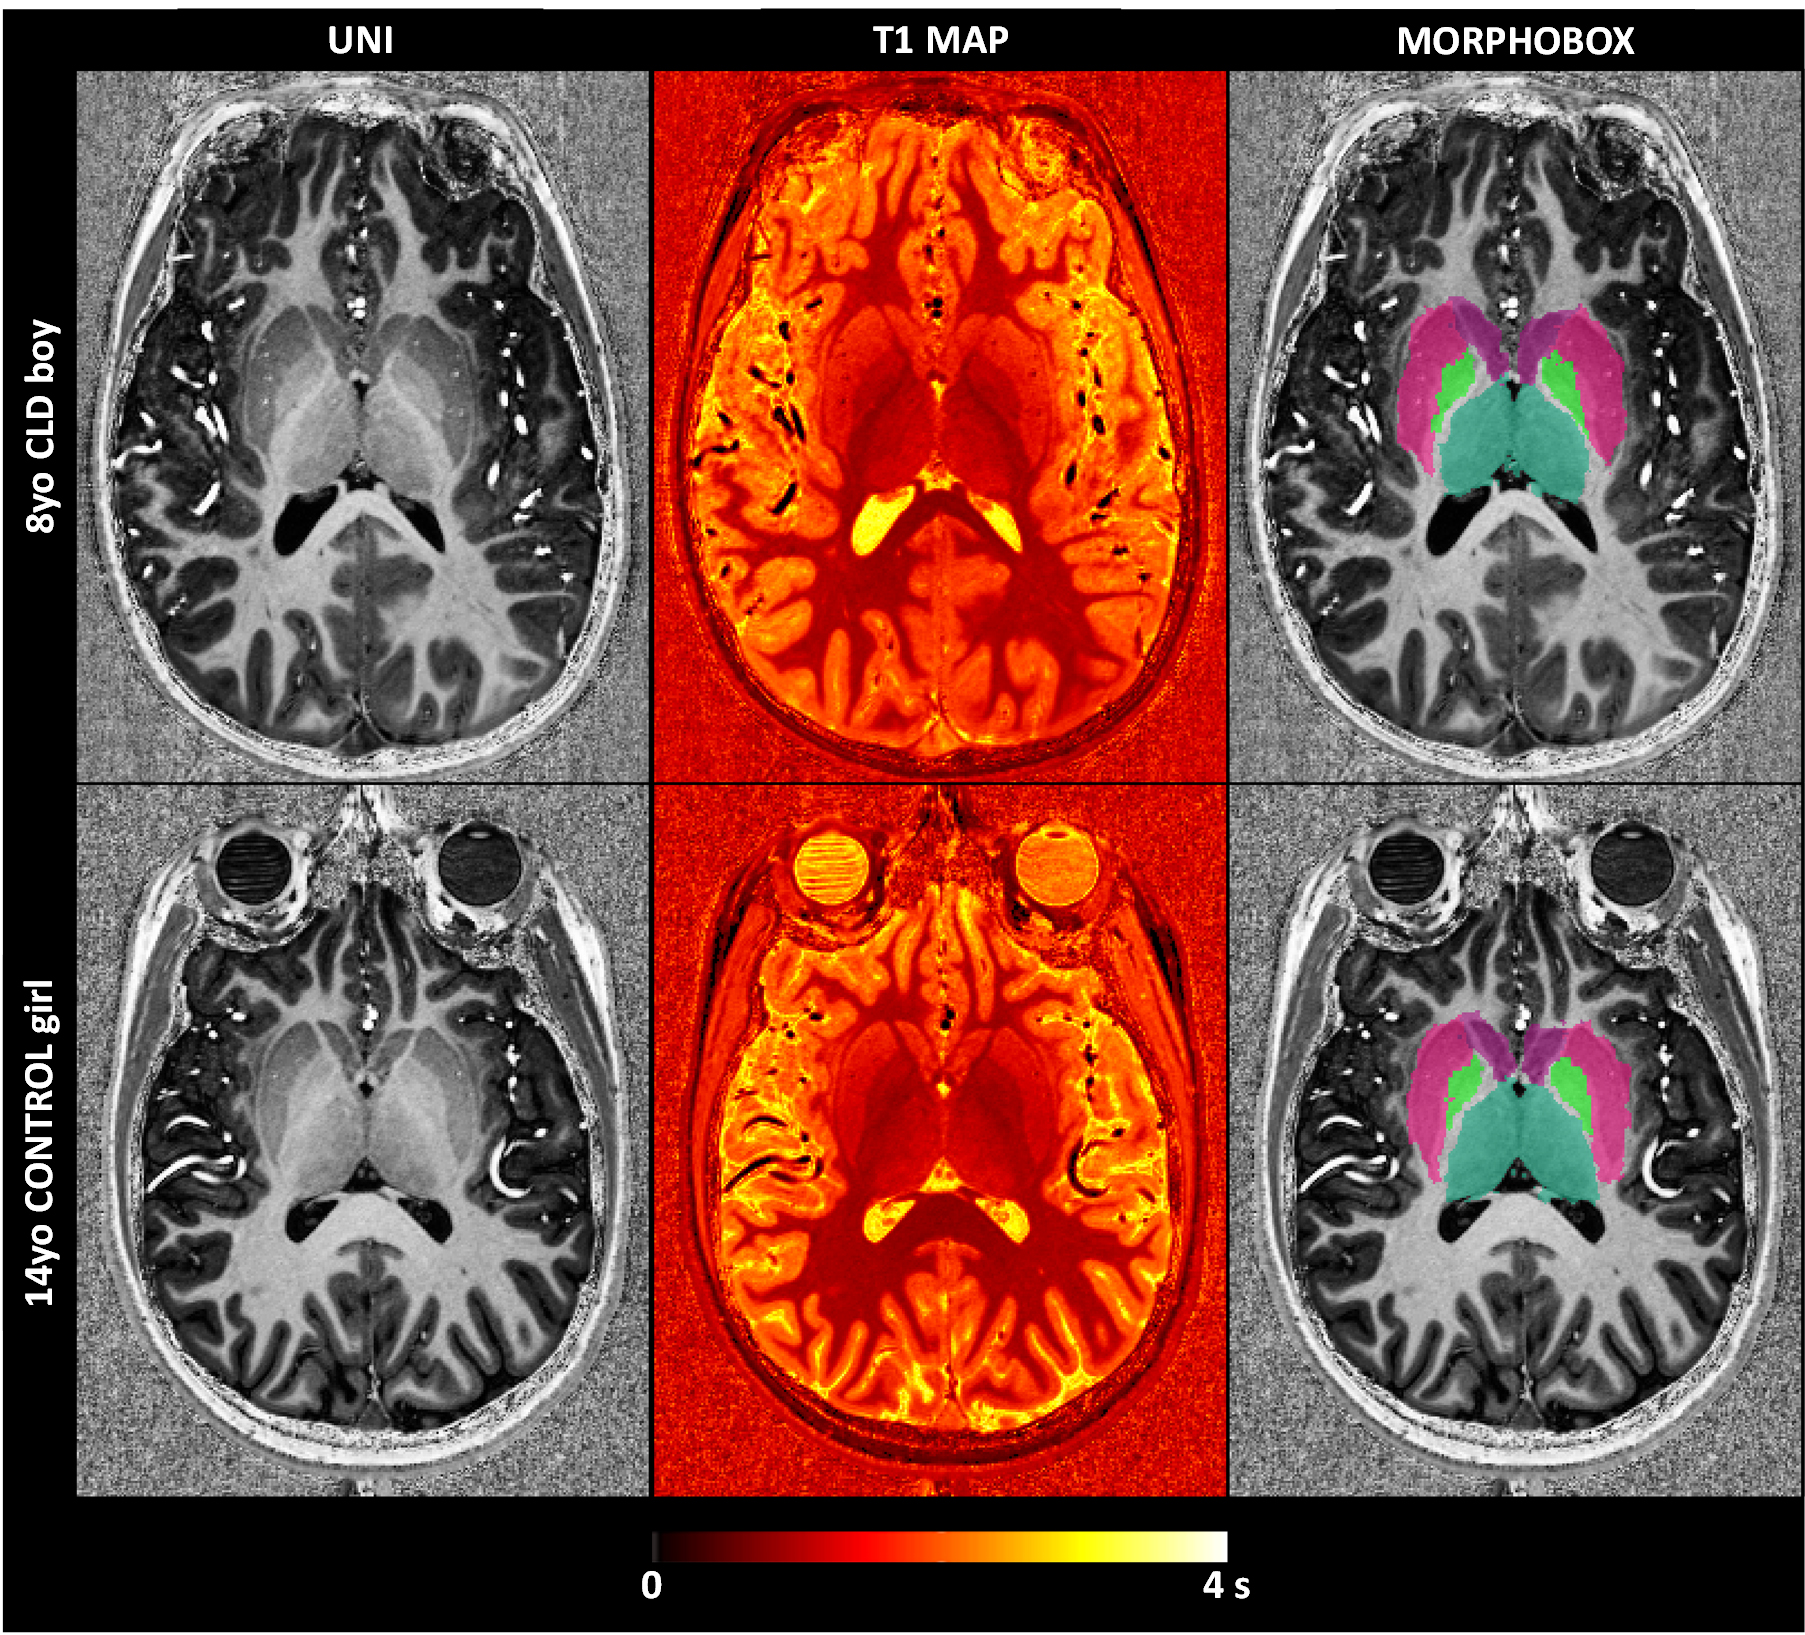
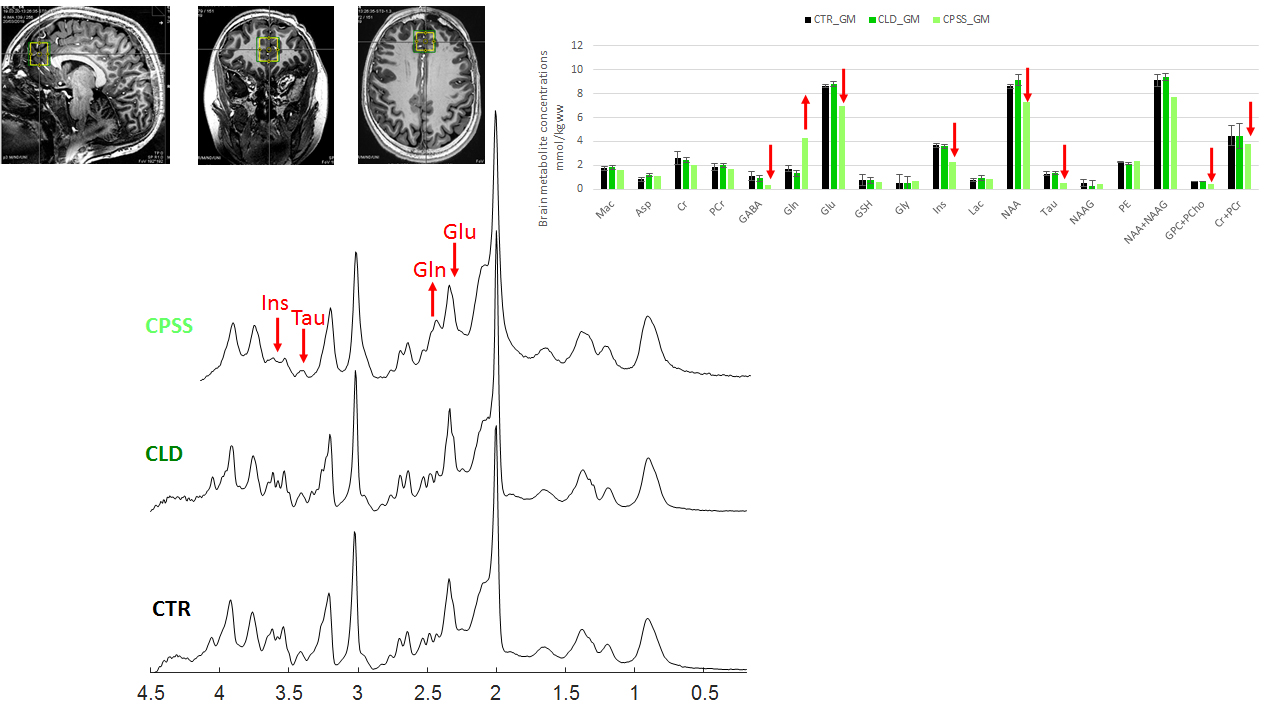
Children (8-16 years) presented with CLD or CPSS were enrolled. Exclusion criteria included antibiotic administration within 6 weeks of assessment, use of psychotropic treatment as well as the conventional MRI exclusion criteria. 1H-MRI/MRS data were acquired on an investigational 7T/68cm MRI scanner (Siemens Healthcare, Erlangen, Germany) using a single-channel quadrature transmit and 32-channel receive coil (Nova Medical Inc., MA, USA). A 3D MP2RAGE sequence4 (TR = 6 s, TE = 2.05 ms, TI1 = 0.8 s, TI2 = 2.7s, α1= 4°, α2= 5°, 0.6 × 0.6 × 0.6 mm3 resolution, 320 × 320 × 256 matrix size, TA=10min03) was used to: i) collect high resolution images for MRS voxel positioning and subsequent partial volume corrections; and ii) generate T1 maps for investigating the T1 signal hyperintensity of the globus pallidus. Since brain atrophy was recently shown in adults with CLD, automated segmentation of deep brain structures was performed using the MorphoBox prototype5-6 with an age-appropriate atlas that represents the average anatomy for the age range of 8–16 years. Absolute volume and average T1 were calculated for basal ganglia and each deep nucleus individually (caudate, putamen, thalamus, pallidum), hippocampus and amygdala. 1H-MRS was performed using the semi-adiabatic SPECIAL sequence7 at short echo-time (16ms) in gray matter (GM) dominated medial prefrontal cortex (20x20x25mm3). Metabolite quantification was performed using LCModel and water as internal reference. In addition, neurocognitive testing and routine labs were obtained within three months of each other following informed consent.Results
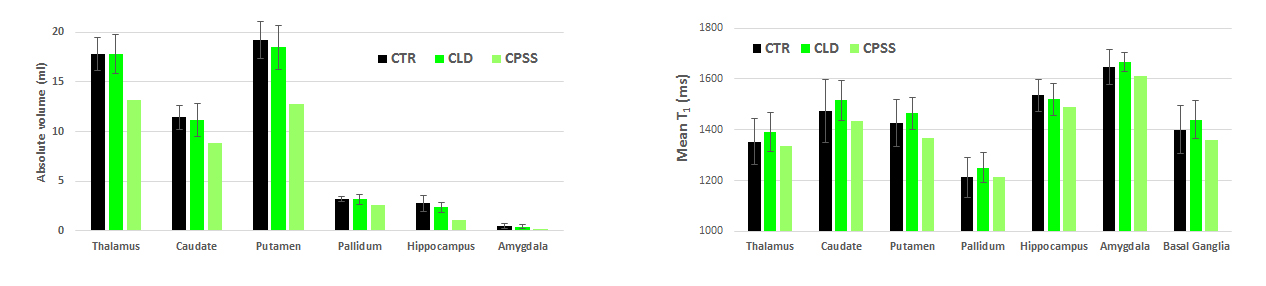
Six patients (8-14 years) including five with CLD (two girls) and one with CPSS (one girl) were enrolled, as were twenty controls (CTR, 8-16 years, ten girls). Causes of CLD: congenital disorder of glycosylation, progressive familial intrahepatic cholestasis type-2, portal obliterative venopathy, autoimmune hepatitis. Mean plasma ammonium in patients was 26umol/l, mean serum bilirubin was in normal range and mean platelet count was 201 G/L (59-346). The patients with CLD showed scores in range or above average on Total Intellectual Quotient measures (WISC-IV). One scored below average on the working memory sub-scale of the WISC-IV (<1,65SD), while the intellectual profiles were homogenous and above average for the other patients. One of thesescored below average on 6/10 parameters on the Conners Continuous Performance Test, suggesting attention deficit. The other were in range. The patient with CPSS displayed Total Intellectual Quotient below average (<1,65SD on the WISC-IV), with additional deficits (<1,65SD) in executive and attentional functioning as well as expressive and receptive language.A representative MP2RAGE image together with the T1 maps and corresponding segmentation masks is shown in Fig 1. The average estimated absolute volumes and T1s are shown in Fig 2. The overall trend was a decrease in brain volumes for CLD and CPSS patients, with a mild decrease (~-15%) in the hippocampus and amygdala for CLD and a stronger decrease for CPSS in each measured brain region (from -60% to -20%) with hippocampus and amygdala being more affected, similar to CLD kids. No changes for T1 relaxation times were measured. Fifteen metabolites were reliably quantified as shown in Fig 3 (CRBs≤25%). The patient with CPSS showed the expected increase of brain glutamine (+150%) and decrease of brain osmolytes (inositol, taurine, total choline, from -35% to -60%) together with a previously unreported decrease in the neurotransmitters glutamate (-19%), GABA (-65%) and N-acetylaspartate (-15%). No statistically significant differences were observed between the CLD patients and controls.
Conclusion
In patients with compensated CLD, there were no significant neurometabolic alterations as assessed by high resolution 1H-MRS, while small changes in amygdala and hippocampus volumes were measured. In CPSS, however, neurometabolic changes were pronounced, together with a marked decrease in all measured brain volumes, and likely related to measurably impaired neurocognitive functioning. Together, these results suggest that in CPSS (type B encephalopathy) the brain is likely exposed to a higher load of neurotoxic substances than in patients who have some degree of portal flow (type C).Acknowledgements
Supported by CIBM of the UNIL, UNIGE, HUG, CHUV, EPFL, the Leenaards and Jeantet Foundations and the SNSF project no 310030_173222/1.
The authors thank Prof. Andrea L. Gropman (Children's National
Medical Center, Washington, D.C.) for her advice.
References
1Caudle, S.E., et al., Language and motor skills are impaired in infants with biliary atresia before transplantation. J Pediatr, 2010. 156(6): p. 936-40, 940 e1.
2Hanquinet S., et al., Globus pallidus MR signal abnormalities in children with chronic liver disease and/or porto-systemic shunting.Eur Radiol. 2017 Oct;27(10):4064-4071
3Cudalbu C., et al., Brain Edema in Chronic Hepatic Encephalopathy. J Clin Exp Hepatol. 2019 May-Jun;9(3):362-382.
4Marques, J.P., et al., MP2RAGE, a self bias-field corrected sequence for improved segmentation and T1-mapping at high field. Neuroimage, 2010. 49(2): p. 1271-81.
5Schmitter, D, Roche A, et al An evaluation of volume-based morphometry for prediction of mild cognitive impairment and Alzheimer's disease. NeuroImage: Clinical 2015;7:7-17
6Boto J, Gkinis G, Roche A, Kober T, Maréchal B, Ortiz N, Lövblad K-O, Lazeyras F, Vargas MI. Evaluating anorexia-related brain atrophy using MP2RAGE-based morphometry. European Radiology (2017);27:5064
7Xin, L., et al., Proton T1 relaxation times of metabolites in human occipital white and gray matter at 7 T. Magn Reson Med, 2013. 69(4): p. 931-6.
Figures