0093
Myelin water fraction (MWF) mapping using Magnetic Resonance Fingerprinting (MRF) in a cohort of patients from a child neurology unit1Imago7, Pisa, Italy, 2INFN, Pisa, Italy, 3University of Pisa, Pisa, Italy, 4IRCCS Stella Maris, Pisa, Italy, 5Neuroradiology, Azienda Ospedaliero-Universitaria Pisana, Pisa, Italy
Synopsis
New advancements in magnetic resonance fingerprinting (MRF) allow more accurate quantification of tissue characteristics and its components using multi-component dictionaries. Recently, a multi-component method for mapping Myelin-Water fraction (MWF) was suggested and validated in healthy children. Here, we studied a cohort with different disorders including hypo- or de- myelinization, Creatine Deficiency Syndrome and brain malformations. We reconstruct MWF maps using tailored dictionaries and estimate fractional myelin values in the splenium of corpus callosum. We observed that myelinization plateaus at around 30 months from birth, while in patients with white matter disorders the process is distorted.
Introduction
MR examinations during childhood provide valuable insights in the neurodevelopment and potentially detect brain malformations or abnormal development of white matter (WM). Myelin fraction estimation can be performed by multicomponent relaxation (MCR) analysis of the MR signal. This analysis is used to separate different component on the basis of their relaxation times. Three main pools are commonly used: a fast decaying component, corresponding to water trapped within the myelin layers (Myelin Water, MW), a slow decaying component, corresponding to free water (FW) such as CSF, and an intermediate component corresponding to Intracellular/Extracellular water (IEW). This technique has been used with steady/state acquisitions to quantify myelin fraction in infant brains1. Recently, the same principles have been used to extract myelin fraction maps from SSFP MR Fingerprinting (MRF) measurements2, combining the specificity of myelin fraction mapping with the robustness to motion and to system imperfection and the short acquisition time of MRF. Here, we studied a cohort of 38 patients referred to our child neurology unit.Methods
Dictionary creation: We used a three-component signal model, similarly to Chen et al.2. We assumed each voxel to be a combination of a myelin water (MW) pool, an intra-extracellular water pool (IEW) and a free water pool (FW). We wrote the dictionary as a weighted linear combination:D = wMWDMW + wIEWDIEW+wFWDFW
where wMW + wIEW + wFW = 1
Each pool was represented by a single signal evolution with fixed T1 and T2. These values were empirically set to T1/T2 = 300ms/10ms for MW, 800ms/110ms for IEW and 4000ms/1500ms for FW, based on the literature2. Step size for the fractions was 0.01 (totalling of 14493 elements in the combined dictionary). In addition, a standard single-compartment dictionary (T1 from 0 to 3500ms, step size 5ms; T2 from 0 to 1500ms, step size 5ms) was calculated.
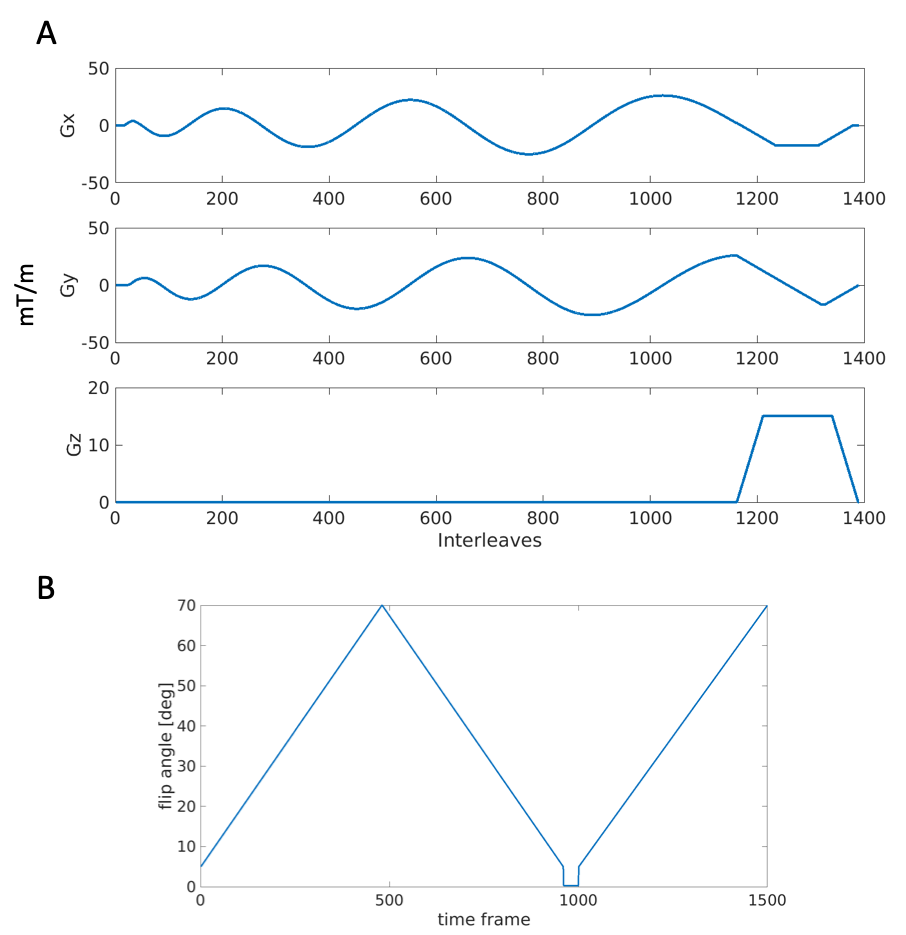
Data acquisition: We acquired data in 38 children aged from 2 months to 11 years old. Amongst all subjects, 23 did not present visible alterations of WM (noalt), 7 subjects presented hypo or demyelinization (hypo), 3 suffered from creatine deficiency syndrome (creatin) and 5 presented brain malformations (malf). All the data were obtained using SSFP MRF3 on a GE HDxt 1.5T with 8-channels receiver. Sequence diagram and flip angle schedule is shown in Figure 1, TE/TR were fixed (1.8/10ms). FOV was 225mm and matrix 192x192. The acquisition time was 15s per each 5mm-thick slice and covered the whole brain.
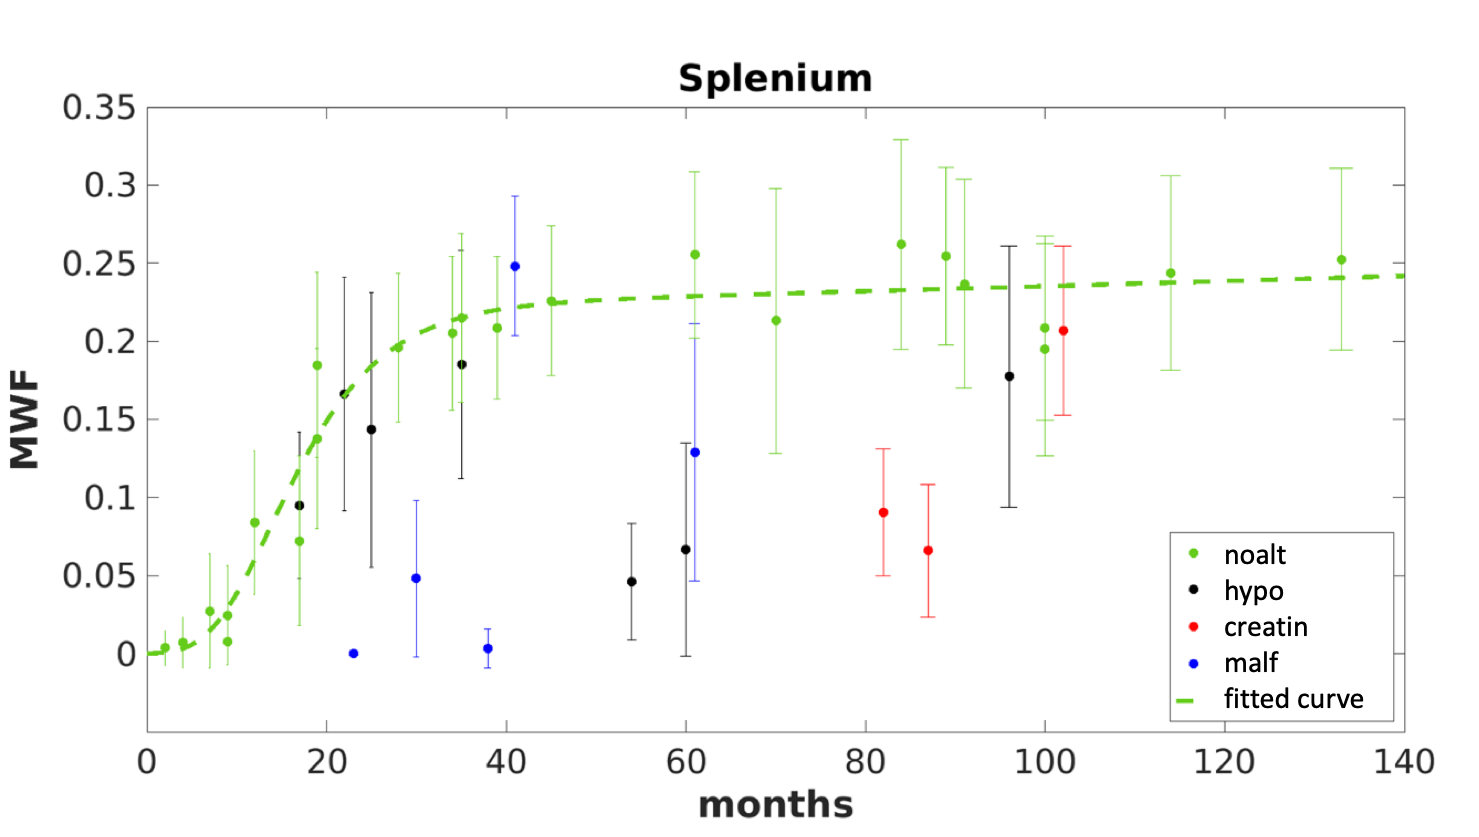
Data and analysis: After obtaining the quantitative maps a single ROI delineating the splenium of corpus callosum was manually drawn as shown in Figure 3. Myelin fractions were calculated within the ROI and the results were reported as a function of the patient age. This curve was fitted using a modified Gompertz function:
MWF(age) = a · exp(b·age - exp(c-d·age))
where b, d represent two different grow rates, a represents the transition between the two different rates and c represent an initial delay time before the start of the development.
Results
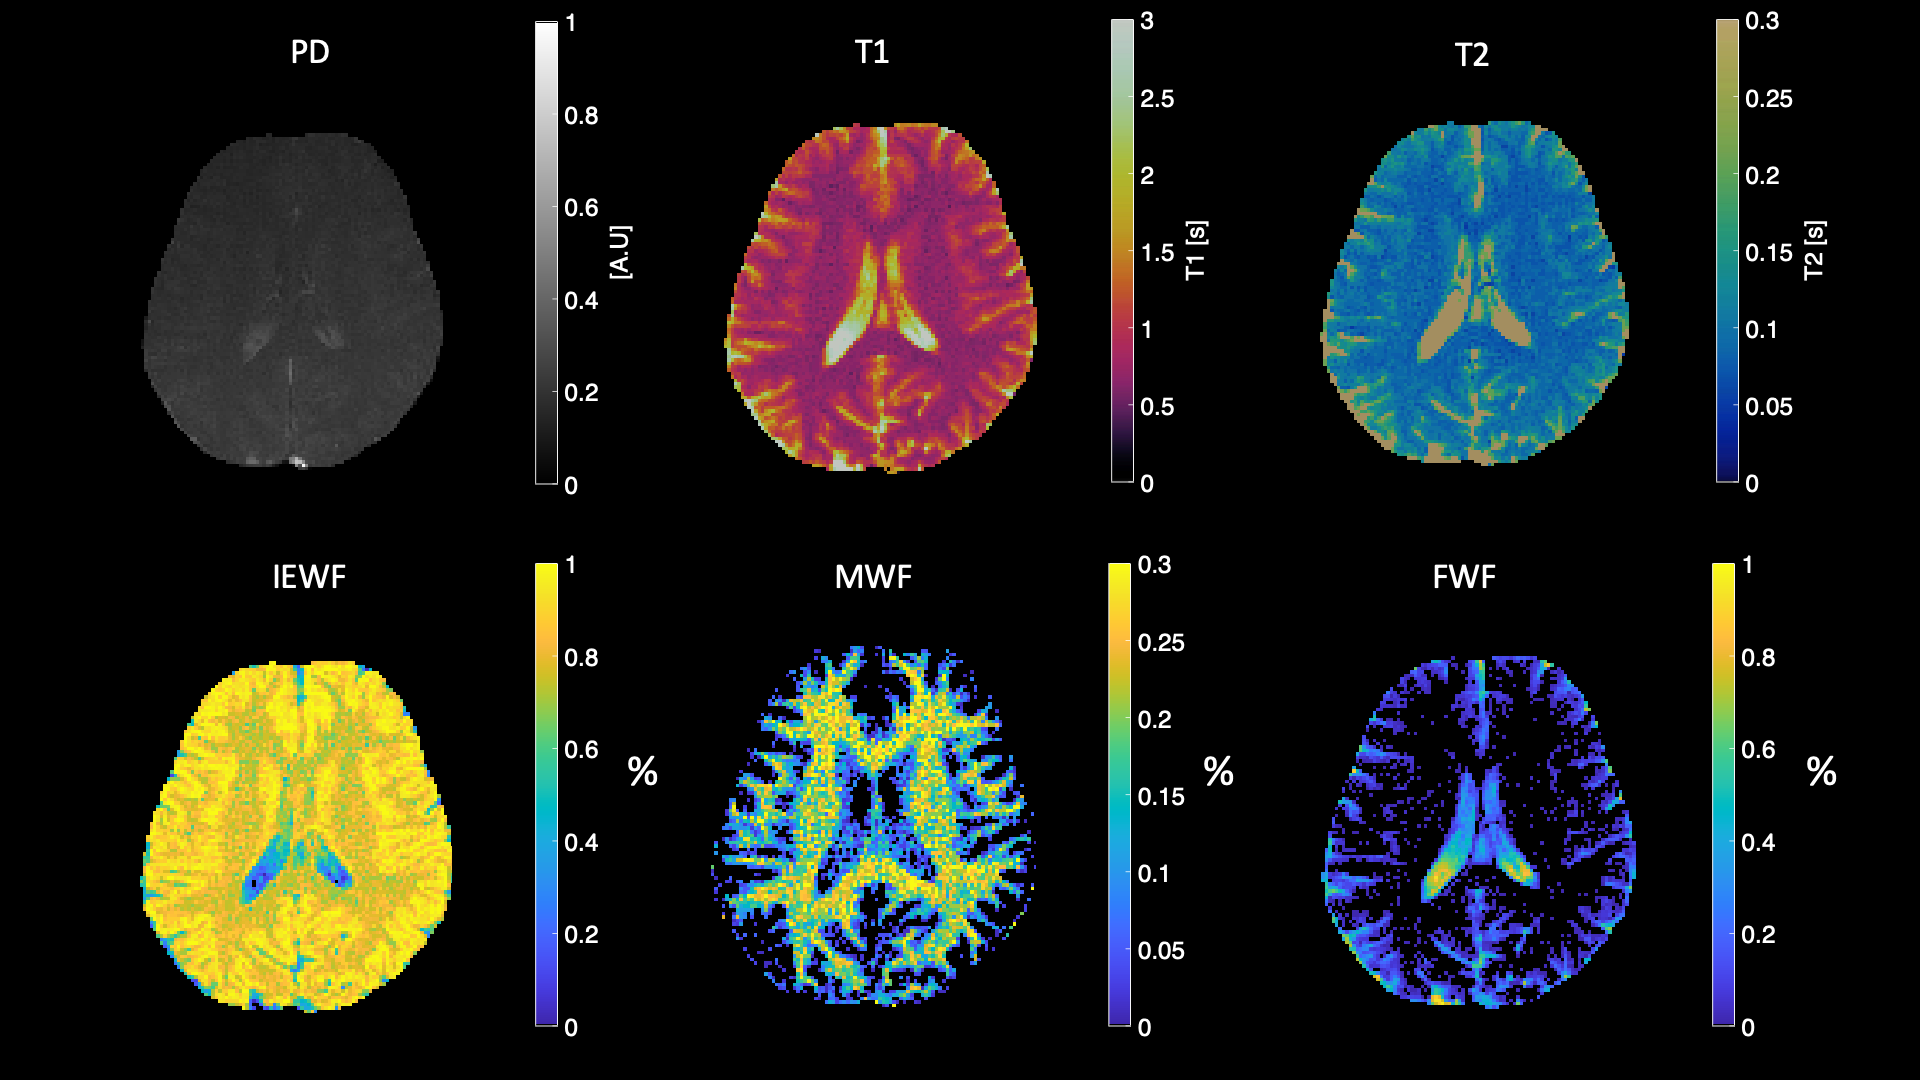
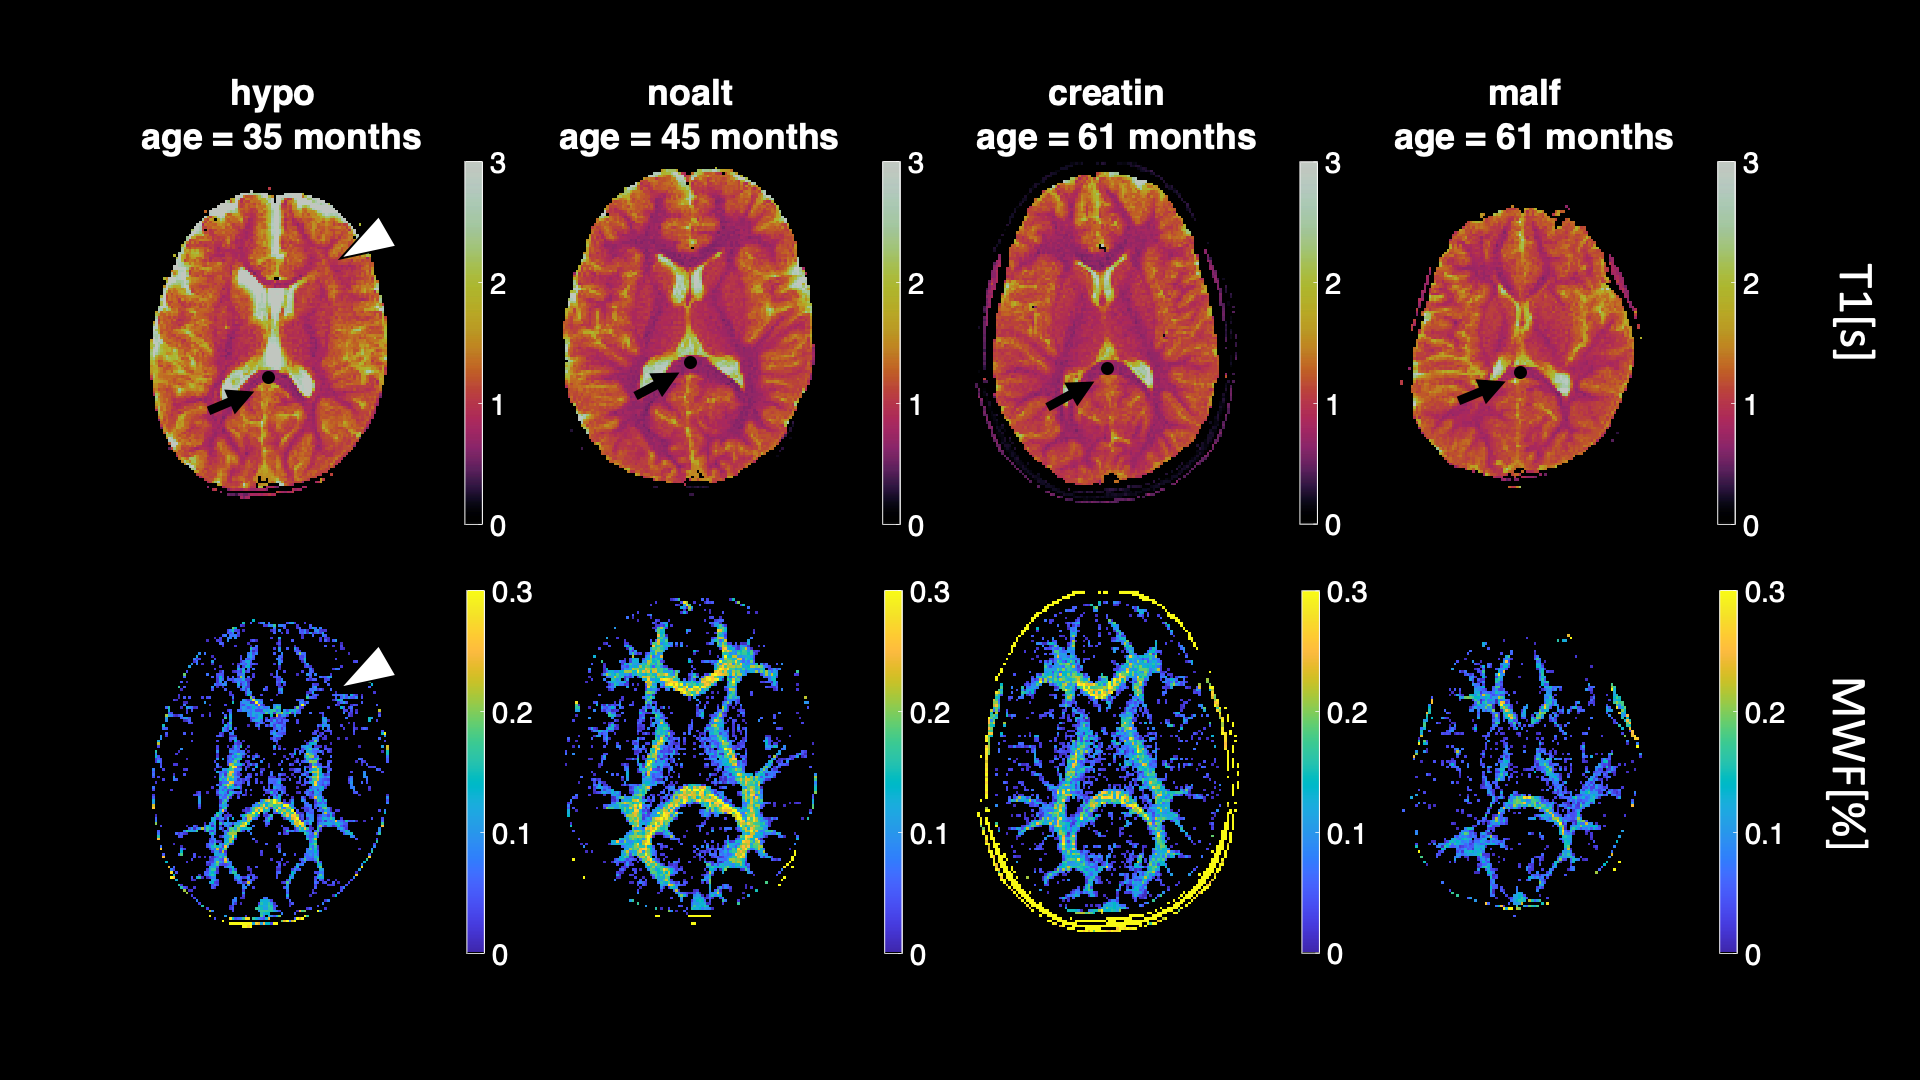
Using the proposed three-component dictionary, IEWF, MWF and FWF maps were successfully obtained in addition to T1/T2/PD maps. Quantitative maps for a representative subject are shown in Figure 2 while Figure 3 shows T1 and MWF maps of one subject per each pathology group. In the same figure, local WM signal alteration can be seen on the first subject, reflected also in the MWF map. Quantitative analysis of the myelin fraction within the splenium of corpus callosum of the subjects revealed that myelin content undergoes a rapid increase within the early years of life and then stabilizes at around 30 months of age. Fit parameters obtained only on noalt subjects were a = 0.22 ± 0.04, b = 2.00 ± 0.90 months-1, c = 0.15 ± 0.07 months and d = 0.0007 ± 0.0023 months-1 (R2 = 0.94). While data points of subjects with no WM signal alterations lie close to the fitted curve, some of the subjects with WM alterations have a significantly lower MWF for comparable ages.Discussion
We studied a cohort of patients from a child neurology unit using multi-component MRF data. As the age of tested subjects spanned from 2 months to 11 years old, we were able to precisely estimate the completion of myelination process which according to our data happened around 30 months of age. We have also included groups of patients where the myelination is clearly disrupted. A main limitation was the localization of the ROI used, focussing on the splenium of the corpus callosum. Further studies should focus on different ROIs, as it is possible to find local regions of lower MWF not bound to main WM bundles (as in the first subject of Figure 3). A further limitation here was the empirical choice of the parameters associated with each tissue component, which could be improved using more sophisticated methods estimating these parameters simultaneously with the fractions4.Conclusions
We used MRF to estimate myelination during development. Importantly, each slice took 15s to acquire, and gave a clear measure of myelination facilitating the clinical application of MRF-based MWF maps as a potential biomarker of myelination.Acknowledgements
Work was supported by the Italian Ministry of Health, under the project BIaNCA, Pediatric Network IDEA and from the Italian Ministry of Health and the Tuscany Region under the project “Ricerca Finalizzata”, Grant n. GR-2016-02361693.References
1. Deoni, S. C. L. et al.Mapping Infant Brain Myelination with Magnetic Resonance Imaging. J. Neurosci.31, 784–791 (2011).
2. Chen, Y. et al.MR fingerprinting enables quantitative measures of brain tissue relaxation times and myelin water fraction in the first five years of life. Neuroimage186, 782–793 (2019).
3. Buonincontri, G. et al.Multi-site repeatability and reproducibility of MR fingerprinting of the healthy brain at 1.5 and 3.0 T. Neuroimage(2019) doi:10.1016/j.neuroimage.2019.03.047.
4. Nagtegaal, M., Koken, P., Amthor, T. & Doneva, M. Fast multi‐component analysis using a joint sparsity constraint for MR fingerprinting. Magn. Reson. Med.(2019) doi:10.1002/mrm.27947.
Figures