0092
Optimized MR blood oximetry using multiple T2 maps: validation with MR-guided catheterization in congenital heart disease1Pediatrics, UT Southwestern Medical Center, Dallas, TX, United States, 2Radiology, UT Southwestern Medical Center, Dallas, TX, United States, 3Advanced Imaging Research Center, UT Southwestern Medical Center, Dallas, TX, United States
Synopsis
In this study, a recently proposed MRI blood oximetry technique was optimized to improve the accuracy of oxygen saturation measurements. Simulations of the Luz-Meiboom model were performed to optimize the T2-prep refocusing intervals and to guide the selection of the blood pool used for nuisance parameter estimation. Blood oxygen saturation measurements were validated against MR-guided cardiac catheterization under the same anesthetic conditions in patients with congenital heart disease, with the proposed O2 mapping technique demonstrating improved agreement with blood gas analysis. The proposed improvements may allow for future examination of blood pool oxygenation without the need for invasive cardiac catheterization.
Introduction
Blood oxygen (O2) saturation is routinely measured using invasive cardiac catheterization in the clinical management of patients with congenital heart disease (CHD). Non-invasive T2-based MRI blood oximetry has demonstrated promising results in research settings using the Luz-Meiboom (LM) model1-3, where O2 saturation is approximated through the reduced blood T2 associated with increased deoxyhemoglobin. However, improvements in accuracy are needed for this approach to become established clinically. A multiple T2 map approach was recently proposed to improve the accuracy of O2 saturation measurements by estimating the 3 unknown nuisance parameters in the LM model4: T2O (T2 of fully-oxygenated blood), τex (water proton exchange time between erythrocytes and plasma), and α (dimensionless susceptibility parameter). While this technique improved venous O2 saturation measurements, it relied on a pulse oximeter to calibrate nuisance parameters from arterial blood. However, since τex and α describe the decrease in T2 caused by deoxyhemoglobin, their estimation at high %O2 may be inaccurate. Therefore, the purpose of this study was to optimize the measurement of T2-based blood O2 saturation, and to validate using MR-guided cardiac catheterization in patients with CHD.Methods
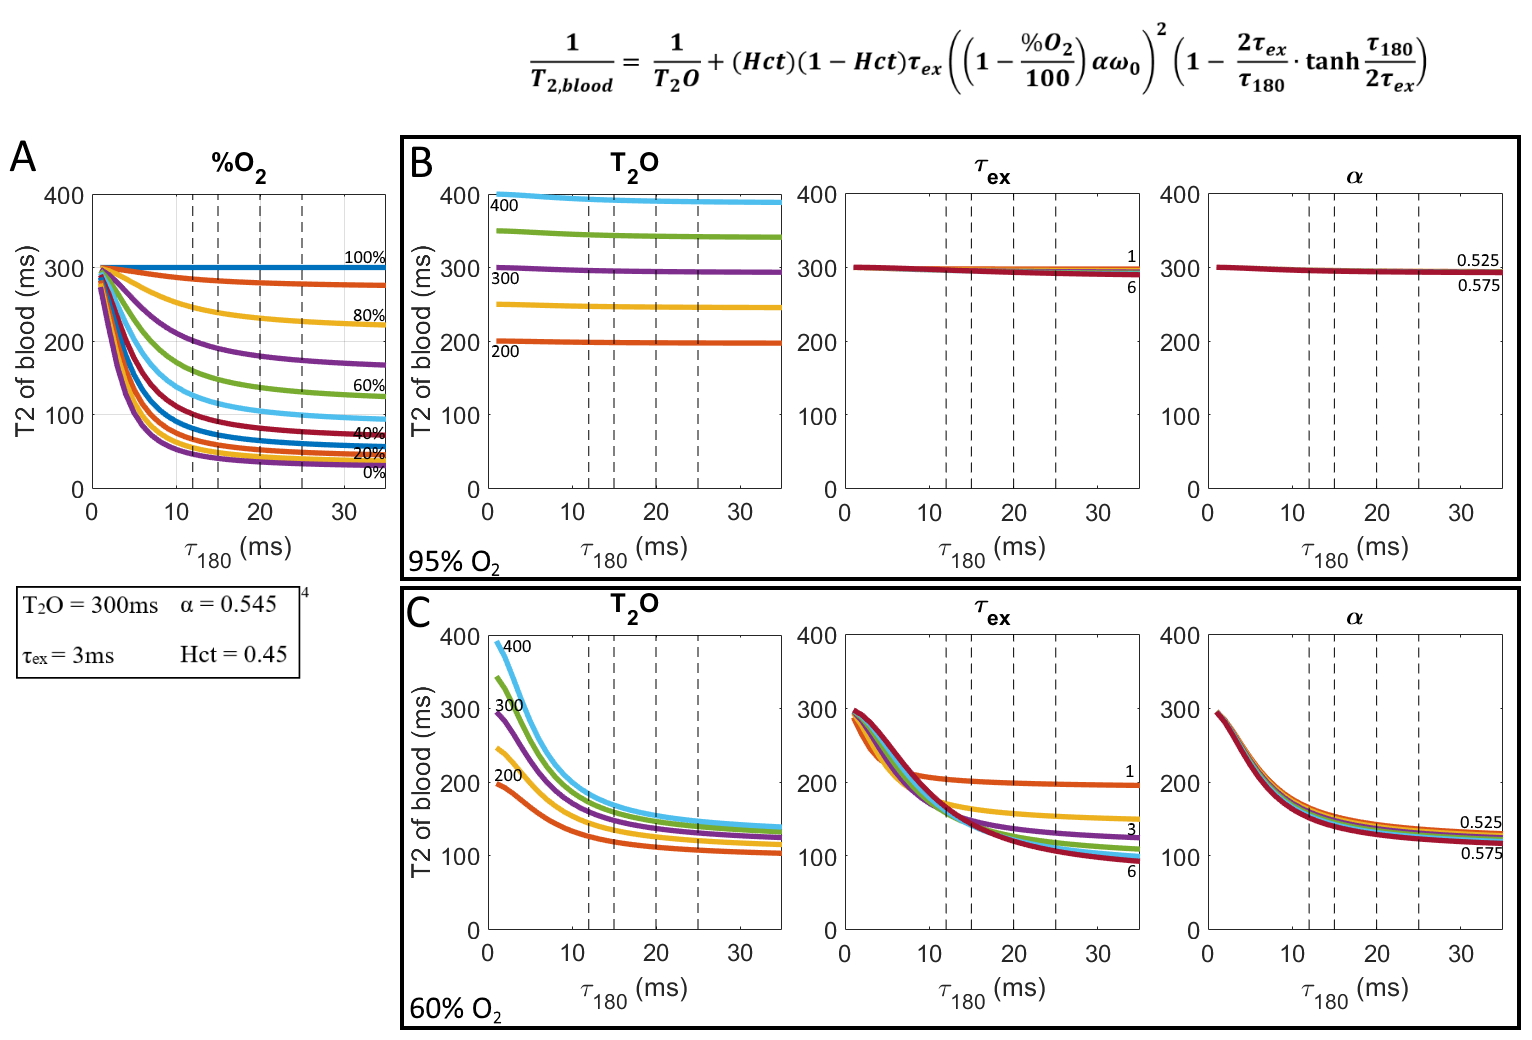
SimulationsFigure 1A shows the LM model for a range of O2 saturations. The nuisance parameters were varied to evaluate their effects on the shape of the model curve for arterial blood (95% O2 saturation, Fig. 1B) and venous blood (60% O2 saturation, Fig. 1C). While the T2O can be accurately differentiated at high O2 saturation, τex and α are insensitive to τ180 since the effects of deoxyhemoglobin are negligible (Fig. 1B). Fig 1C shows that at lower O2 saturations, T2O and τex are more sensitive to the chosen τ180, and suggests that T2O estimation may improve with a shorter τ180, while longer τ180 are more sensitive to τex.
Based on these simulations, an alternative O2 measurement approach is proposed: 1) estimate T2O from arterial blood, 2) τex and α from venous blood, and 3) extend the τ180 range for the four T2 maps to 5, 8, 12, and 24 ms for improved estimation of T2O.
MR Imaging
The O2 mapping sequence was implemented on a 1.5T Ingenia (Philips Healthcare, Best, NL). Four patients with CHD who were scheduled to undergo MR-guided diagnostic cardiac catheterization5-7 were scanned with the original and proposed mapping schemes, immediately followed by the catheterization procedure where O2 saturation was measured throughout the heart. Images were acquired using a 2D short-axis single-shot bSSFP (4-chamber for single-ventricle physiology). Other scan parameters were: 70⁰ flip angle, SENSE=2, TE/TR=0.9/1.8ms, 5s recovery between T2-weighted images, 2x2mm resolution, slice thickness = 8mm, ECG triggered to end diastole, scan time per O2 map = 2min. For the original scheme, the max number of T2-prep refocusing pulses for each map was [12, 12, 8, 8]4. The proposed short τ180 scheme requires additional pulses to adequately sample T2 decay and used a max number of refocusing pulses of [40, 24, 16, 12].
O2 mapping procedure
O2 mapping was performed in MATLAB after correcting the effective TE for the refocusing pulse duration in each T2-prep module8 and applying motion correction using affine image registration. For the original approach, 3 nuisance parameters were estimated using constrained non-linear least square fit of arterial blood with a constant O2 saturation (from pulse oximeter)4. For the proposed approach, all 4 unknown parameters were estimated, and the nuisance parameters were taken from the appropriate blood pool according to the simulations. The average nuisance parameters across subjects were used to calculate the final oxygen maps.
Results
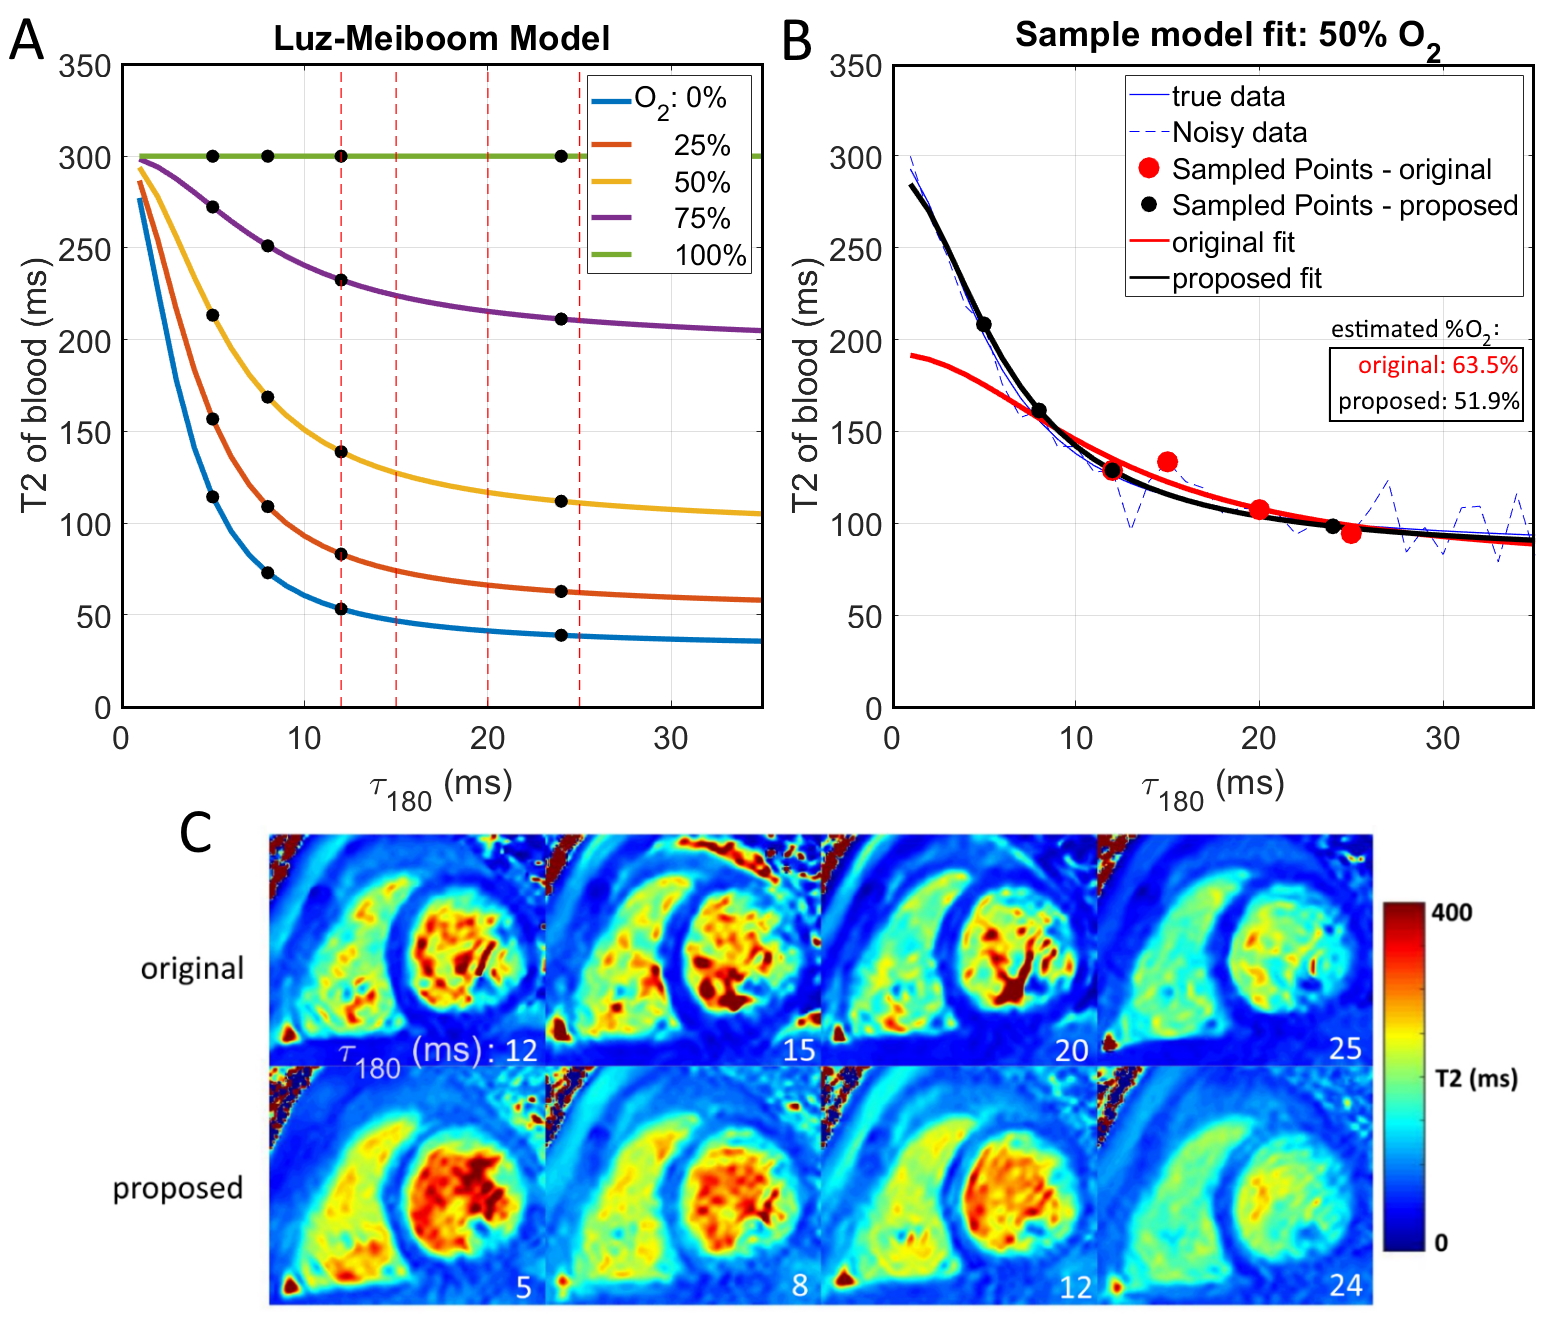
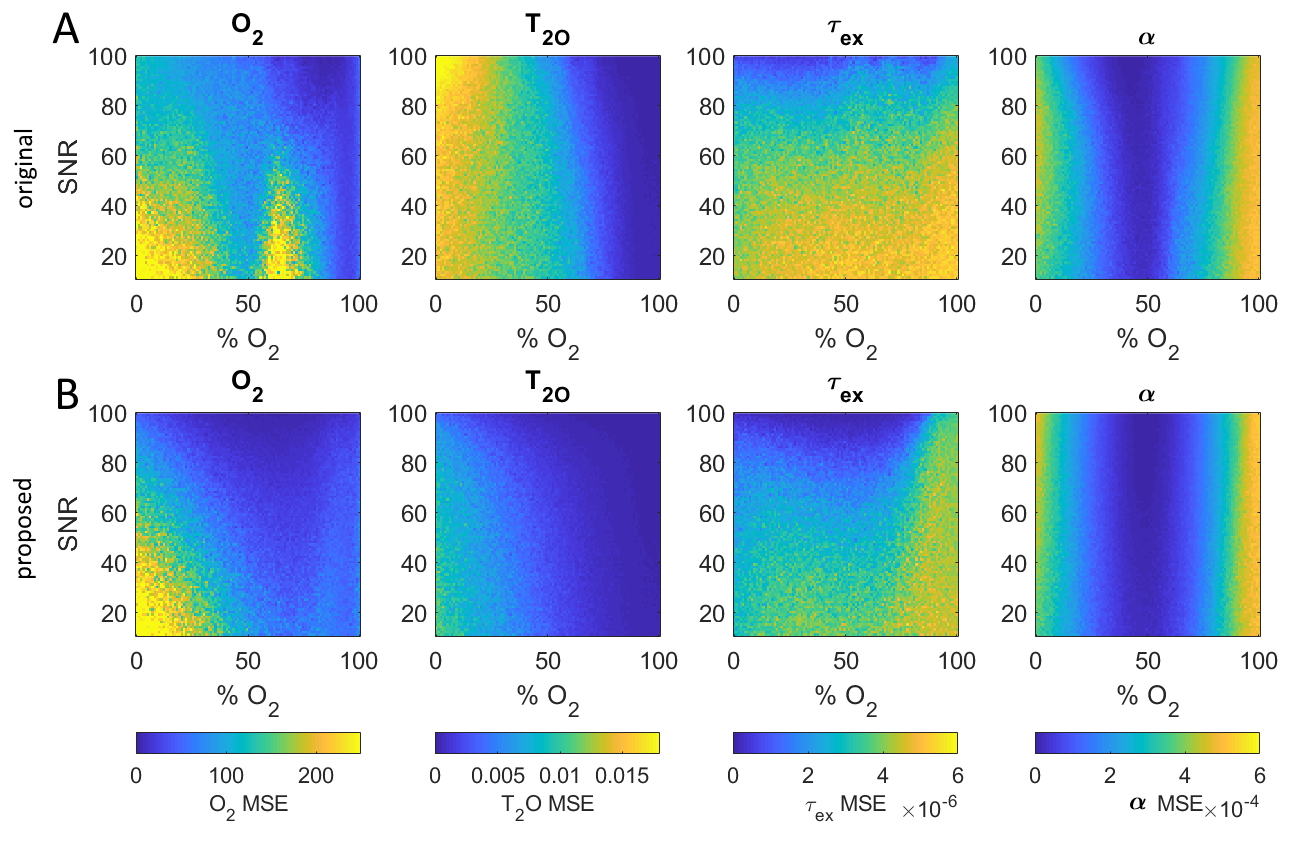
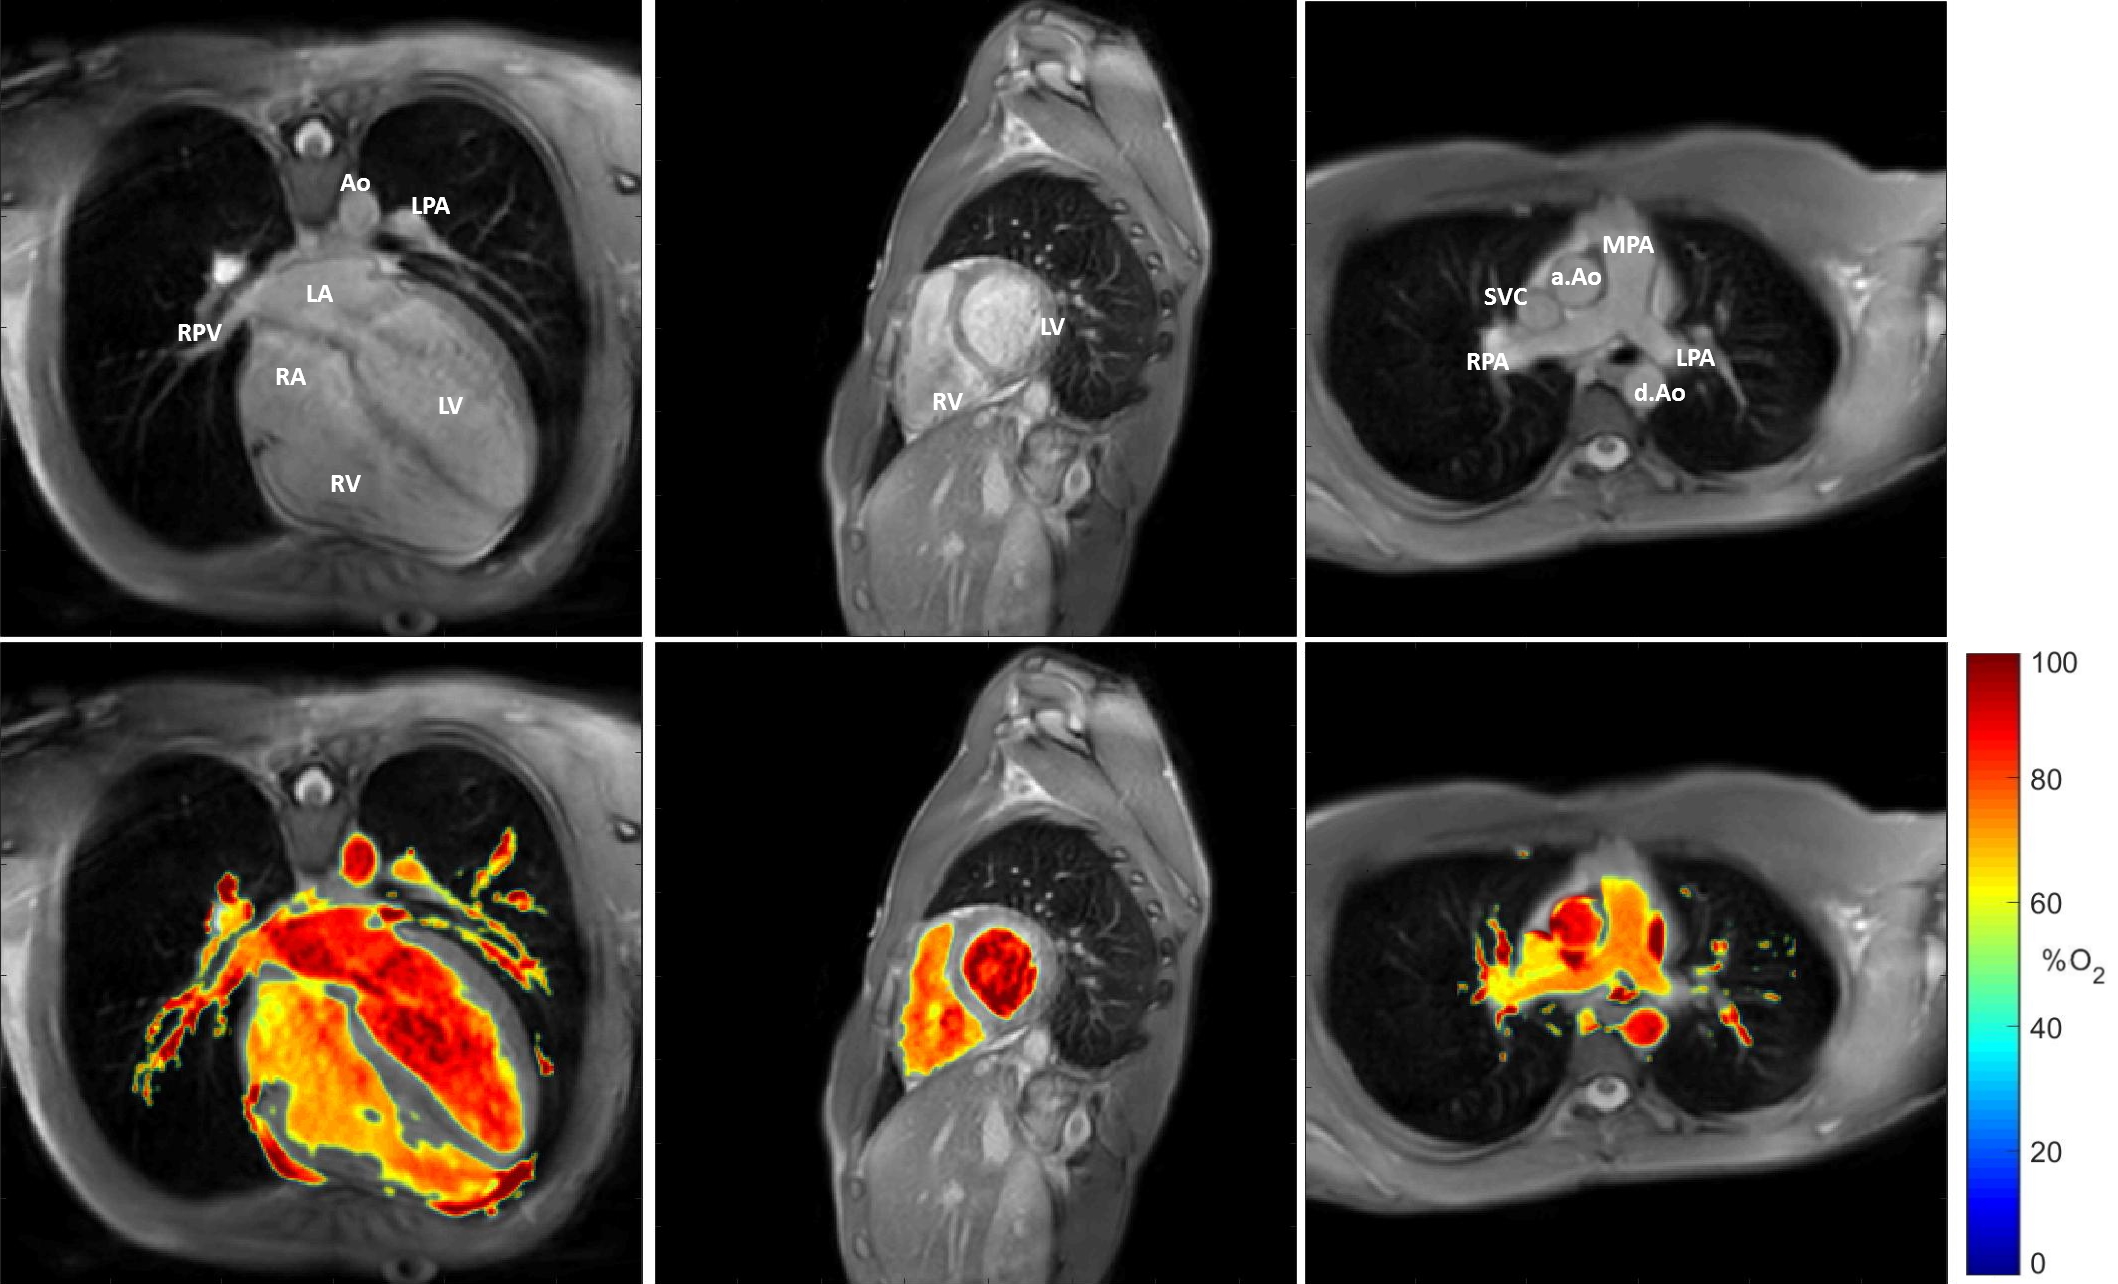
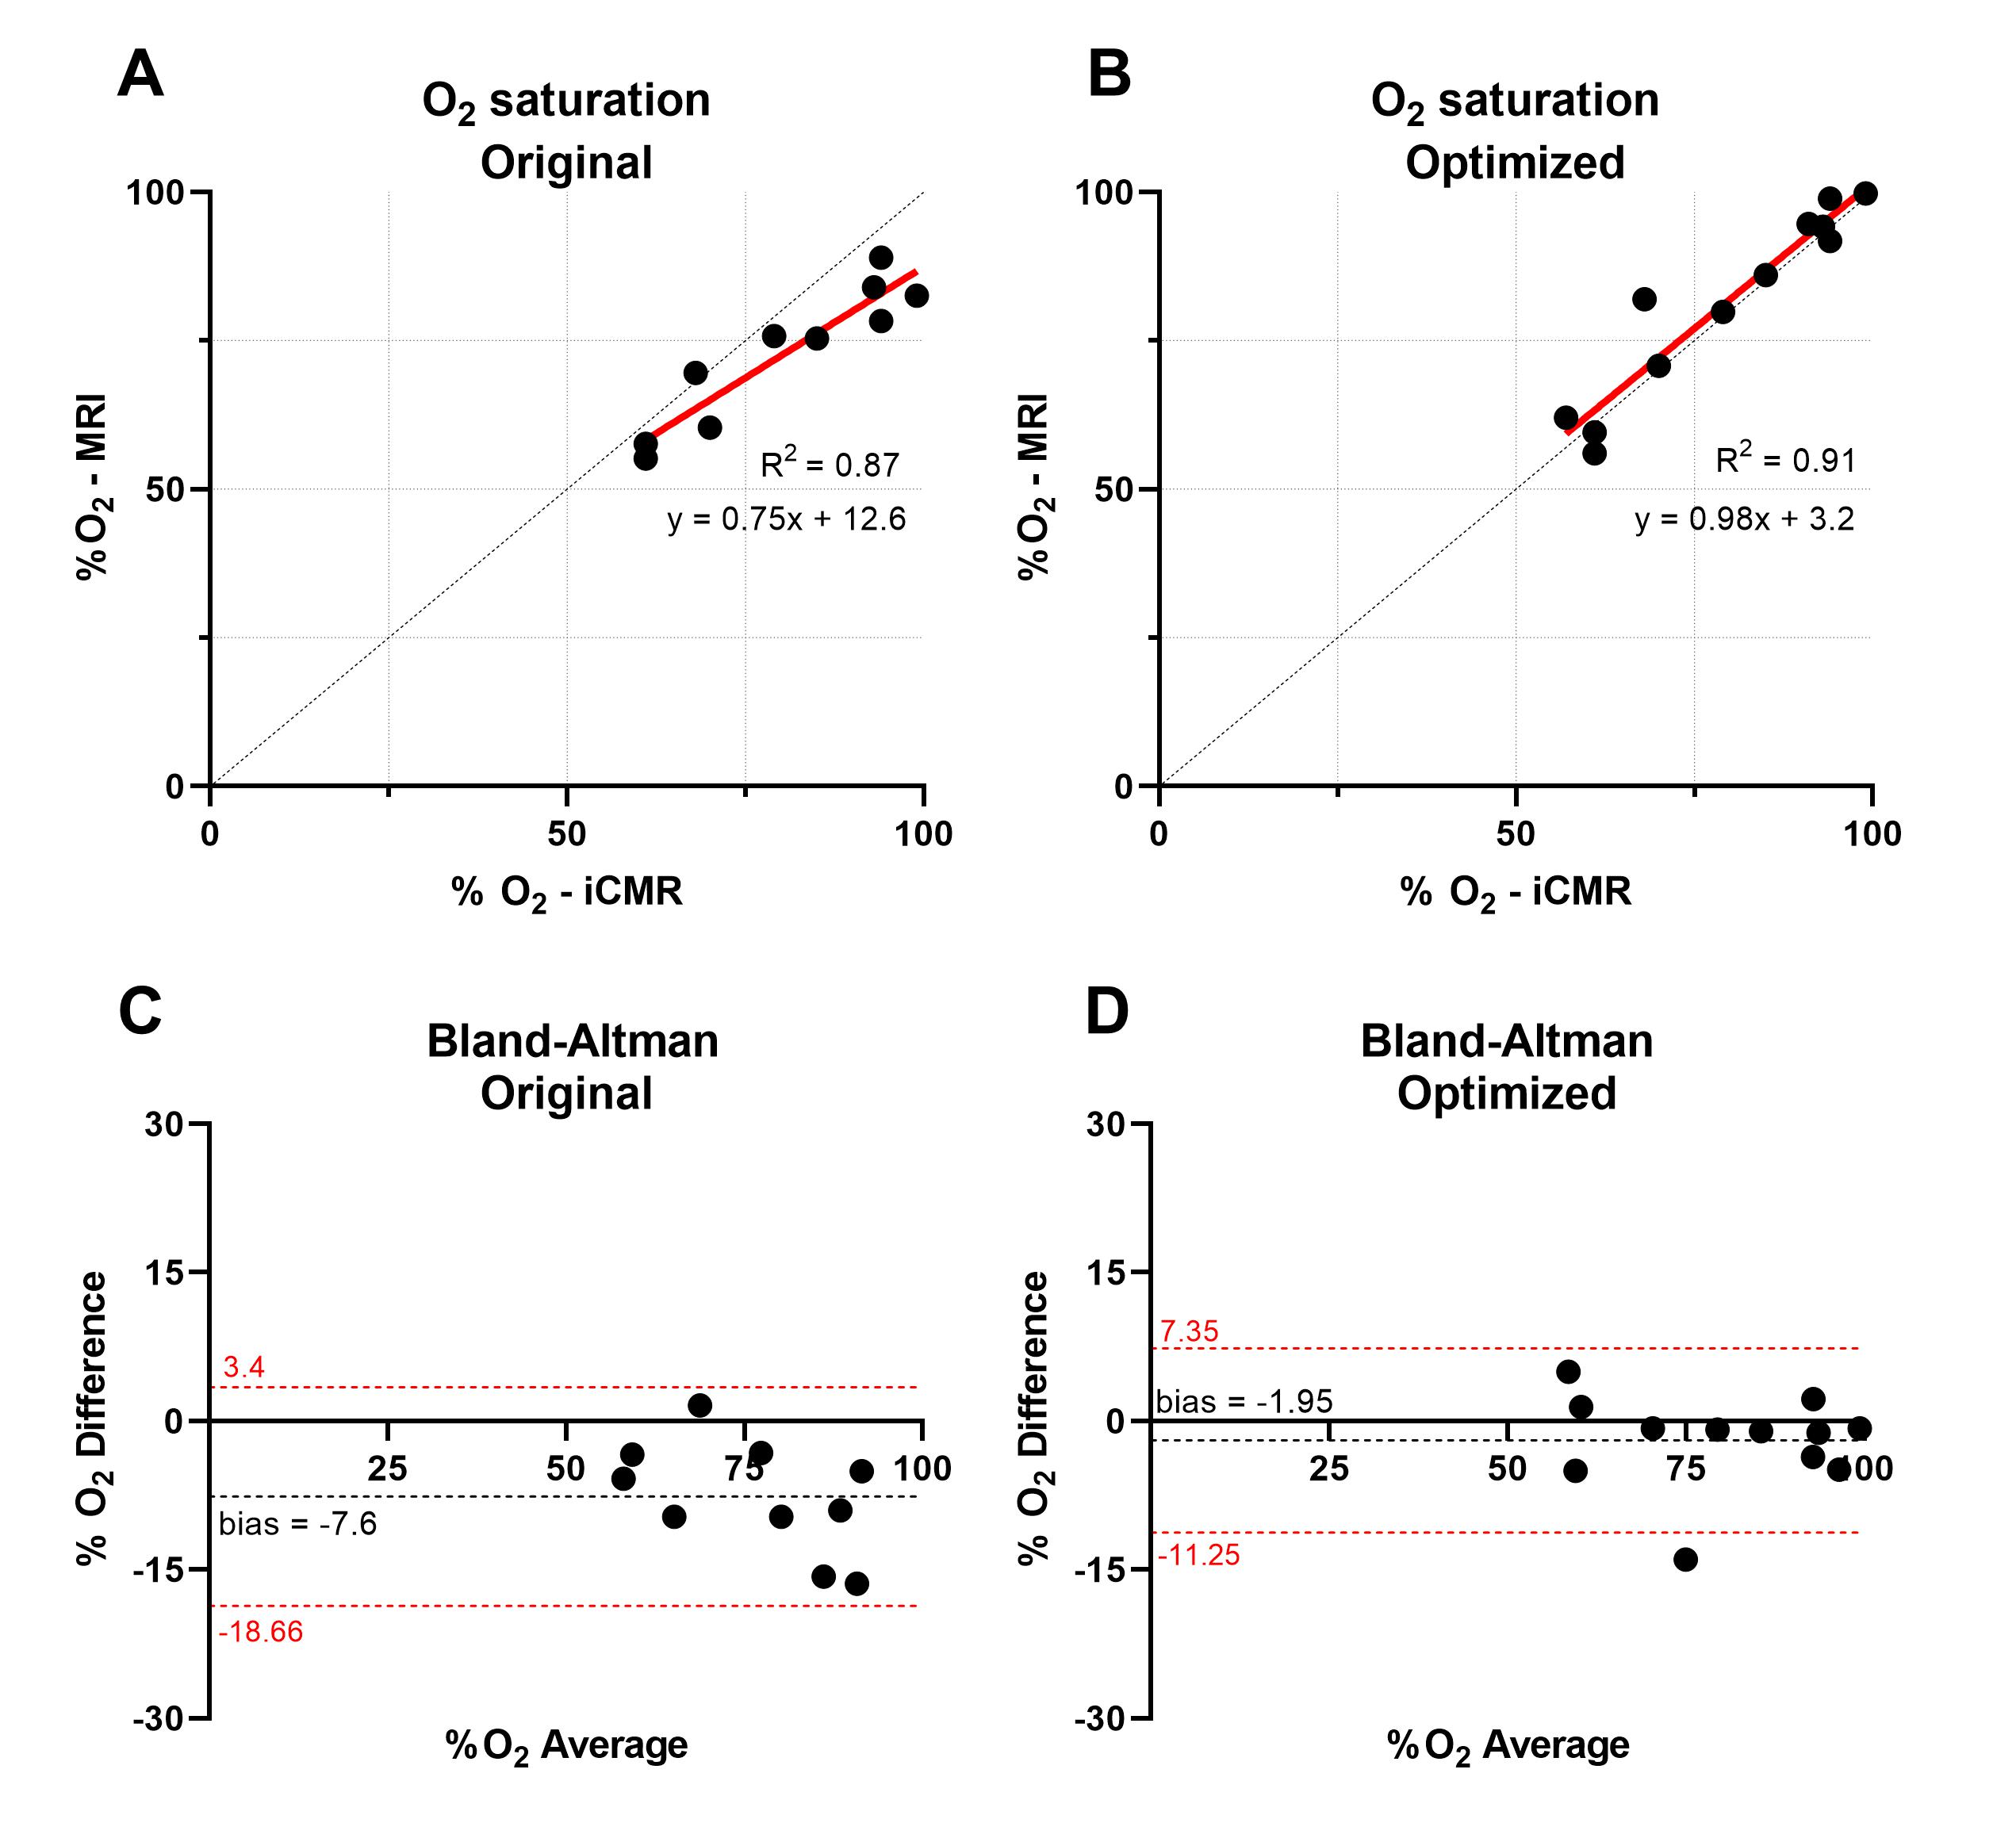
Figure 2 shows the LM model with proposed τ180 sampling times (A) and an example of the improved fit that they can provide (B) due to the higher T2 of blood (C). Monte Carlo simulations were performed to fully evaluate the improved performance of the proposed τ180 scheme, which demonstrated reduced mean square error (MSE) for all unknown parameters (Fig. 3).Figure 4 shows an O2 map acquired with the proposed approach, showing distinct arterial and venous blood pools that are consistent across imaging planes. The saturation values from the proposed approach agreed better with MR-guided catheterization, providing improved accuracy and reduced bias compared to the original approach (Fig. 5). Across all subjects, the mean ± SD of nuisance parameters (T2O, τex, α) were 265.9 ± 79 ms, 7.1 ± 3.1 ms, 0.556 ± 0.024 with the original approach, and 196 ± 13.5 ms, 5.5 ± 3.7 ms, and 0.547 ± 0.005 with the optimized technique.
Discussion
The proposed O2 mapping approach provided very good agreement with catheter-based blood O2 saturation measurements made under the same anesthetic conditions. Simulations of the LM model aided in optimizing the T2-prep refocusing intervals and were essential in the selection of blood pool for nuisance parameter learning. The optimized technique also enabled accurate measurements without pulse oximeter calibration, which provides freedom in the choice of the examined blood pool, as the imaging slice is no longer required to contain arterial blood that is assumed to match the pulse oximeter. In conclusion, we have demonstrated improved accuracy of MR-based blood oximetry using optimized multi-parametric estimation of the LM model parameters that matches closely with catheter-based measurements.Acknowledgements
No acknowledgement found.References
1 Wright, G. A., Hu, B. S. & Macovski, A. J. J. o. M. R. I. Estimating oxygen saturation of blood in vivo with MR imaging at 1.5 T. 1, 275-283 (1991).
2 Nield, L. E. et al. In vivo MRI measurement of blood oxygen saturation in children with congenital heart disease. 35, 179-185 (2005).
3 Portnoy, S. et al. Relaxation properties of human umbilical cord blood at 1.5 Tesla. 77, 1678-1690 (2017).
4 Varghese, J. et al. CMR-based blood oximetry via multi-parametric estimation using multiple T2 measurements. 19, 88 (2017).
5 Arar, Y. et al. MRWire Experience in Congenital Heart Disease. Society for Cardiovascular Magnetic Resonance. (2019).
6 Arar, Y. et al. Fick versus Flow- A Real-Time Interventional CMR Reproducibility Study. Society for Cardiovascular Magnetic Resonance. (2019).
7 Arar, Y. et al. Fontan Fenestration Test Occlusion Evaluation in the iCMR Suite. Society for Cardiovascular Magnetic Resonance. (2019).
8 Coolen, B. F. et al. Quantitative T2 mapping of the mouse heart by segmented MLEV phase‐cycled T2 preparation. 72, 409-417 (2014).
Figures