0085
3D UTE Cones for assessing lung density in paediatric cases1Nuclear Medicine, University Hospital Zurich, Zurich, Switzerland, 2GE Healthcare, Chicago, IL, United States, 3University Children's Hospital Zurich, Zurich, Switzerland, 4Radiology, University Children's Hospital Zurich, Zurich, Switzerland
Synopsis
3D ultrashort echo-time Cones is tested against PROPELLER for lung density detection in paediatric cases on two cohorts: patients with morphologically normal lungs and patients with Cystic Fibrosis. Cones seems to be able to detect lung density based on lung-to-background signal intensities ratio (LBR) while PROPELLER fails to show any correlation. Cones is able to show the lung anteroposterior gravity gradient as well. There was no difference between Cones LBR of controls and CF while pixel-intensity histogram analysis of Cones slices seem to differentiate pathological from normal lung. Qualitatively, lung constrast decreases with increasing age.
Ultrashort echo-time (UTE) sequences are designed to capture rapid decaying T2* signal. The aim was to assess the 3D UTE Cones performance in detecting lung parenchyma density in pediatric patients with morphologically normal lung (controls) and patients with cystic fibrosis (CF) in comparison to a respiration- gated fast spin-echo (FSE) T2-weighted sequence -Periodically Rotated Overlapping Parallel Lines with Enahnced Reconstruction (PROPELLER) - as a reference MRI sequence. Main hypothesis was that the lung to background ratio (LBR) is higher than 1 for Cones so a correlation between signal intensities and lung density can be achieved while PROPELLER fails to show any such correlation.
MATERIALS & METHODS
The study included two cohorts of 15 control patients (0-18 years, median age 6 years) and 15 patients with CF (1-17 years, median 4 years). The study included data between 2015-2019. For both cohorts, both lungs were segmented and mean signal intensities as well as standard deviations were extracted. On the first cohort, region-of-interest areas were drawn on anterior, middle and posterior parts of the lungs as well.
For the correlation between posterior and anterior ROIs, the controls cohort was grouped into two age subgroups, newborns till the age of 2, and from 2 years old till 18 years old. This is justified due to large LBR difference between these two age groups, we deemed that this categorisation would yield more accurate correlation. Cones and PROPELLER protocol parameters were respectively: TR 3.7/12000ms, TE 0.028/72ms, flip angle 5/140 degrees, in-plane resolution 1.4/1.3mm, slice thickness 2-3/4-8mm and scan time 3-5/6 minutes depending on the breathing pattern. A 32-channel cardiac coil and a flex coil were used.
RESULTS
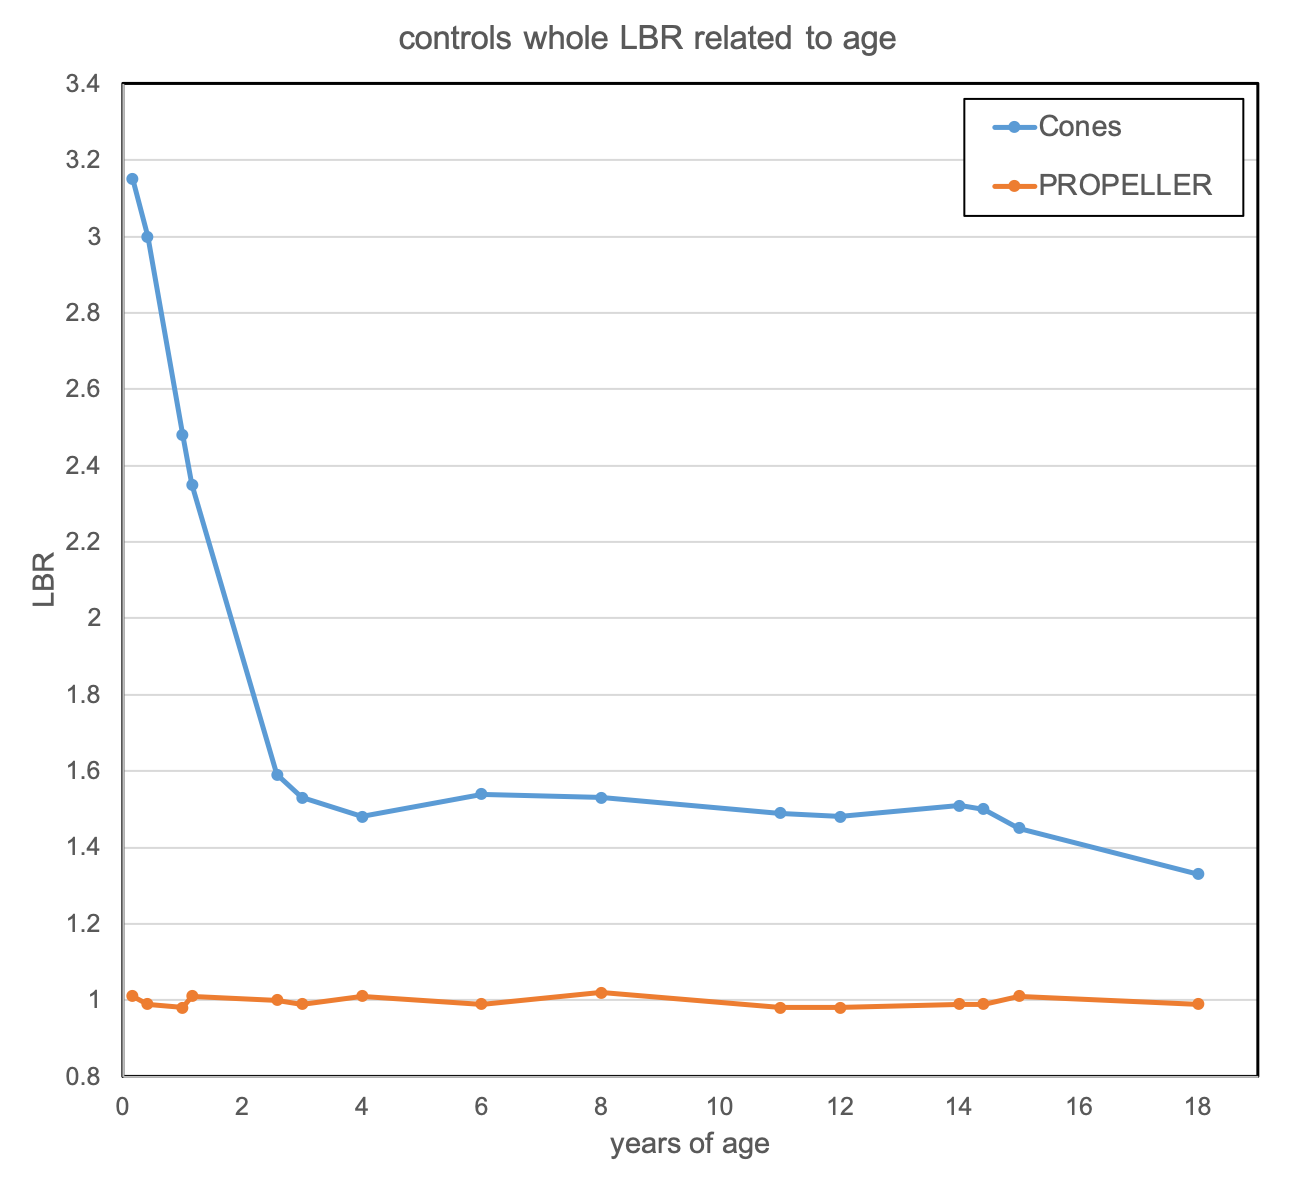
LBR for controls for Cones was constantly higher than 1 for all ages while for PROPELLER was around 1 (Figure 1). LBR was higher for newborns with a steep decrease till the age of 2 (3.15 for 2 months old to 1.59 at the age of 2) and from 2 years up to 18 years LBR was relatively constant (1.53 to 1.33).
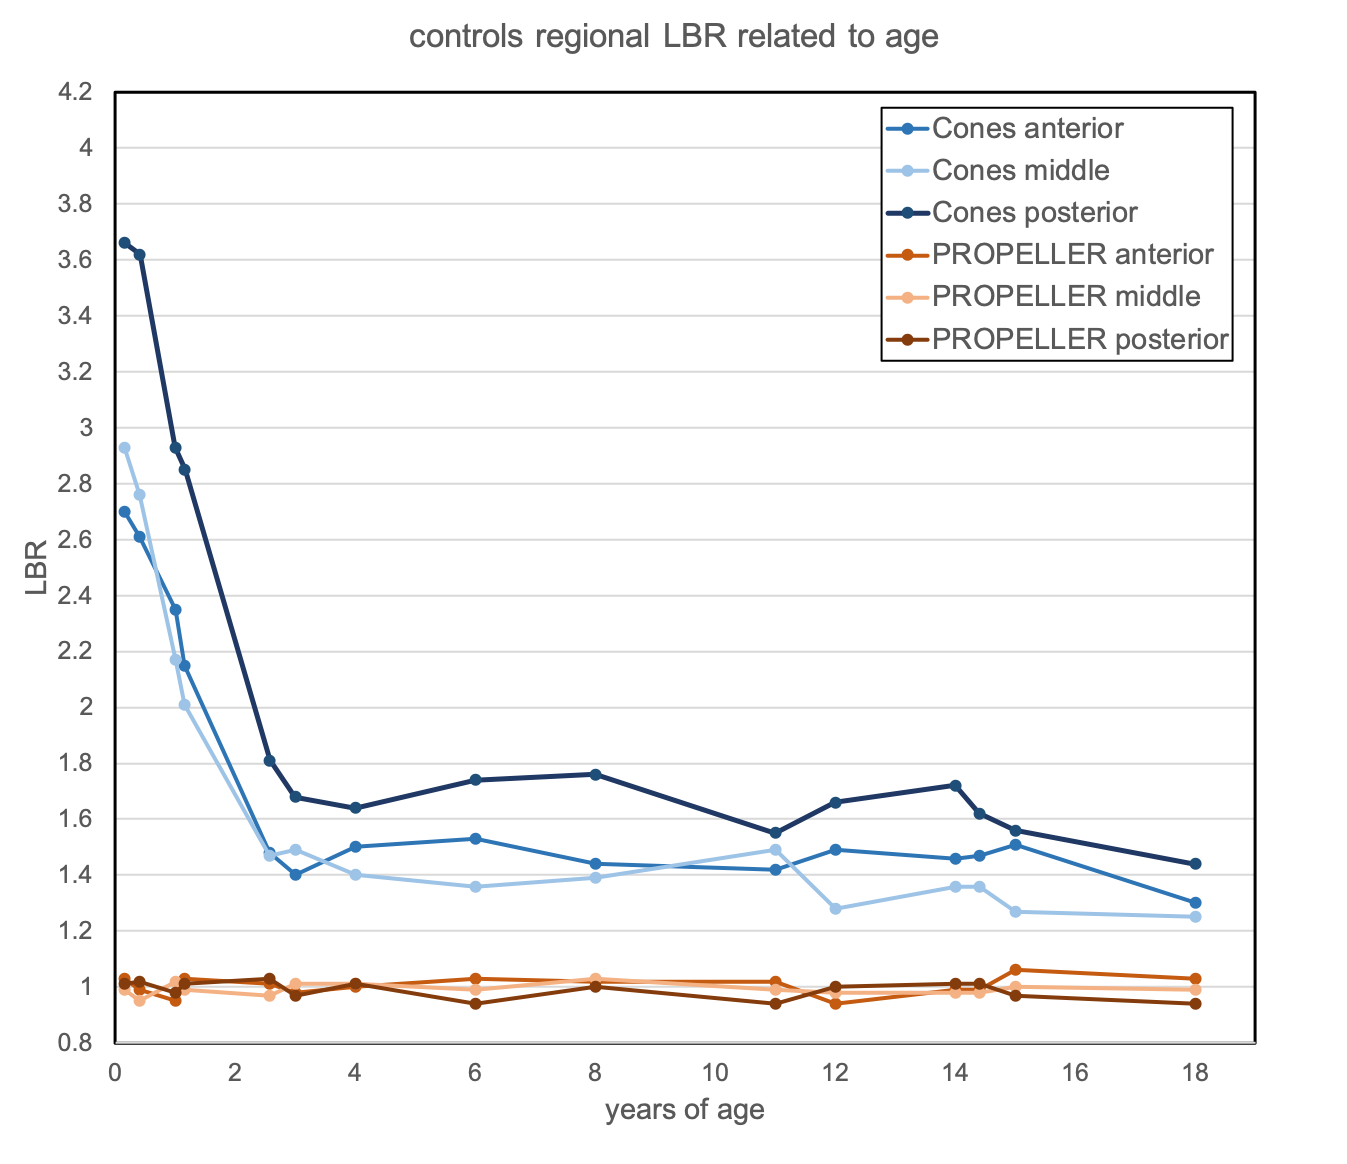
Figure 2 shows the regional LBR for controls for Cones and PROPELLER from anterior to posterior based on the ROI analysis. Posterior LBR for Cones was higher than anterior and middle LBRs while for PROPELLER all regional LBRs were around 1.
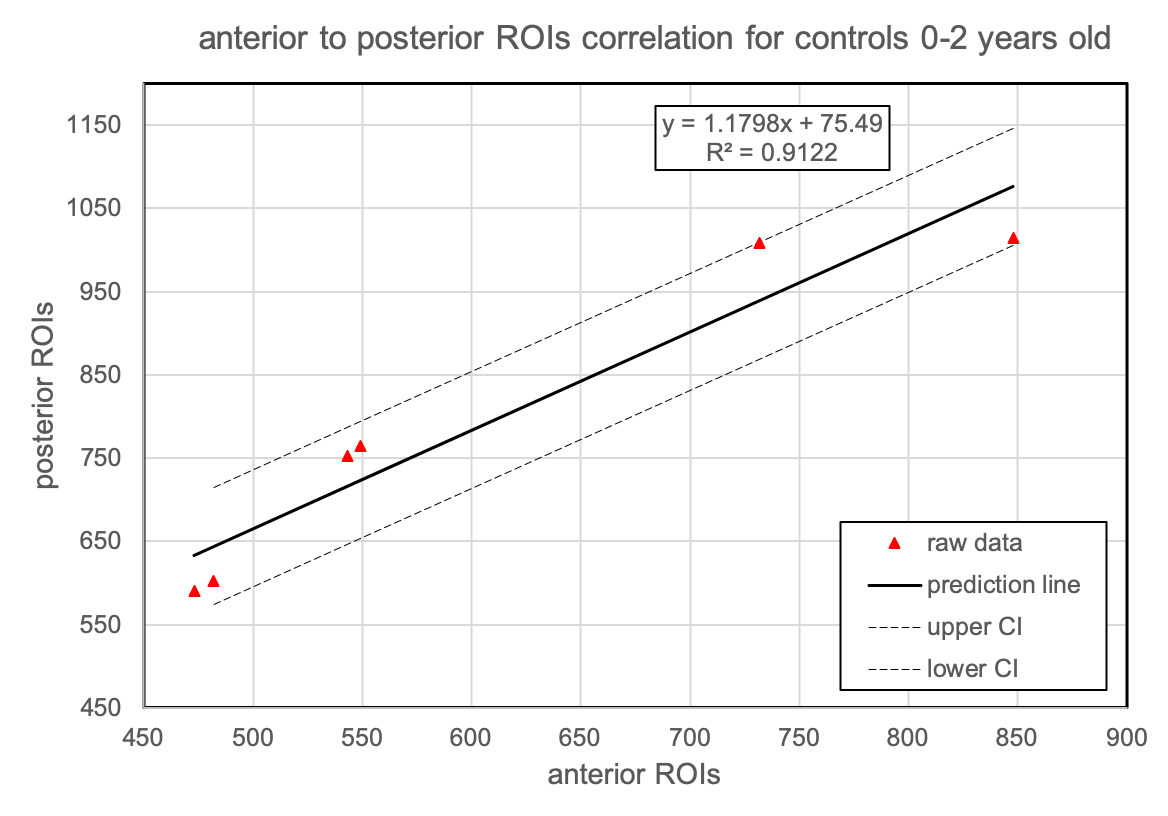
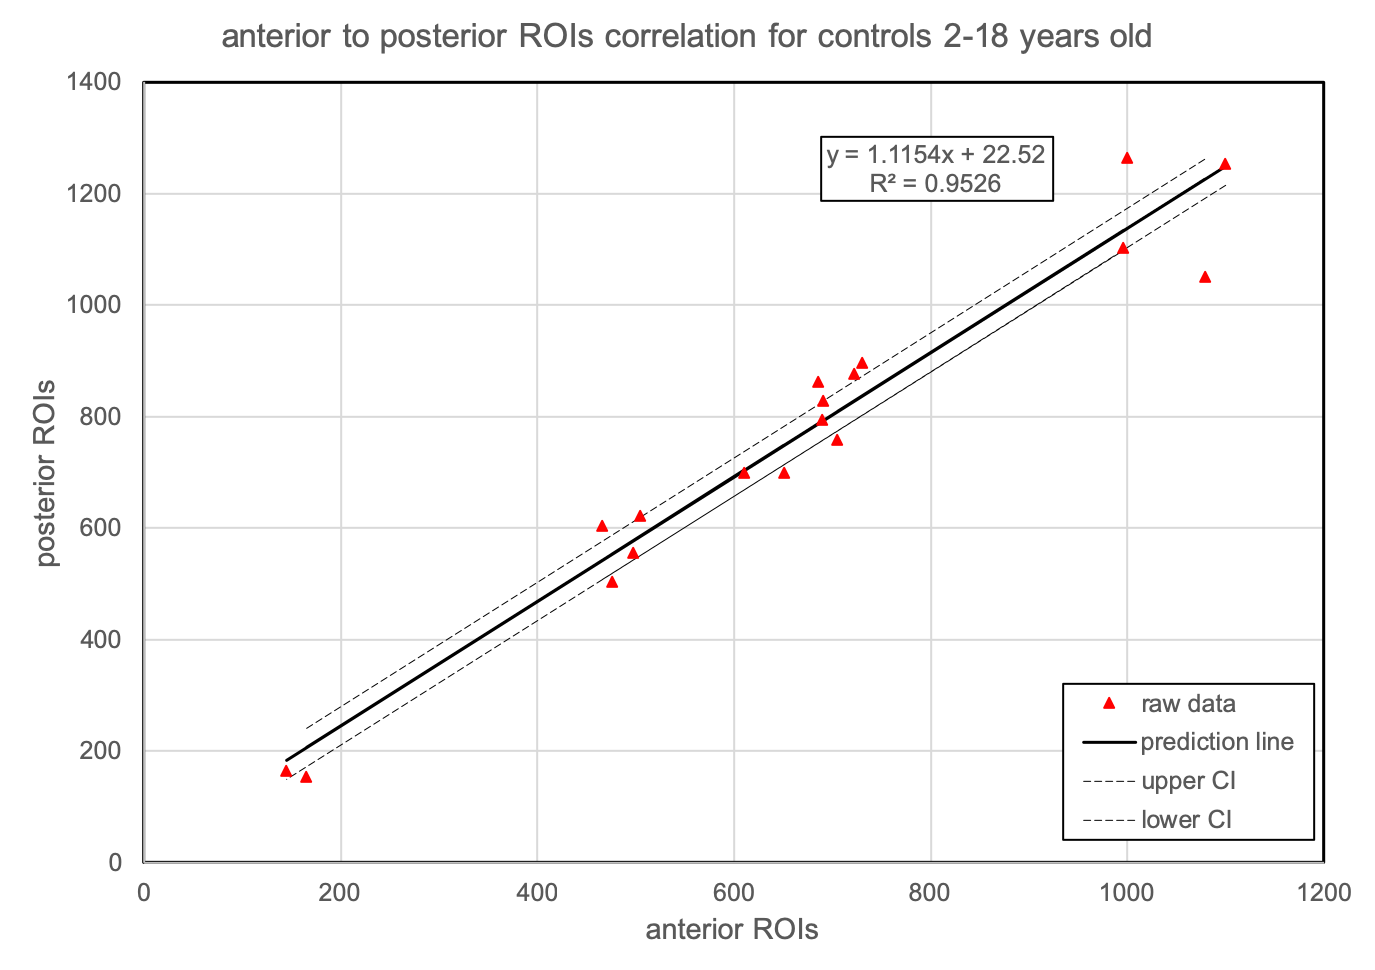
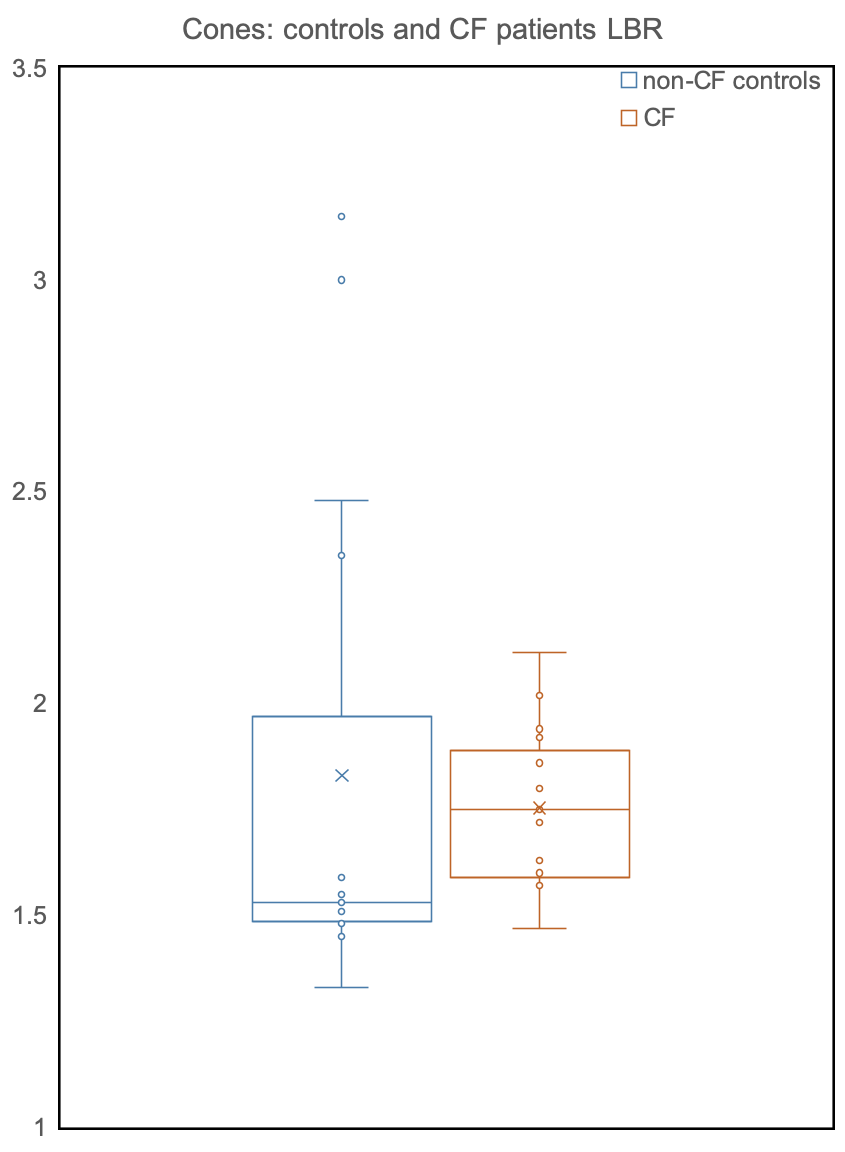
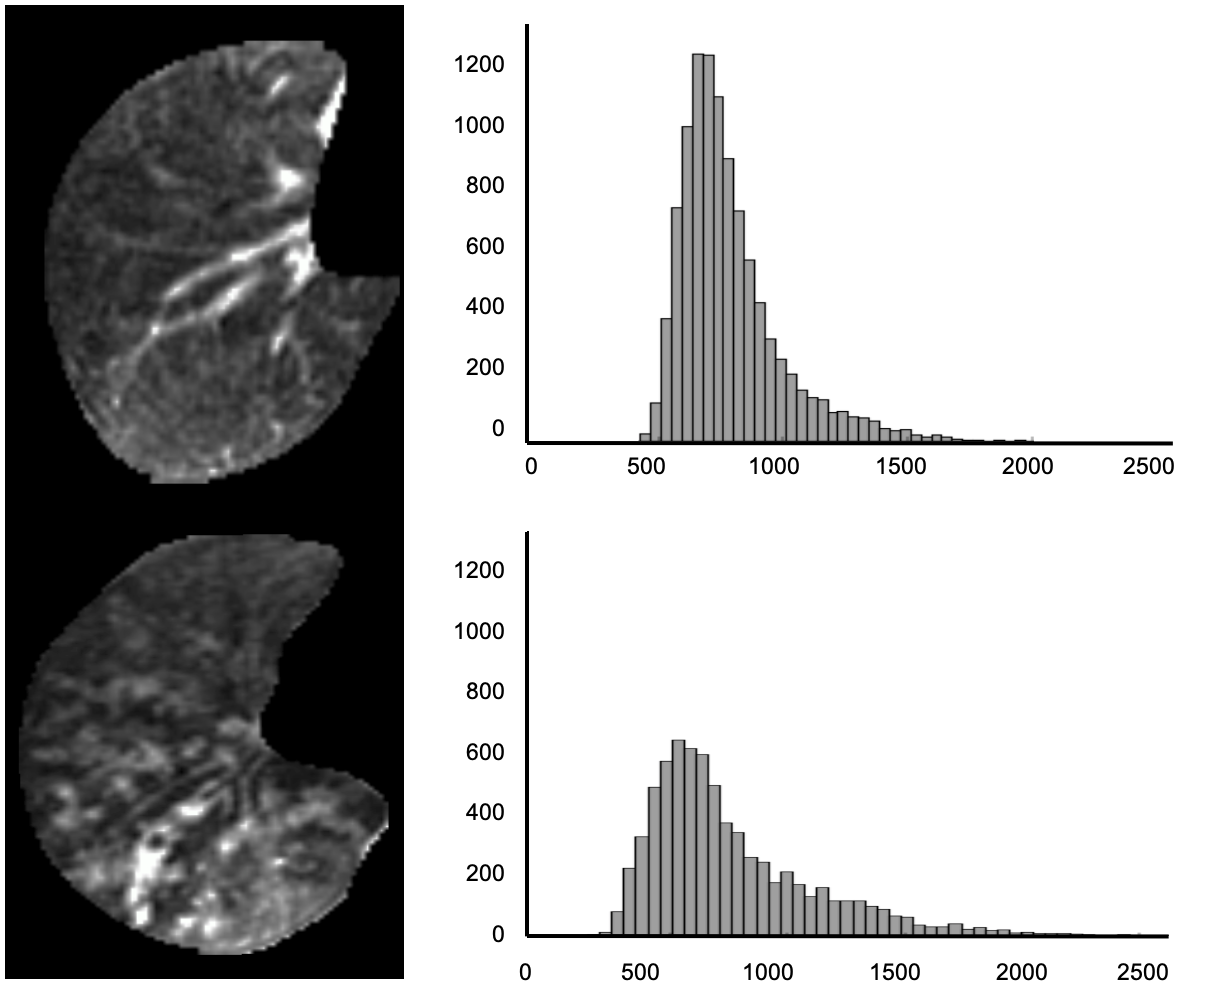
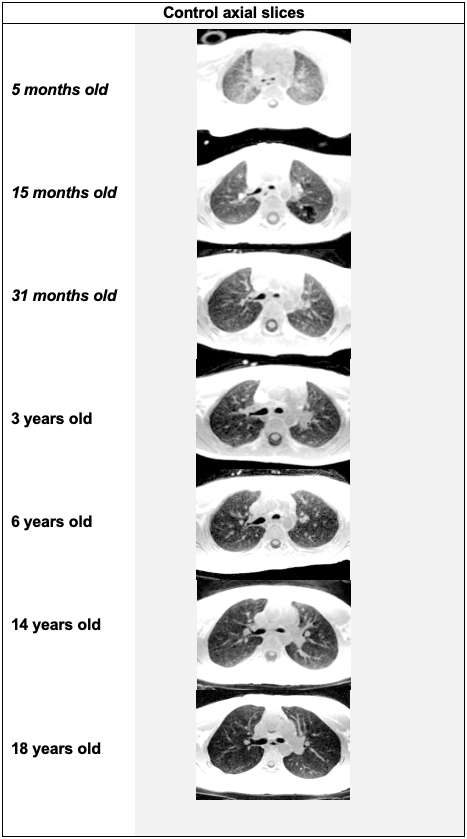
Figure 3 shows the correlation between posterior and anterior ROIs for controls scanned with Cones. Based on the linear fitting, posterior LBR was 18% higher than the anterior for newborns up till the age of 2. Respectively, figure 4 shows the same correlation for ages over 2 up till the age of 18 with posterior LBR being 11% higher than the anterior LBR. Figure 5 exhibits the Cones LBR whisker chart of all controls (blue) and CF (orange) patients. There was no difference of statistical significance between Cones LBR of controls and CF, even though median LBR for CF was higher than the controls. An image and pixel-intensity histogram comparison between a control and a CF patient with mucus plugging can be seen in Figure 6. Skewness for the control and the CF was 1.75/0.87, and the kurtosis was accordingly 1.56/0.52. Clinical Cones images of representative ages can be viewed in Figure 7.
DISCUSSION
With this retrospective study in children who underwent clinically indicated lung MRI, we show that lung signal intensity measured by an UTE sequence correlates to lung parenchymal density while standard FSE failed to show age-depndent signal changes.
The age-dependency of the lung signal intensity, from newborns up to two years , based on Cones imaging, was in agreement with the CT findings in the literature where the lung density was higher for newborns till the age of 2 and then stabilised till the age of 18 with a steady but mild decrease1. Even though, we did not do a hard quantification of the lung density, the LBR curve follows that trend. Newborns had 3 times higher lung signal intensity than the background where from the age of 2 and on, the lung signal stabilised on a plateau of 1.5 to 1.3 times higher than the background. The strong negative correlation, based on the Spearman rank correlation test, between age and LBR, showed that the lung density decreases with age.
Another confirmatory finding is that Cones shows the vertical lung gravity gradient since posterior LBR is consistently higher than the anterior and middle LBR. Median LBR seems to be not a useful indicator for differentiating between normal and CF pathological lung, since there was no difference between controls and CF patients. However, pixel-intensity histogram analysis of Cones slices could be employed for showing pathological lung. Qualitatively, lung contrast decreases with increasing age.
CONCLUSION
3D UTE Cones is promising for assessing lung density in children and might open up new possibilities to evaluate, grade and measure lung pathology which is not possible with conventional MRI (FSE).
Acknowledgements
No acknowledgement found.References
1.Long FR, Williams RS, Castile RG. Inspiratory and expiratory CT lung density in infants and young children. Pediatr Radiol. 2005;35:677-83.
Figures