0084
Neonatal Lung Ventilation Mapping from Proton Ultrashort Echo-Time MRI1Center for Pulmonary Imaging, Cincinnati Children's Hospital Medical Center, Cincinnati, OH, United States, 2Biomedical Image Analysis Group, Imperial College London, London, United Kingdom, 3Biomedical Engineering, University of Wisconsin-Madison, Madison, WI, United States, 4Bronchopulmonary Dysplasia (BPD) Center, Cincinnati Children's Hospital Medical Center, Cincinnati, OH, United States
Synopsis
Neonatal lung disease is often related to premature birth or congenital abnormalities. Structural MRI has been performed in these patients but does not indicate which lung regions perform gas exchange. Registered respiratory gated ultra-short echo-time proton MRI can produce lung ventilation maps in neonates throughout the respiratory cycle. This technique showed clear differences between a control subject and 2 patients with lung disease in terms of ventilation efficiency (inhaled air per milliliter of lung), spatial and temporal ventilation homogeneity. Further differences were shown post-surgical intervention, demonstrating the method and as a potential means to assess treatment efficacy.
Introduction
The majority of patients in the neonatal intensive care unit face respiratory morbidities. These conditions often include chronic lung disease of prematurity (bronchopulmonary dysplasia, BPD) or congenital diaphragmatic hernia (CDH), in which the abdominal viscera herniate into the thoracic cavity in utero, restricting lung growth. Proton ultra-short echo-time (UTE) MRI has been demonstrated to have clinical relevance in these conditions1,2 However, structural imaging alone cannot determine the function of the lung parenchyma, in particular whether regional lung pathologies (e.g. cysts) are ventilating.Ventilation has been evaluated with MRI using inhaled contrast agents such as hyperpolarized 3He or 129Xe gases, but has only been employed in neonates in a limited proof-of-concept capacity.3 Previous proton MRI ventilation imaging approaches are based on Fourier decomposition.4–6 An alternative approach includes registration of short-echo-time MR images at different lung volumes to determine the change in density of each voxel within the lung, which agrees well with 3He imaging.7 However, previous work with this technique was performed using breath-hold maneuvers, which do not represent tidal breathing.
This work demonstrates novel lung ventilation imaging in neonates based on registration of respiratory-navigated proton UTE MRI, without sedation, ionizing radiation, contrast agents, or breathing maneuvers. This technique can map the time-course of tidal inspiration and expiration, identifying lung regions that ventilate early or late in the breath, potentially indicating regions that ventilate at different pleural pressures.
Methods
UTE MRI was performed on a neonatal-sized 1.5T scanner.8–11 Three neonates were imaged near term-equivalent age: 1 respiratory control, 1 subject with CDH who was imaged pre-surgery and 16 days post-surgery, and 1 subject with severe BPD.Imaging parameters were: repetition time 5 ms, echo time 200μs, flip angle 5º, field of view 18cm, number of radial projections 200,000, isotropic resolution 0.70mm, and scan time 16min. As previously described, MR data were retrospectively reconstructed into 8 images throughout the respiratory cycle using a sliding-window algorithm.10,12 Reconstruction was performed by iteratively estimated sampling density compensation weights13 and applying them to undersampled, non-uniformly sampled k-space.14
The images were normalized to a scale between 0 and 1 representing the mean intensity of air and muscle respectively, yielding ~g/ml for lung density.15 Each image was then registered to the end-exhalation image using joined deformable motion tracking, implemented in MIRTK (mirtk.github.io) to align the anatomy in each image.16,17 The voxel-wise intensity difference between each image and the end-exhalation image are due to the change in the volume of air in each voxel and therefore represent ventilation to each voxel. Each lung’s tidal volume could be calculated by summing the ventilation to each voxel over the breath.
Results
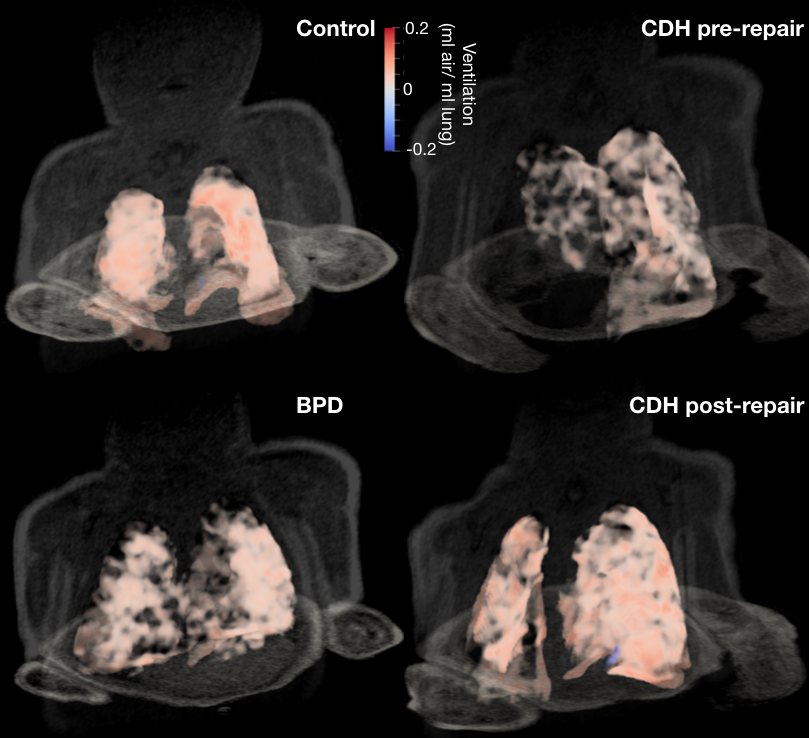
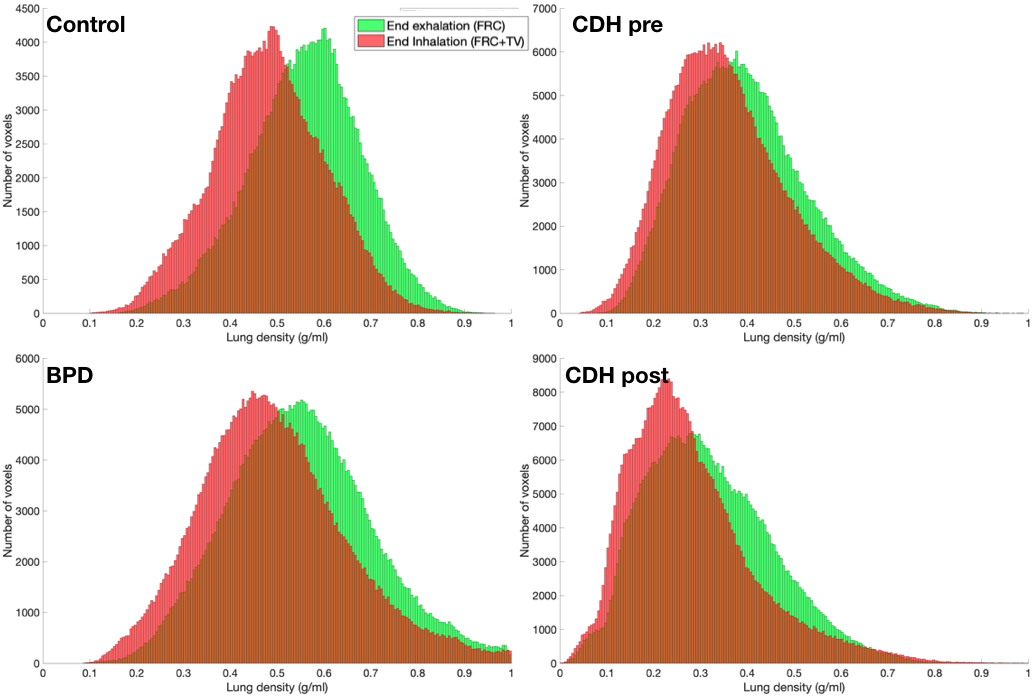
Figure 1 shows three-dimensional ventilation maps for each subject. The control subject has the highest mean ventilation per milliliter of lung (0.08ml air/ml lung) and also the most homogenous ventilation distribution. Both the BPD subject and the CDH subject (pre-repair) had lower mean ventilation than the control (0.06 and 0.04ml air/ml lung, respectively). At 16 days post-repair in the CDH patient, the mean ventilation did not change (0.04ml air/ml lung), although the tidal volume was considerably larger (13.5ml vs 21.7ml).Figure 2 shows histograms of lung density at end-inhalation and end-exhalation. While the mean density at end-exhalation is approximately equal for BPD and control subjects, the ventilation distribution is wider in the BPD subject , showing both hyper- and hypo ventilated regions; this is expected, given the heterogeneous nature of lung parenchymal pathologies in BPD. The end-inhalation and end-exhalation histograms are closer together in the BPD subject, showing the reduced mean ventilation. The CDH subject’s lungs were less dense than the control’s at inhalation and exhalation and did not improve post-repair. The low lung density may be responsible for the low mean ventilation in this patient.
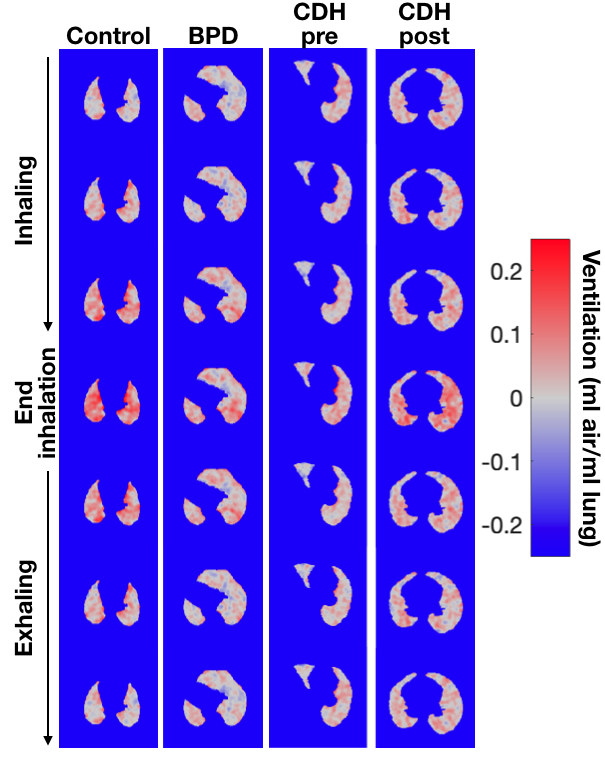
The time-course of ventilation is shown on axial slices through the lung in Figure 3. The control patient has relatively uniform change in ventilation through time, with medial lung regions filling somewhat faster than the periphery. In the subject with BPD, ventilation does not change significantly during early inhalation, then increases suddenly near the end of inhalation, showing a less smooth respiratory cycle. Ventilation is also less spatially homogenous. In the subject with CDH, ventilation is considerably lower, but again shows a rapid increase at the end of inhalation compared to the beginning. Post-CDH-repair, there is much more ventilation in this axial slice, and the temporal breathing profile is much smoother.
Discussion
Registration of respiratory-gated UTE MRI can regionally evaluate lung density changes, interpreted here to be ventilation, throughout the breathing cycle in neonates during restful breathing, without contrast agents, sedation, or ionizing radiation. In this small demonstration cohort, differences between the control subject and those with BPD and CDH were observed in terms of tidal volume, ventilation efficiency, and temporal and spatial homogeneity. In the subject with CDH, these factors also differed between pre- and post-repair, indicating the possibility of using this technique serially to assess treatment and surgical repair efficacy.Conclusion
A combination of retrospectively-gated UTE MRI and image registration can produce ventilation maps throughout the breathing cycle in neonates which may be useful in quantifying disease severity, predicting clinical outcomes, and assessing clinical interventions.Acknowledgements
The authors would like to acknowledge support from the Cincinnati Children’s Research Foundation, The Hartwell Foundation at University of Wisconsin – Madison, and NIH T32 HL007752, R01 HL146689, P01 HD093363.References
1. Higano NS, Spielberg DR, Fleck RJ, et al. Neonatal Pulmonary MRI of Bronchopulmonary Dysplasia Predicts Short-term Clinical Outcomes. Am J Respir Crit Care Med. May 2018:rccm.201711-2287OC. doi:10.1164/rccm.201711-2287OC
2. Adaikalam SA, Higano NS, Tkach JA, et al. Neonatal lung growth in congenital diaphragmatic hernia: evaluation of lung density and mass by pulmonary MRI. Pediatr Res. June 2019:1-6. doi:10.1038/s41390-019-0480-y
3. Altes TA, Meyer CH, Mata JF, et al. Hyperpolarized helium-3 magnetic resonance lung imaging of non-sedated infants and young children: a proof-of-concept study. Clin Imaging. 2017;45:105-110. doi:10.1016/J.CLINIMAG.2017.04.004
4. Tiddens HAWM, Stick SM, Wild JM, et al. Respiratory tract exacerbations revisited: Ventilation, inflammation, perfusion, and structure (VIPS) monitoring to redefine treatment.Pediatr Pulmonol. 2015;50(S40):S57-S65. doi:10.1002/ppul.23266
5. Voskrebenzev A, Gutberlet M, Kaireit TF, Wacker F, Vogel-Claussen J. Low-pass imaging of dynamic acquisitions (LIDA) with a group-oriented registration (GOREG) for proton MR imaging of lung ventilation. Magn Reson Med. 2017;78(4):1496-1505. doi:10.1002/mrm.26526
6. Voskrebenzev A, Gutberlet M, Klimeš F, et al. Feasibility of quantitative regional ventilation and perfusion mapping with phase-resolved functional lung (PREFUL) MRI in healthy volunteers and COPD, CTEPH, and CF patients. Magn Reson Med. 2018;79(4):2306-2314. doi:10.1002/mrm.26893
7. Pennati F, Quirk JD, Yablonskiy DA, Castro M, Aliverti A, Woods JC. Assessment of Regional Lung Function with Multivolume 1H MR Imaging in Health and Obstructive Lung Disease: Comparison with 3He MR Imaging. Radiology. 2014;273(2):580-590. doi:10.1148/radiol.14132470
8. Tkach JA, Hillman NH, Jobe AH, et al. An MRI system for imaging neonates in the NICU: Initial feasibility study. Pediatr Radiol. 2012;42(11):1347-1356. doi:10.1007/s00247-012-2444-9
9. Tkach JA, Merhar SL, Kline-Fath BM, et al. MRI in the neonatal ICU: Initial experience using a small-footprint 1.5-T system. Am J Roentgenol. 2014;202(1). doi:10.2214/AJR.13.10613
10. Higano NS, Hahn AD, Tkach JA, et al. Retrospective respiratory self-gating and removal of bulk motion in pulmonary UTE MRI of neonates and adults. Magn Reson Med. 2017;77(3):1284-1295. doi:10.1002/mrm.26212
11. Merhar SL, Tkach JA, Woods JC, et al. Neonatal imaging using an on-site small footprint MR scanner. Pediatr Radiol. 2017;47(8):1001-1011. doi:10.1007/s00247-017-3855-4
12. Bates AJ, Higano NS, Hysinger EB, et al. Quantitative Assessment of Regional Dynamic Airway Collapse in Neonates via Retrospectively Respiratory-Gated 1H Ultrashort Echo Time MRI. J Magn Reson Imaging. September 2018. doi:10.1002/jmri.26296
13. Pipe JG, Menon P. Sampling density compensation in MRI: Rationale and an iterative numerical solution. Magn Reson Med. 1999;41(1):179-186. doi:10.1002/(SICI)1522-2594(199901)41:1<179::AID-MRM25>3.0.CO;2-V
14. Hahn AD, Higano NS, Walkup LL, et al. Pulmonary MRI of neonates in the intensive care unit using 3D ultrashort echo time and a small footprint MRI system. J Magn Reson Imaging. 2017;45(2):463-471. doi:10.1002/jmri.25394
15. Higano NS, Fleck RJ, Spielberg DR, et al. Quantification of neonatal lung parenchymal density via ultrashort echo time MRI with comparison to CT. J Magn Reson Imaging. 2017;46(4):992-1000. doi:10.1002/jmri.25643
16. Rueckert D, Sonoda LI, Hayes C, Hill DLG, Leach MO, Hawkes DJ. Nonrigid registration using free-form deformations: application to breast MR images. IEEE Trans Med Imaging. 1999;18(8):712-721. doi:10.1109/42.796284
17. Bates AJ, Schuh A, McConnell K, et al. A Novel Method to Generate Dynamic Boundary Conditions for Airway CFD by Mapping Upper Airway Movement with Non-Rigid Registration of Dynamic and Static MRI. Int j numer method biomed eng. August 2018:e3144. doi:10.1002/cnm.3144
Figures