0082
Disrupted structural connectome in Duchenne’s muscular dystrophy: Classifying and subtyping based on Dp140 dystrophin isoform
Apurva Shah1, Apoorva Safai1, Veeramani Preethish Kumar2, Atchayaram Nalini2, Jitender Saini3, and Madhura Ingalhalikar1
1Symbiosis Center for Medical Image Analysis, Symbiosis International University, Pune, India, 2Department of Neurology, National Institute of Mental Health and Neurosciences, Bengaluru, India, 3Department of Radiology, National Institute of Mental Health and Neurosciences, Bengaluru, India
1Symbiosis Center for Medical Image Analysis, Symbiosis International University, Pune, India, 2Department of Neurology, National Institute of Mental Health and Neurosciences, Bengaluru, India, 3Department of Radiology, National Institute of Mental Health and Neurosciences, Bengaluru, India
Synopsis
Duchenne Muscular Dystrophy (DMD) is a genetic neuromuscular disorder, characterized by muscle weakness and cognitive deficits due to mutation in DMD gene. Dp140+ and Dp140- are DMD subtypes derived based on promoter site of isoform Dp140 in DMD gene. Our work investigated the structural connectivity in DMD and its sub-types and demonstrated widespread and global reduction in connectivity across whole brain in DMD compared to controls. Higher dysconnectivity was observed in Dp140- subtype especially in cerebellar and frontal regions compared to Dp140+ implying that the promotor site of Dp140 isoform plays a crucial role in terms of impaired information processing.
Introduction
Duchenne Muscular Dystrophy (DMD) is a X-linked recessive neuromuscular disorder caused by loss of dystrophin due to mutations in DMD gene1. In addition to severe and progressive muscle weakness in young boys, significant cognitive manifestations such as low IQ, reading difficulties and neuropsychiatric illnesses like ADHD, ASD, OCD, epilepsy are prevalent in DMD patients2-4. The DMD gene comprises of multiple independent tissue specific promoters that produce isoforms of various lengths and splicing patterns. Isoforms from variants of downstream promoter Dp140, are derived based on the promoter site and are found to influence cognitive functioning. However, the impact on brain structure in terms of connectivity is not known. The investigation of such genotype-brain structure relationship is therefore crucial and our study focuses on comprehensively characterizing the diffusion based structural connectivity and evaluating changes in global and nodal network measures in a moderately large cohort of DMD patients and its Dp140 subtypes.Method
In this study, 57 DMD patients (age: 8.1 ± 1.2 years) and 38 (age: 8.4 ± 1.4 years) healthy controls (HC) were recruited, who underwent detailed clinical and neurological examination, genetic testing (MLPA testing) and MRI scanning. Disease severity was assessed using Muscular Dystrophy Functional Rating Scale (MDFRS). Among DMD patients (MDFRS: 98.96±10.31), 23 were identified as Dp+140 (age: 7.8 ± 1.1 years; MDFRS: 104.13±7.65) and were identified as Dp140- 34 (age: 8.3± 1.2 years; MDFRS: 95.47±10.5) using MLPA testing. MRI images of all subjects were acquired using 3T Philips Achieva with 32 channel head coil. T1 weighted images were acquired with TR/TE=9.8ms/4.6ms, FOV=240x240, voxel size=1x1x1mm. Diffusion MRI data was acquired in 15 diffusion directions with b value=1000s/mm2 and a single b value=0 s/mm2 using single-shot spin-echo, echo planar axial plane, SENSE reduction factor =2.5, TR/TE=5000ms/65ms, FOV=128x128,voxel size=1.75x1.75x2mm. Processing of T1 weighted images included skull stripping, bias correction, tissue segmentation and parcellation of brain into 86 regions was done using Freesurfer5. Preprocessing of diffusion images included eddy current and motion correction followed by brain extraction. Structural connectome (SC) was constructed by performing probabilistic fiber tracking in FSL6 as shown in Figure 1. Global and nodal network measures were constructed using Brain Connectivity Toolbox [ref]. Multivariate Analysis of Covariance (MANCOVA) was performed to compare global and nodal measures between HC and DMD group with age as covariate and were corrected for multiple comparison with FDR p<0.05. To evaluate differences in global and nodal measures between DMD subtypes, a t-test was applied between Dp140+ and Dp140- groups, with threshold of p<0.05. Edge-wise analysis was performed between HC and DMD and within DMD sub groups using NBS with 10000 permutation and p-value<0.05.Results
Global measures such as global efficiency (HC: 0.077 ± 0.01, DMD:0.072 ± 0.01, p=0.046), transitivity (HC: 1.642 ± 0.43, DMD:1.409 ± 0.42,p=0.015) and clustering coefficient (CC) (HC: 1.627 ± 0.44, DMD:1.393 ± 0.43,p=0.017) were significantly reduced in DMD patients compared to HC, whereas characteristic path length (HC: 0.041 ± 0.01, DMD:0.046 ± 0.01,p=0.004) was significantly increased. A trend for higher density and lower characteristic path length was seen in Dp140+ compared to Dp140- groups (p<0.05, uncorrected). In comparison to HC group, DMD patients showed significantly lower nodal strength and lower local efficiency in multiple cortical regions and left hippocampus as shown in figure 2. No significant differences in global or nodal measures were found between Dp140+ and Dp140-. Network analysis using NBS showed significantly higher connectivity in 128 connections in HC group compared to DMD group as shown in figure 3. Higher connectivity was observed in 13 connections including cerebellar and frontal regions in Dp140+ group as compared to Dp140- group as shown in figure 4.Conclusion
Structural connectivity was widely disrupted in DMD patients, while the impaired connectivity in cerebellar and frontal region was found to be majorly driven by patients with Dp140- sub type than Dp140+ sub type. The altered global network measures in DMD demonstrated weakened information processing and poor network segregation whereas abnormal nodal measures indicated lower overall connectivity and less resistance to network failure. In conclusion, our results establish a genotype-brain connectivity relationship and characterize the structural network based abnormalities in DMD that are more peculiar to Dp140- sub-type.Acknowledgements
No acknowledgement found.References
- Bushby K, Finkel R, Birnkrant DJ, et al. Diagnosis and management of Duchenne muscular dystrophy, part 1: diagnosis, and pharmacological and psychosocial management. Lancet Neurol 2010;9:77–93.
- Pane M, Lombardo ME, Alfieri P, et al. Attention deficit hyperactivity disorder and cognitive function in Duchenne muscular dystrophy: phenotype-genotype correlation. J Pediatr 2012;161:705-709.e1.
- D’Angelo MG, Lorusso ML, Civati F, et al. Neurocognitive profiles in Duchenne muscular dystrophy and gene mutation site. Pediatr Neurol 2011;45:292–9.
- Banihani R, Smile S, Yoon G, et al. Cognitive and Neurobehavioral Profile in Boys With Duchenne Muscular Dystrophy. J Child Neurol 2015;30:1472–82.
- http://surfer.nmr.mgh.harvard.edu
- http://fsl.fmrib.ox.ac.uk
Figures
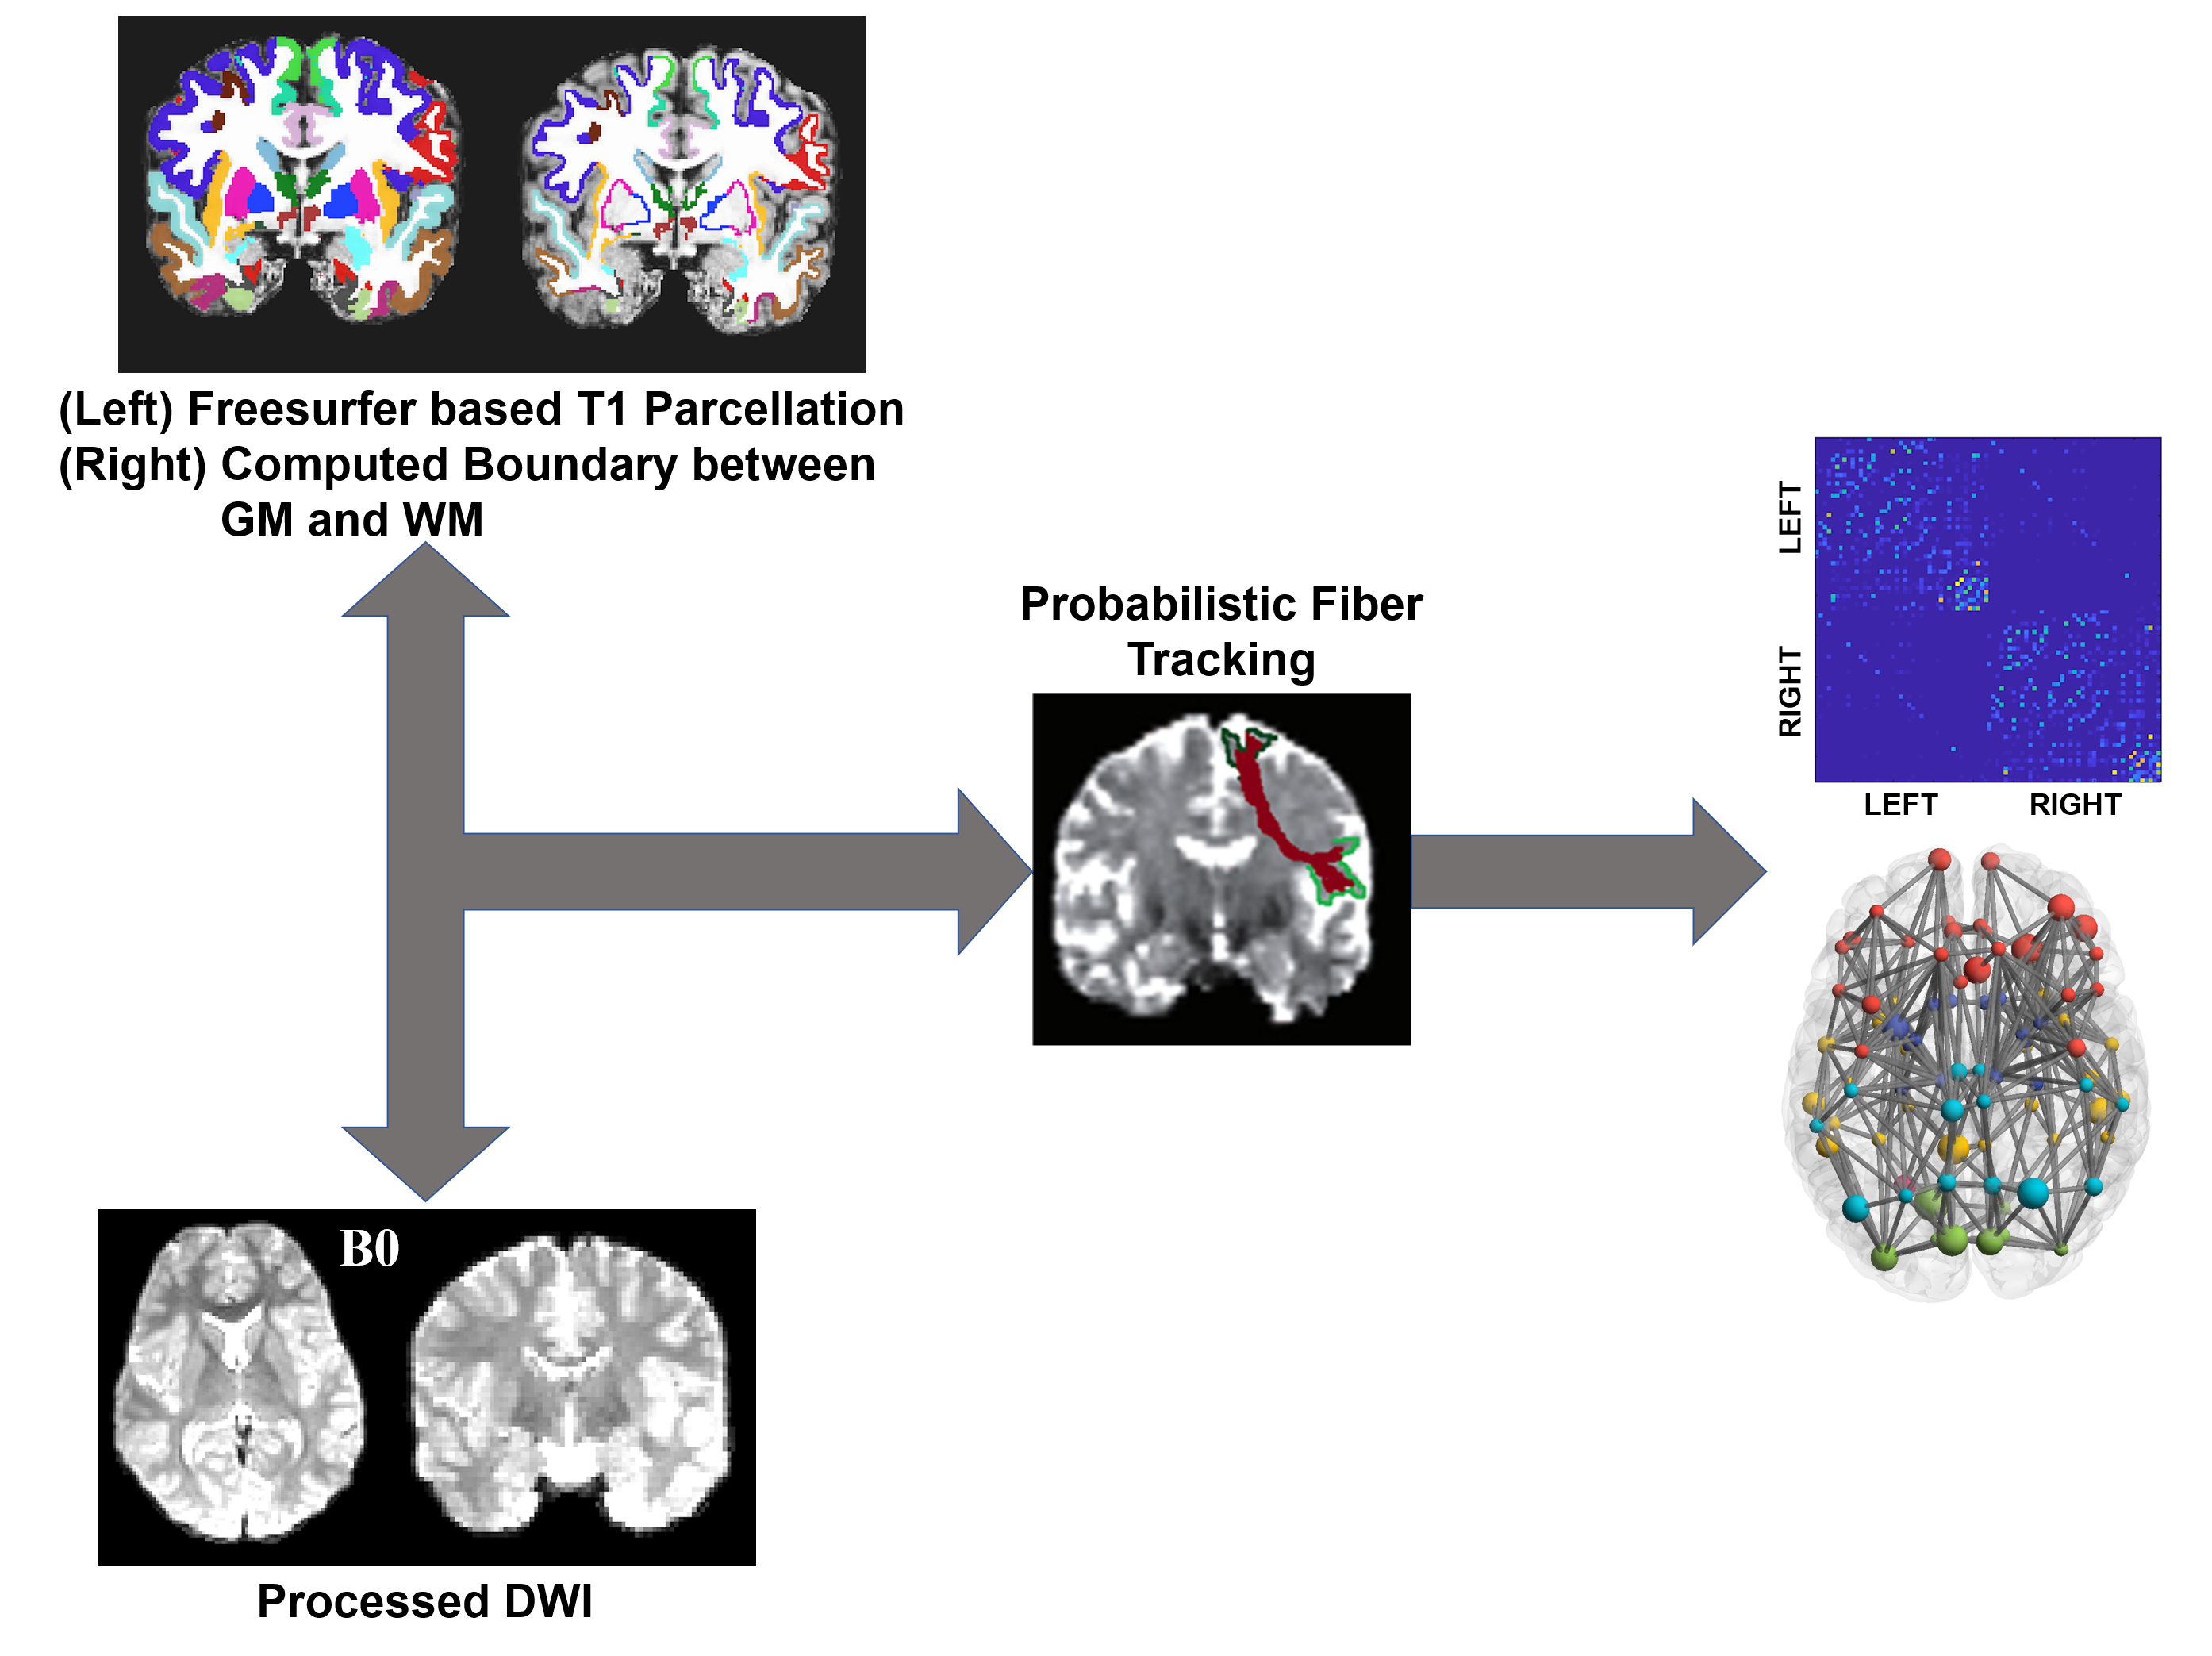
Figure 1: Method for construction of Structural Connectome
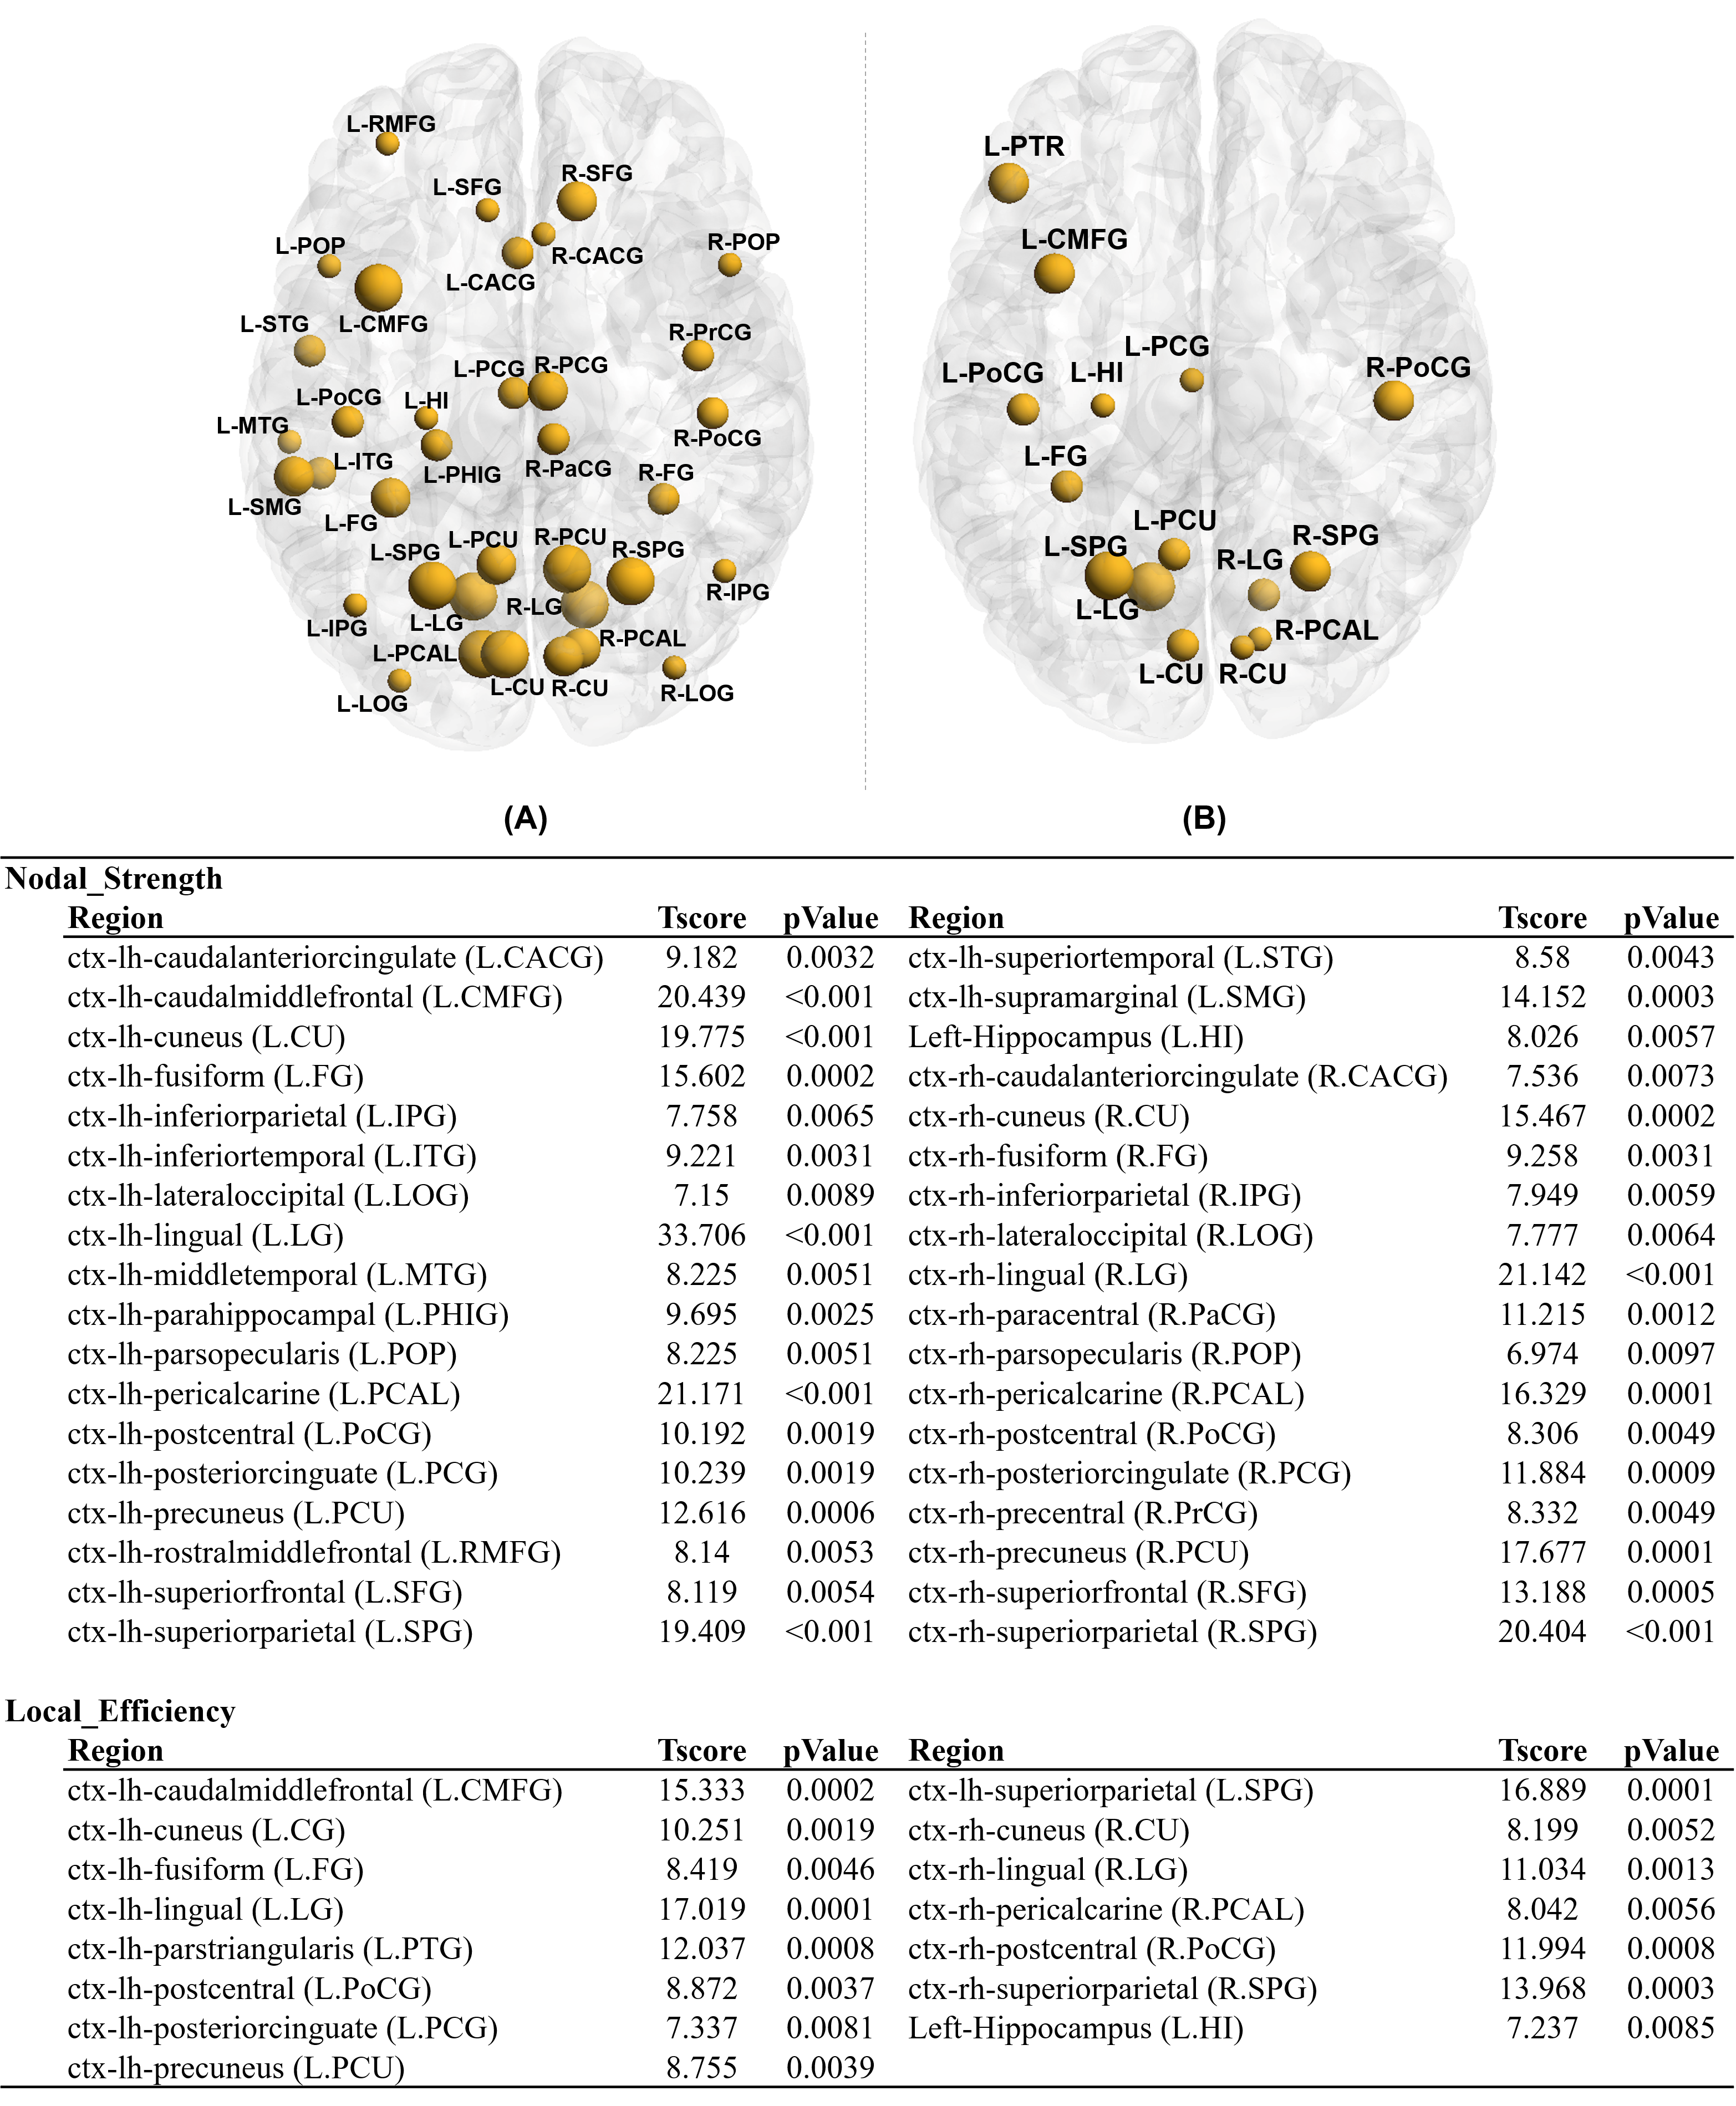
Figure 2:
Nodal
analysis results for HC vs. all-DMD. (A) strength of node(NS), (B)
Local efficiency(LE) were significantly higher in HC compare to
all-DMD
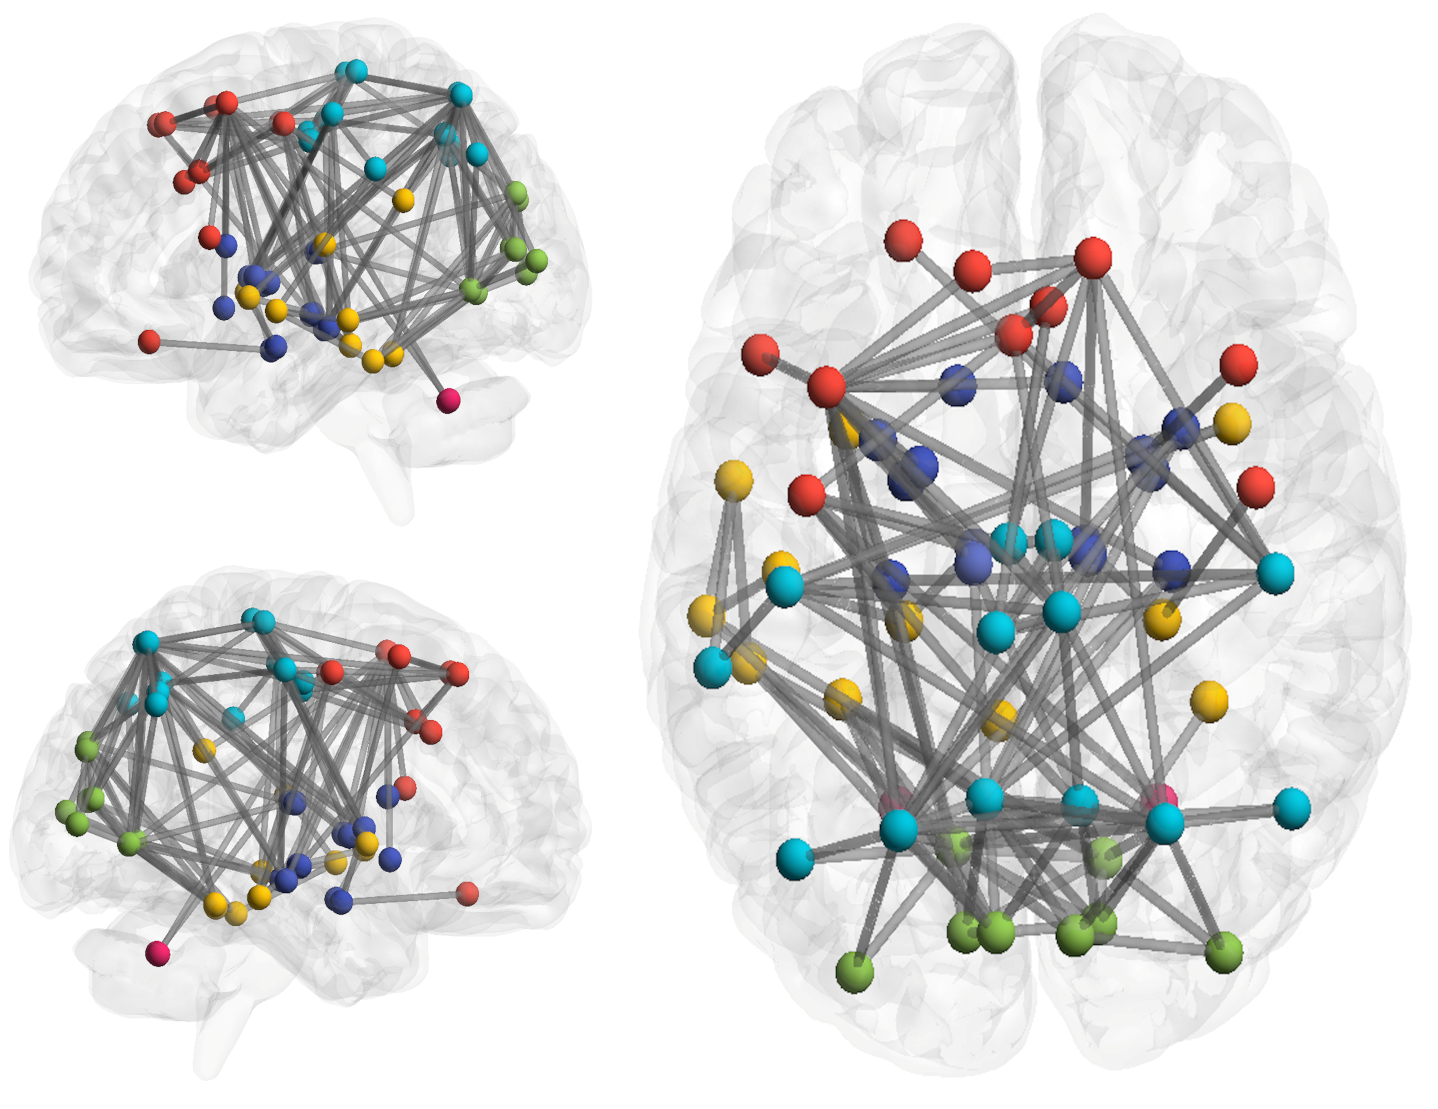
Figure 3
: Ede-wise Analysis Result for HC vs. all-DMD.
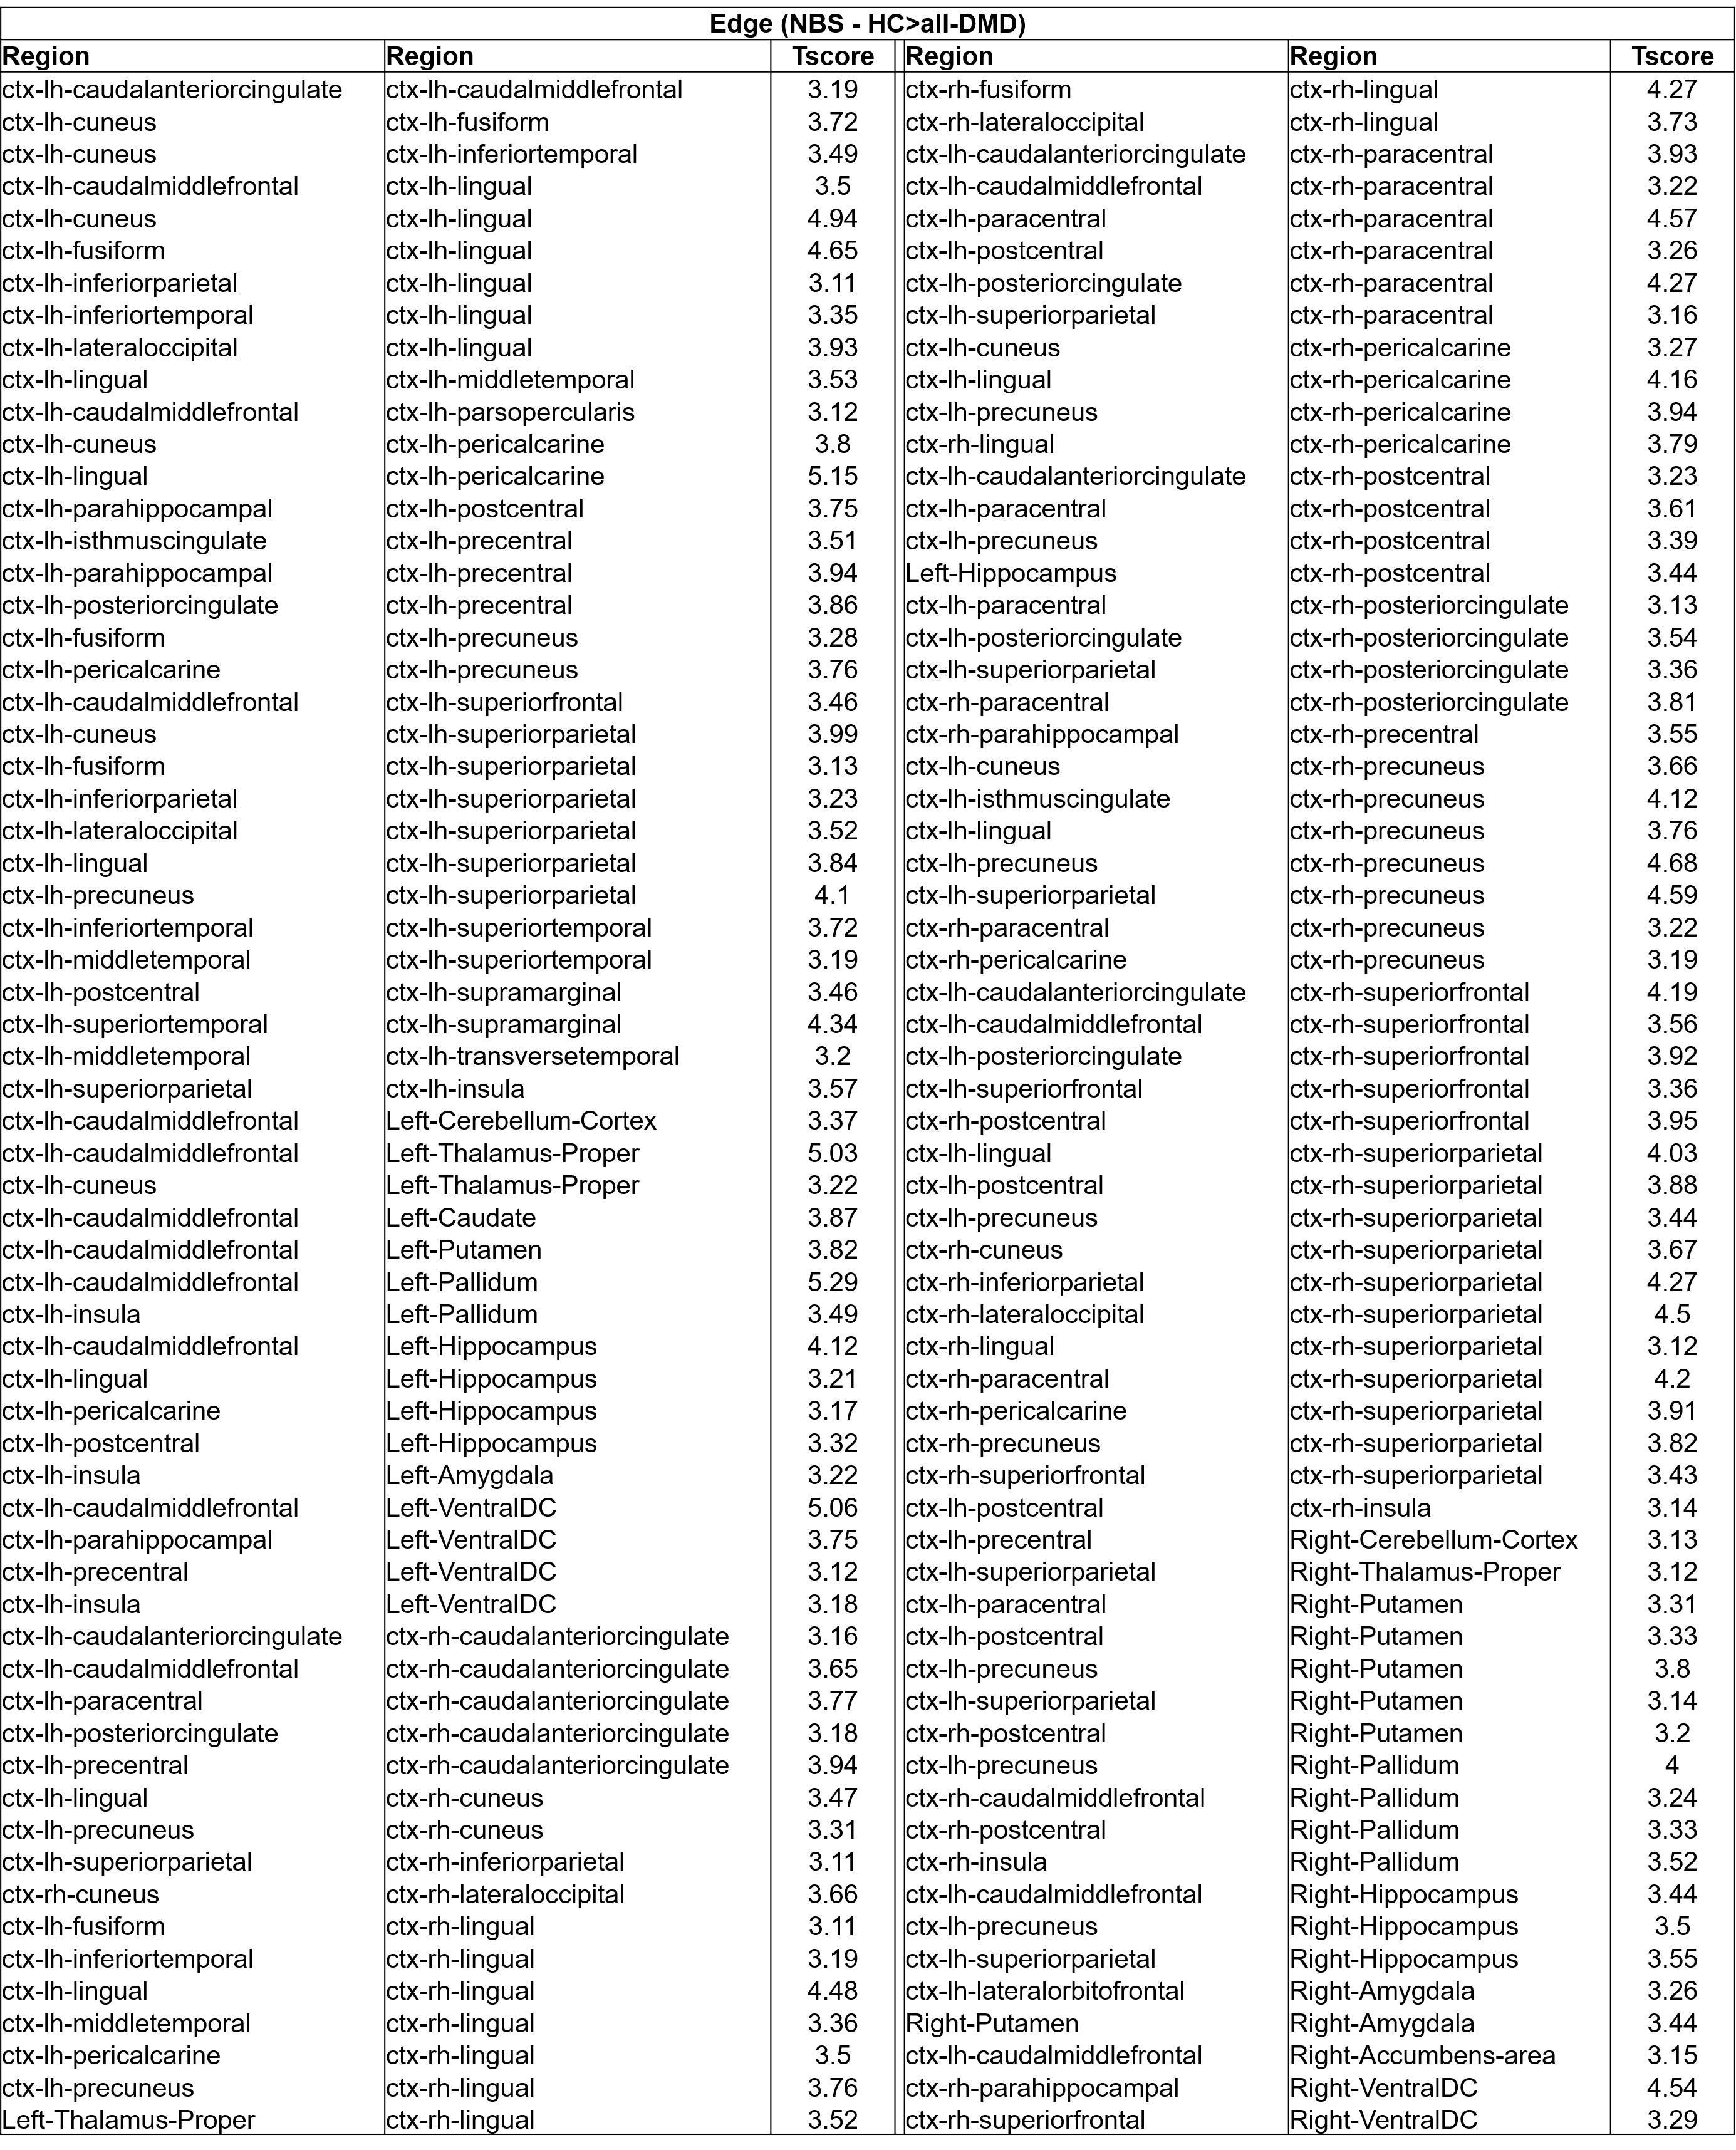
Table
1 : Edgewise NBS analysis for HC vs. all-DMD (128 edges)
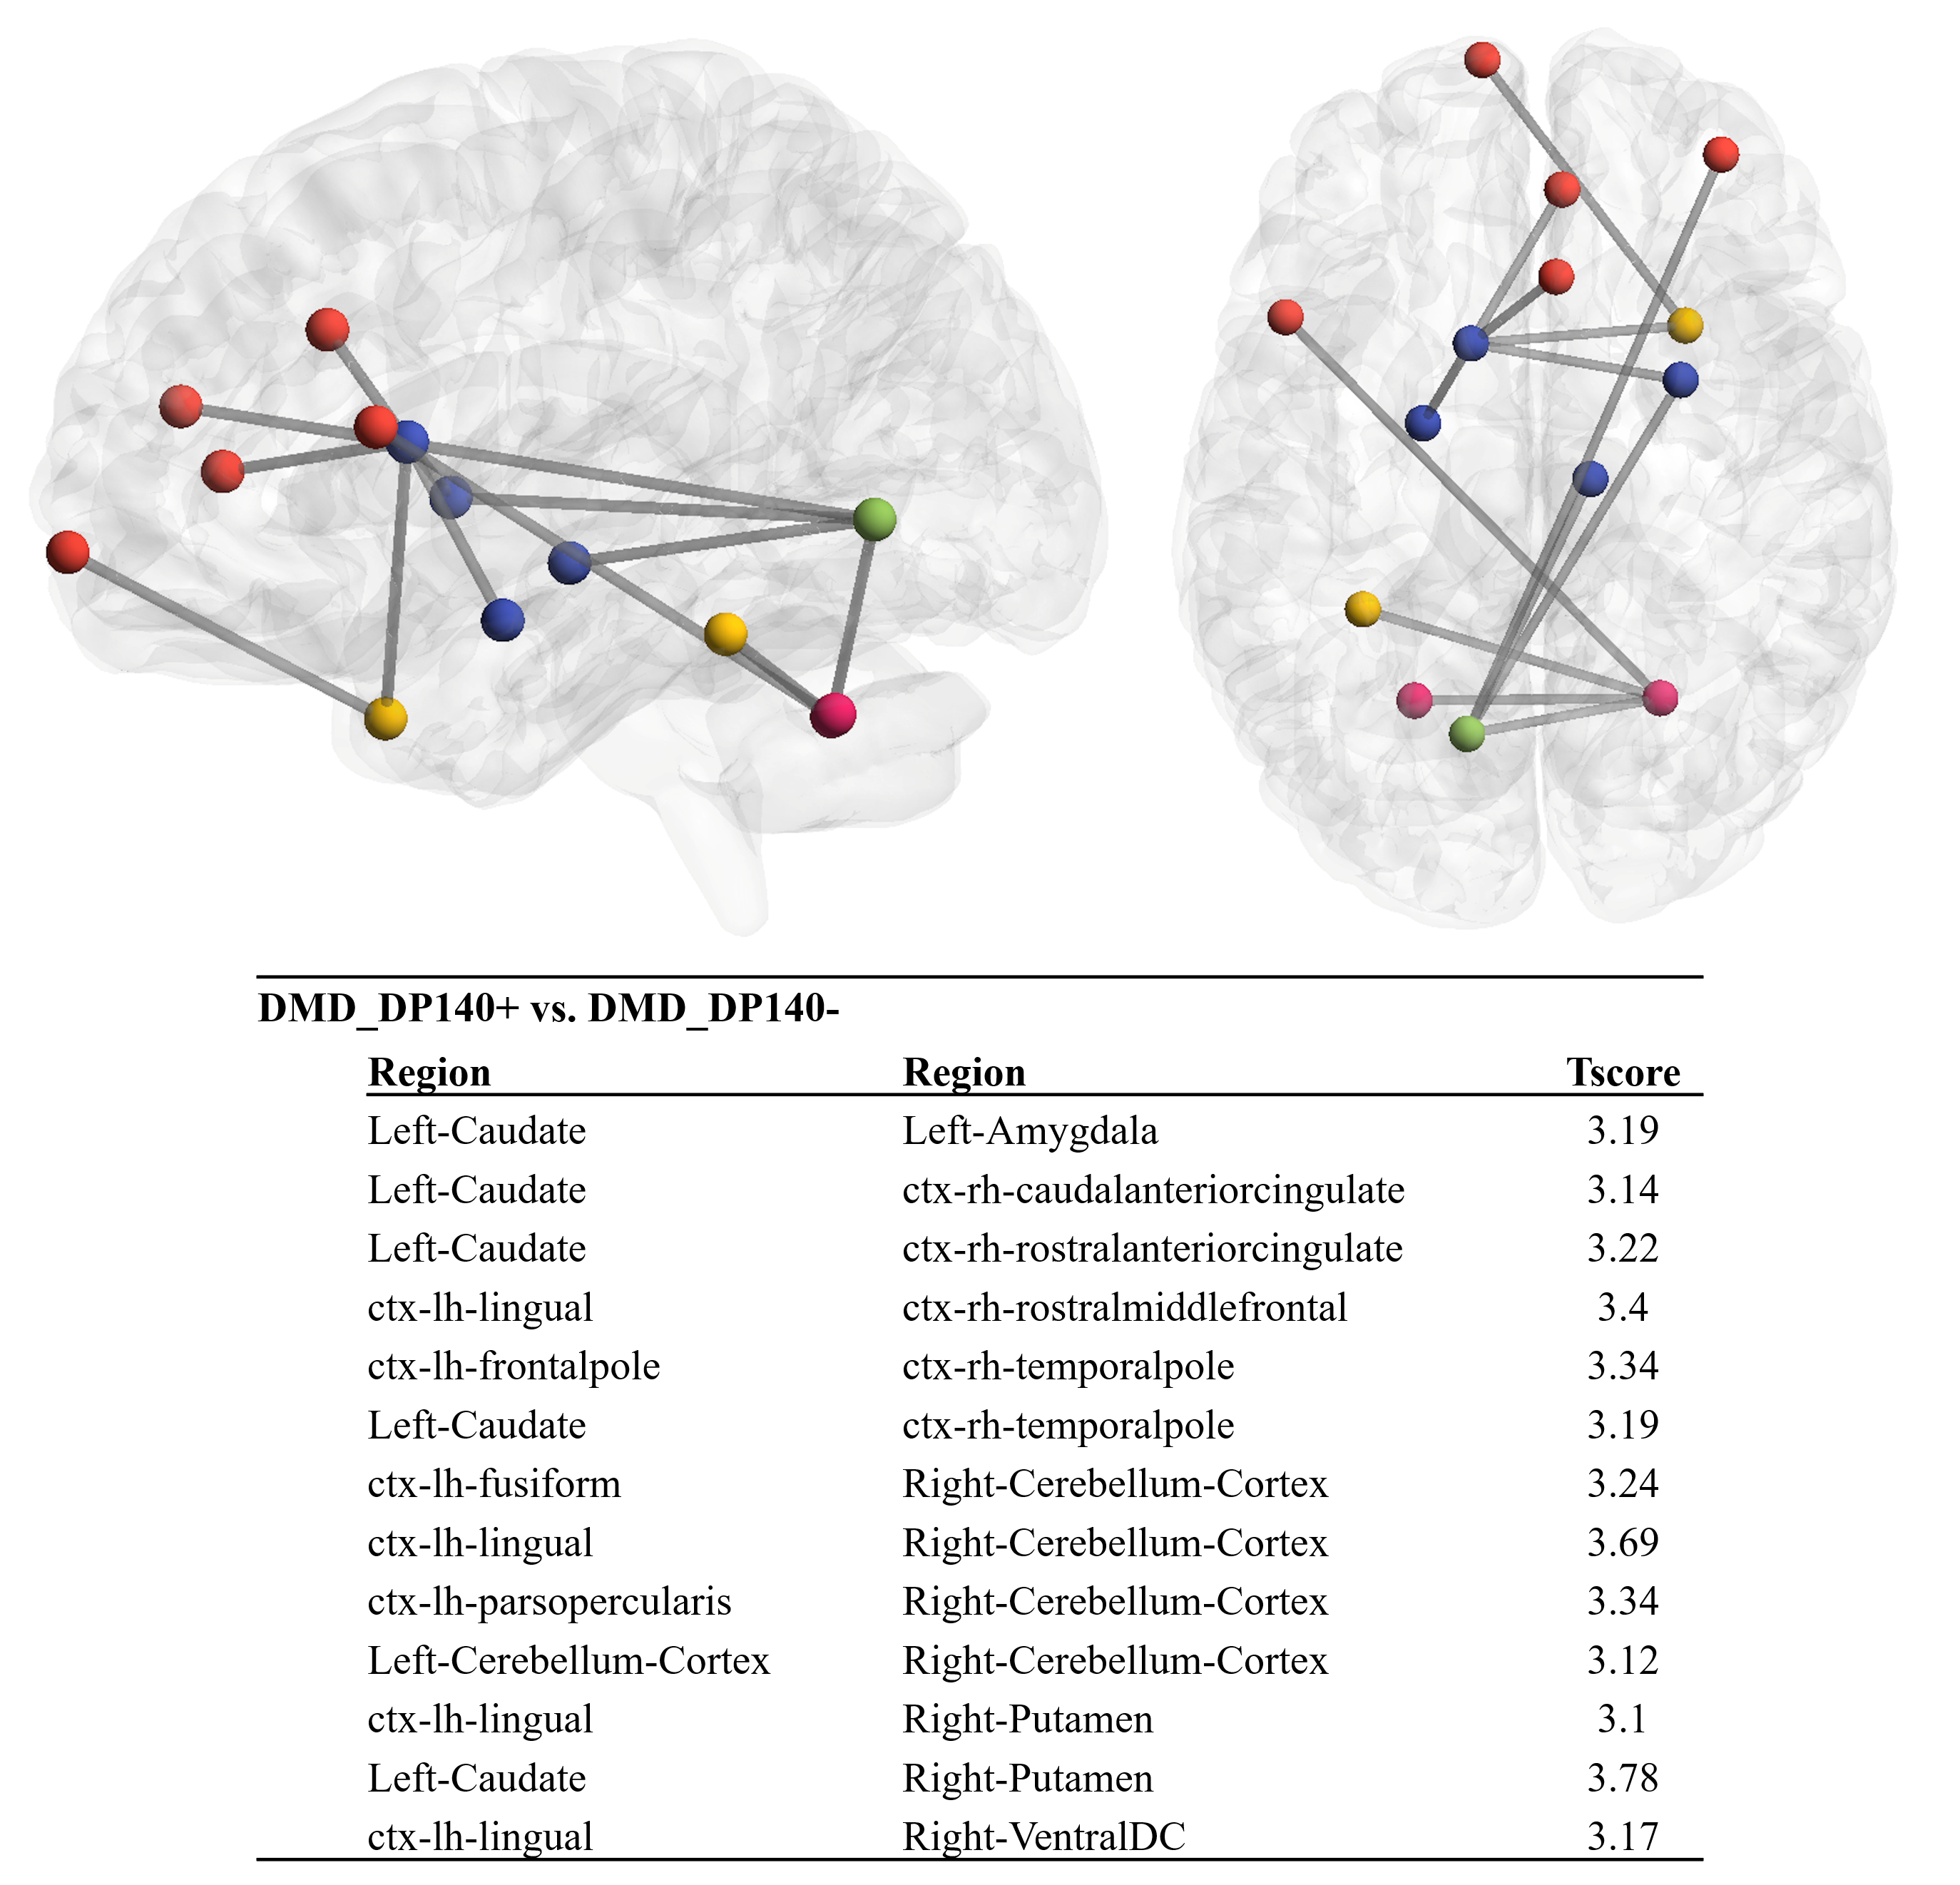
Figure 4 : Edgewise NBS analysis for DMD_Dp140+
vs. DMD_DP140- (13 Edges)