0080
Deriving survival risk features using multi-parametric MRI in paediatric neuro-oncological disease: a multi-centre clinical study.
James Timothy Grist1, Stephanie Timothy Withey1, Lesley MacPherson2, Adam Oates3, Stephen Timothy Powell1, Jan Novak4, Laurence Abernethy5, Barry Pizer6, Ricahrd Grundy7, Simon Bailey8, Dipayan Mitra8, Theodoros N Arvantis9, Dorothee P. Auer7, and Andrew C Peet1
1University of Birmingham, Birmingham, United Kingdom, 2Birmingham Women's and CHildren's NHS foundation trust, Birmingham, United Kingdom, 3Birmingham Women's and Children's NHS foundation trust, Birmingham, United Kingdom, 4Aston University, Birmingham, United Kingdom, 5Alder Hey Children's NHS foundation trust, Liverpool, United Kingdom, 6Institute of Translation Medicine, University of Liverpool, Liverpool, United Kingdom, 7University of Nottingham, Nottingham, United Kingdom, 8Royal Victoria Infirmary, Newcastle, United Kingdom, 9University of Warwick, Warwick, United Kingdom
1University of Birmingham, Birmingham, United Kingdom, 2Birmingham Women's and CHildren's NHS foundation trust, Birmingham, United Kingdom, 3Birmingham Women's and Children's NHS foundation trust, Birmingham, United Kingdom, 4Aston University, Birmingham, United Kingdom, 5Alder Hey Children's NHS foundation trust, Liverpool, United Kingdom, 6Institute of Translation Medicine, University of Liverpool, Liverpool, United Kingdom, 7University of Nottingham, Nottingham, United Kingdom, 8Royal Victoria Infirmary, Newcastle, United Kingdom, 9University of Warwick, Warwick, United Kingdom
Synopsis
This study focuses on the combination of diffusion and perfusion imaging with advanced machine learning to predict survival in a cohort of paediatric brain tumours. Results show two novel subgroups with significantly different survival. These results will aid in clinical decision making and therapeutic studies.
Introduction
Introduction Brain tumours are the largest cause of mortality in the paediatric oncological population, with a variable survival rate dependant on tumour type(1). Many challenges are faced when assessing survival risk factors, and studies focusing on imaging features such as perfusion, a biomarker of angiogenesis – commonly elevated in high grade tumours, or diffusion, a marker of cellularity – commonly restricted in high grade tumours, imaging have defined features that show significantly elevated hazard ratios from classical statistical analysis using Cox regression(2,3). In this study we combine both perfusion and diffusion imaging with Bayesian survival analysis coupled with unsupervised machine learning to provide a model that defines two separate clusters of high and low risk tumours in our cohort, with significantly different survival statistics between the two groups.Methods
68 children with a suspected brain tumour were enrolled into this study across 4 clinical sites (Ethics number: 04/MRE0/41, Birmingham Children’s Hospital, Alder Hey, Royal Victoria Infirmary, Nottingham). Tumours varied in grade and type (detailed in Table 1), confirmed by biopsy. Diffusion and perfusion imaging covering the tumour volume were performed in all participants, with imaging parameters shown in table 2.T2 weighted imaging was used to drawn regions of interest outlining the tumour, and mean, standard deviation, kurtosis, and skewness of the whole brain and ROI were calculated in Matlab (2018b The Mathworks, MA) for ADC and perfusion maps. Tumour volume was calculated from the T2 weighted imaging. Iterative Bayesian survival analysis (R, iterativeBMAsurv) were used to determine key imaging features to predict high- and low-risk patients, with subsequent unsupervised clustering (k means) and features then used with supervised learning (Random Forest, AdaBoost, Support Vector Machine, performed in Orange) to predict low/high risk class. Low/high risk clusters were also used for Kaplain-Meier analysis and Cox regression to determine group hazard ratio.
Results
Diffusion and perfusion imaging provide significant features in assessing survivalCox regression revealed perfusion features to have significant Hazard ratios, for example Uncorrected CBV ROI mean (HR = 3.1, Confidence Intervals (CI) = 1.5-6.6, p = 0.003). Bayesian analysis revealed the five most likely features to predict survival (posterior probability, posterior mean coefficient) to be Uncorrected CBV ROI mean (96%, 0.85), K2 ROI mean (39%, -0.17), Uncorrected CBV whole-brain mean (40%, 0.3), tumour volume (27%, 0.05), and ADC ROI kurtosis (20%, 0.02).
Unsupervised clustering detects distinct groups with significantly different survival characteristics
Using the Bayesian imaging features, k means clustering revealed two distinct clusters, shown in figure 1A, which when used with Kaplan-Meier analysis revealed a significant difference between a high and low-risk population (see figure 1B, p = 0.0015). There were a number of significant differences in imaging features between the high and low-risk populations, for example, ADC kurtosis (10.1 ± 5.3 vs 4.3 ± 1.8, p < 0.001) and K2 ROI mean (0.0186 ± 0.008 vs 0.028 ± 0.018 s-1, p = 0.007) as well as there being a mixture of high-and low-grade tumours in both clusters. Full results showing significant high and low-risk features and cluster information are shown in table 3.
Supervised machine learning can be used to distinguish between high/low-risk clusters
Supervised machine learning using imaging features showed that the Bayesian features combined with a neural network, after 10-fold stratified cross-validation, provided the most accurate classification of high/low risk patients (precision = 98%, F-statistic = 0.98). Further combinations of all diffusion and perfusion ROI features with principal component analysis with a neural network yielded similar results (precision = 94%, F-statistic = 0.94) and the addition of tumour volume to the aforementioned did not provide increased precision or F-statistic results. The full classifier results for features combinations are presented in table 4.
Discussion
This study has demonstrated the potential for using functional imaging to assess for novel survival populations in a mixed pediatric brain tumour cohort. Here we have demonstrated a novel sub-class of brain tumours which demonstrate significantly lower survival probability, and may present an opportunity for targeted therapeutic intervention and research study recruitment. Indeed, the high-risk cohort had a number of high-grade survivors present which either lack long term follow-up or, more interestingly, were low-grade and had imaging features more akin to high-grade tumours.This work represents a novel step forward in the understanding of survival in paediatric brain tumours, with potential to be expanded through the addition of ASL derived perfusion imaging or spectroscopic data.
Acknowledgements
We would like to acknowledge funding from the Cancer Research UK and EPSRC Cancer Imaging Programme at the Children’s Cancer and Leukaemia Group (CCLG) in association with the MRC and Department of Health (England) (C7809/A10342), the Cancer Research UK and NIHR Experimental Cancer Medicine Centre Paediatric Network (C8232/A25261), the Medical Research Council – Health Data Research UK Substantive Site and Help Harry Help Others charity. Professor Peet is funded through an NIHR Research Professorship, NIHR-RP-R2-12-019. Stephen Powell gratefully acknowledges financial support from EPSRC through a studentship from the Physical Sciences for Health Centre for Doctoral Training (EP/L016346/1). Theodoros Arvanitis is partially funded by the MRC (HDR UK). We would also like to acknowledge the MR radiographers at Birmingham Children’s Hospital, Alder Hey Children’s Hospital, the Royal Victoria Infirmary in Newcastle and Nottingham Children’s Hospital for scanning the patients in this study. We would also like to thank Selene Rowe at Nottingham University Hospitals NHS Trust for help with gaining MRI protocol information. Dr James Grist is funded by the Little Princess Trust (CCLGA 2017 15).References
1. NCRA. Childhood Cancer Statistics, England Annual report 2018. Public Heal. Engl. 2018.
2. Zhang J. Multivariate Analysis in Pediatric Brain Tumor. 2017;2.
3. Hales PW, d’Arco F, Cooper J, et al. Arterial spin labelling and diffusion-weighted imaging in paediatric brain tumours. NeuroImage Clin. 2019;22.
Figures
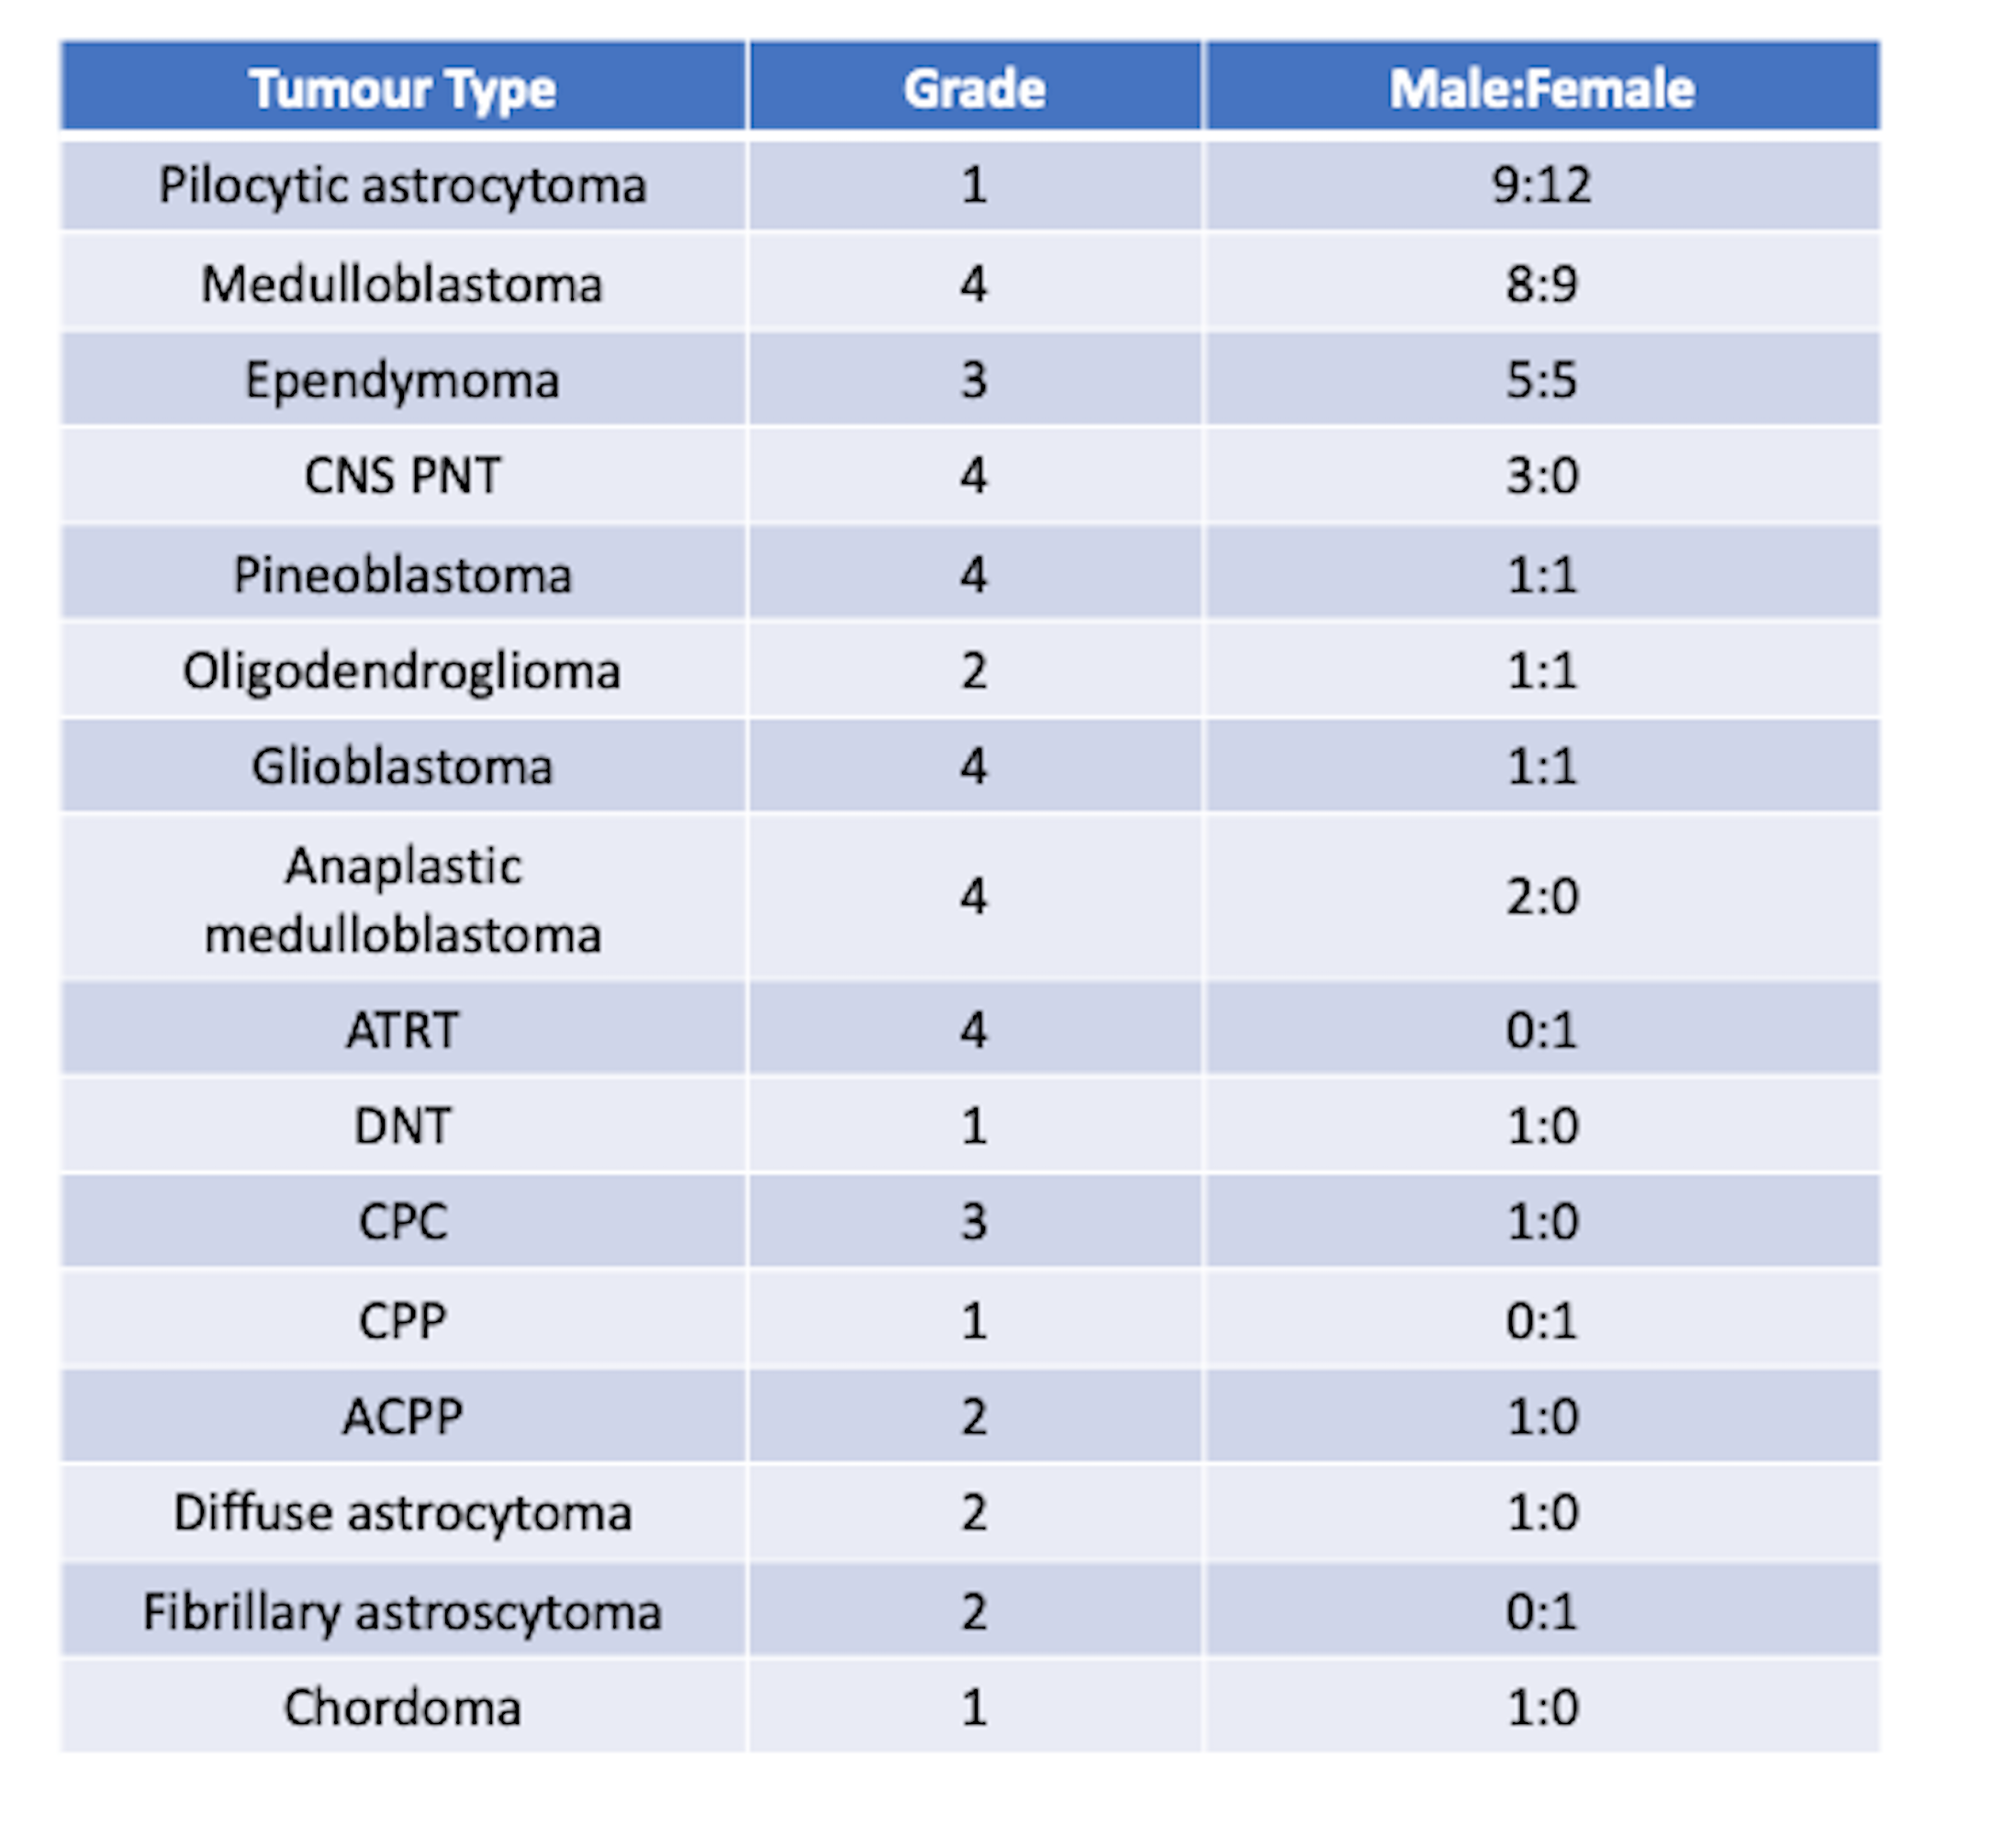
Cohort details
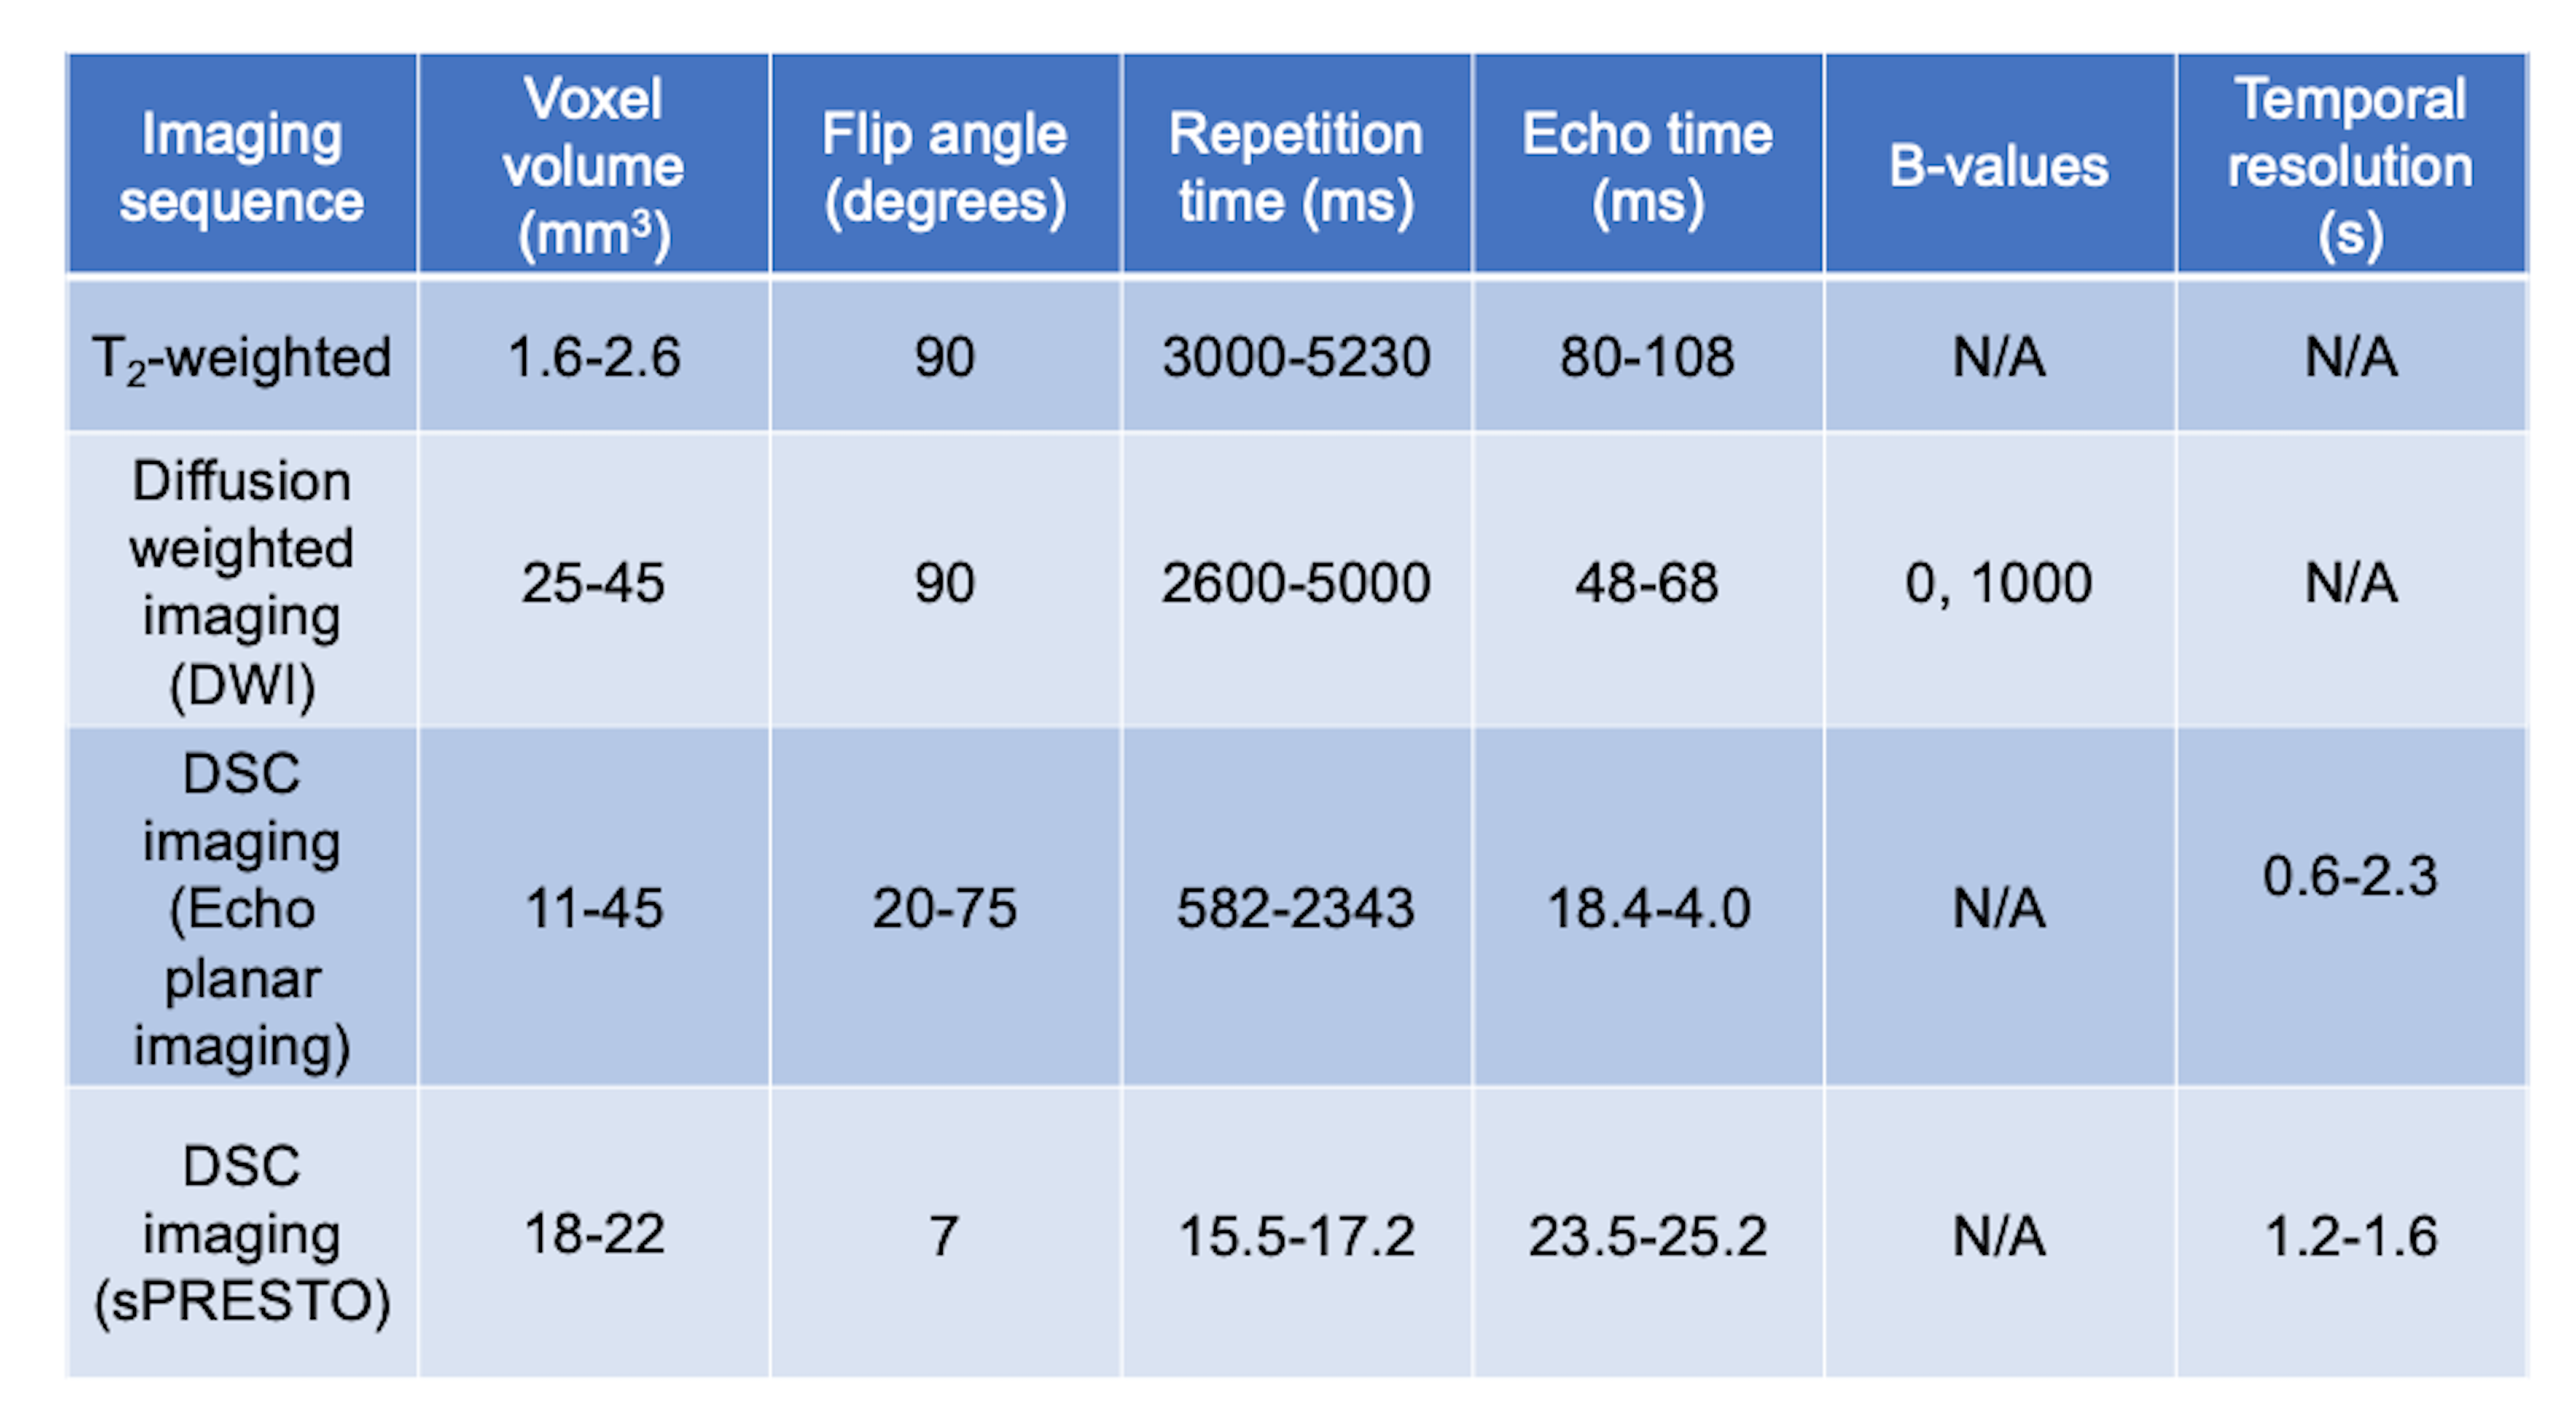
Imaging parameters used in this study.
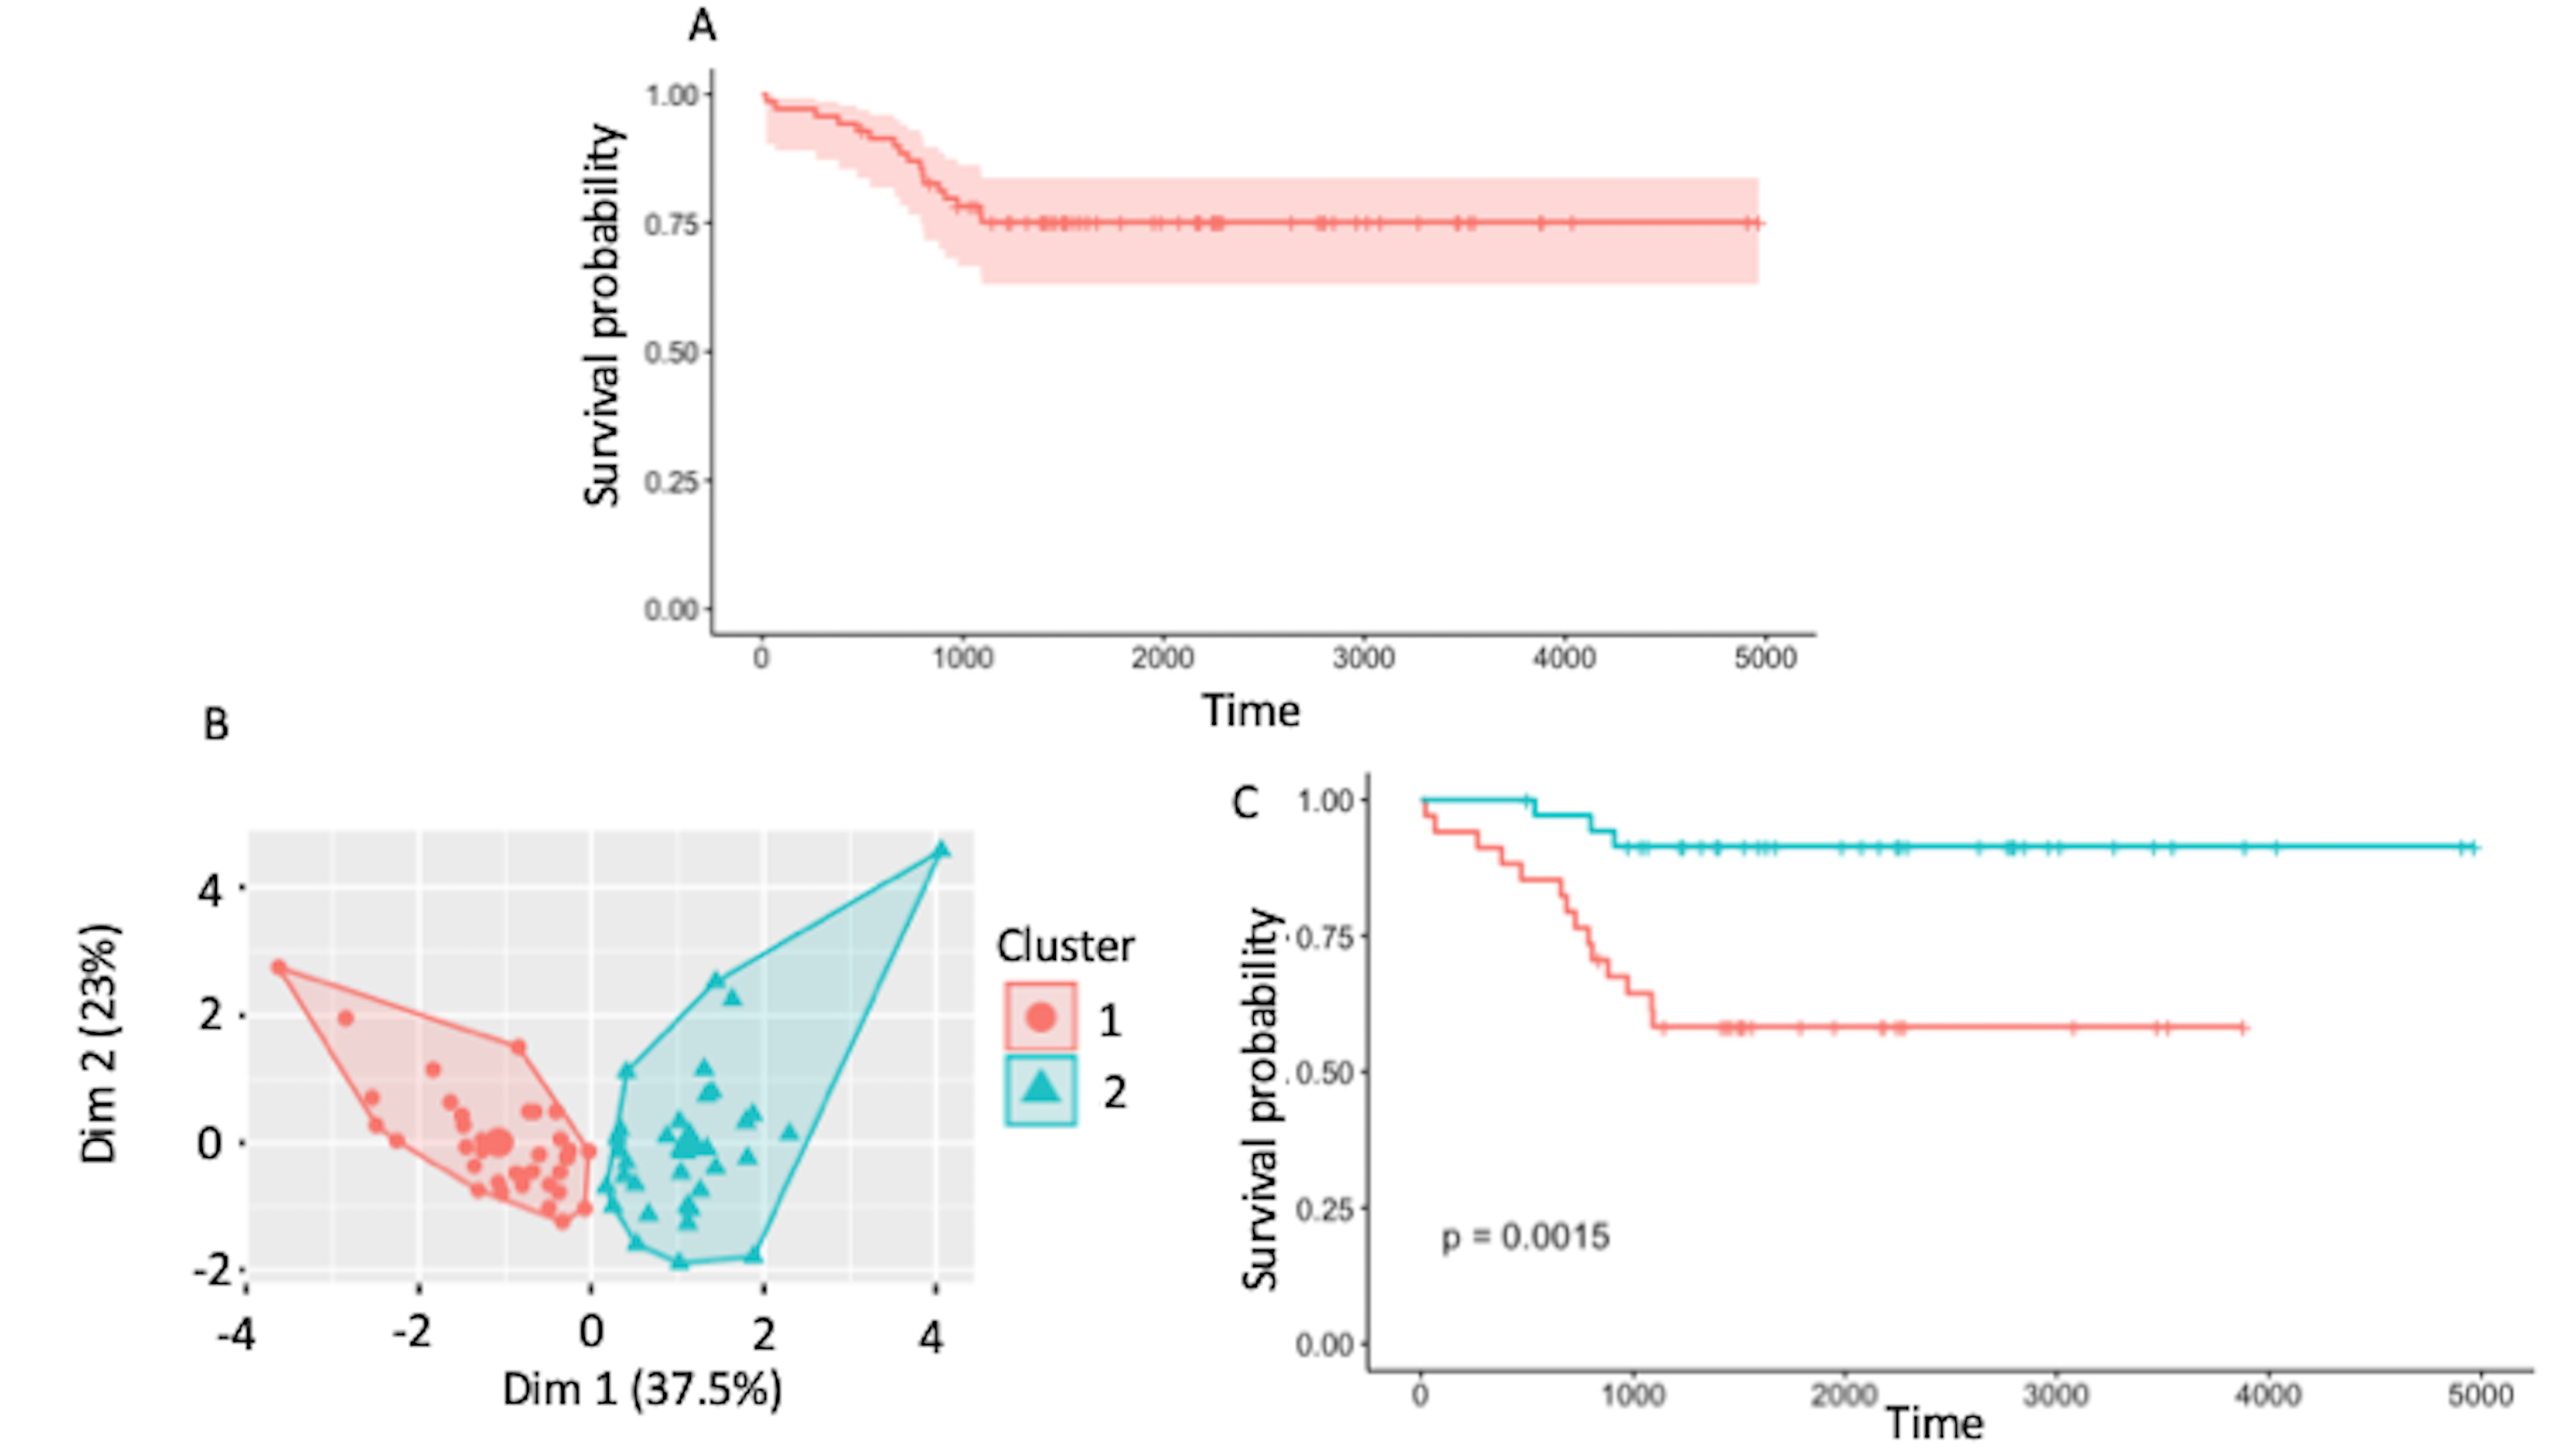
Figure 1 - (A) shows the cohort
survival curve with 75% overall survival. (B) shows k means clustering
revealing two clusters which (C) had significant differences in survival with
Kaplan-Maier analysis.
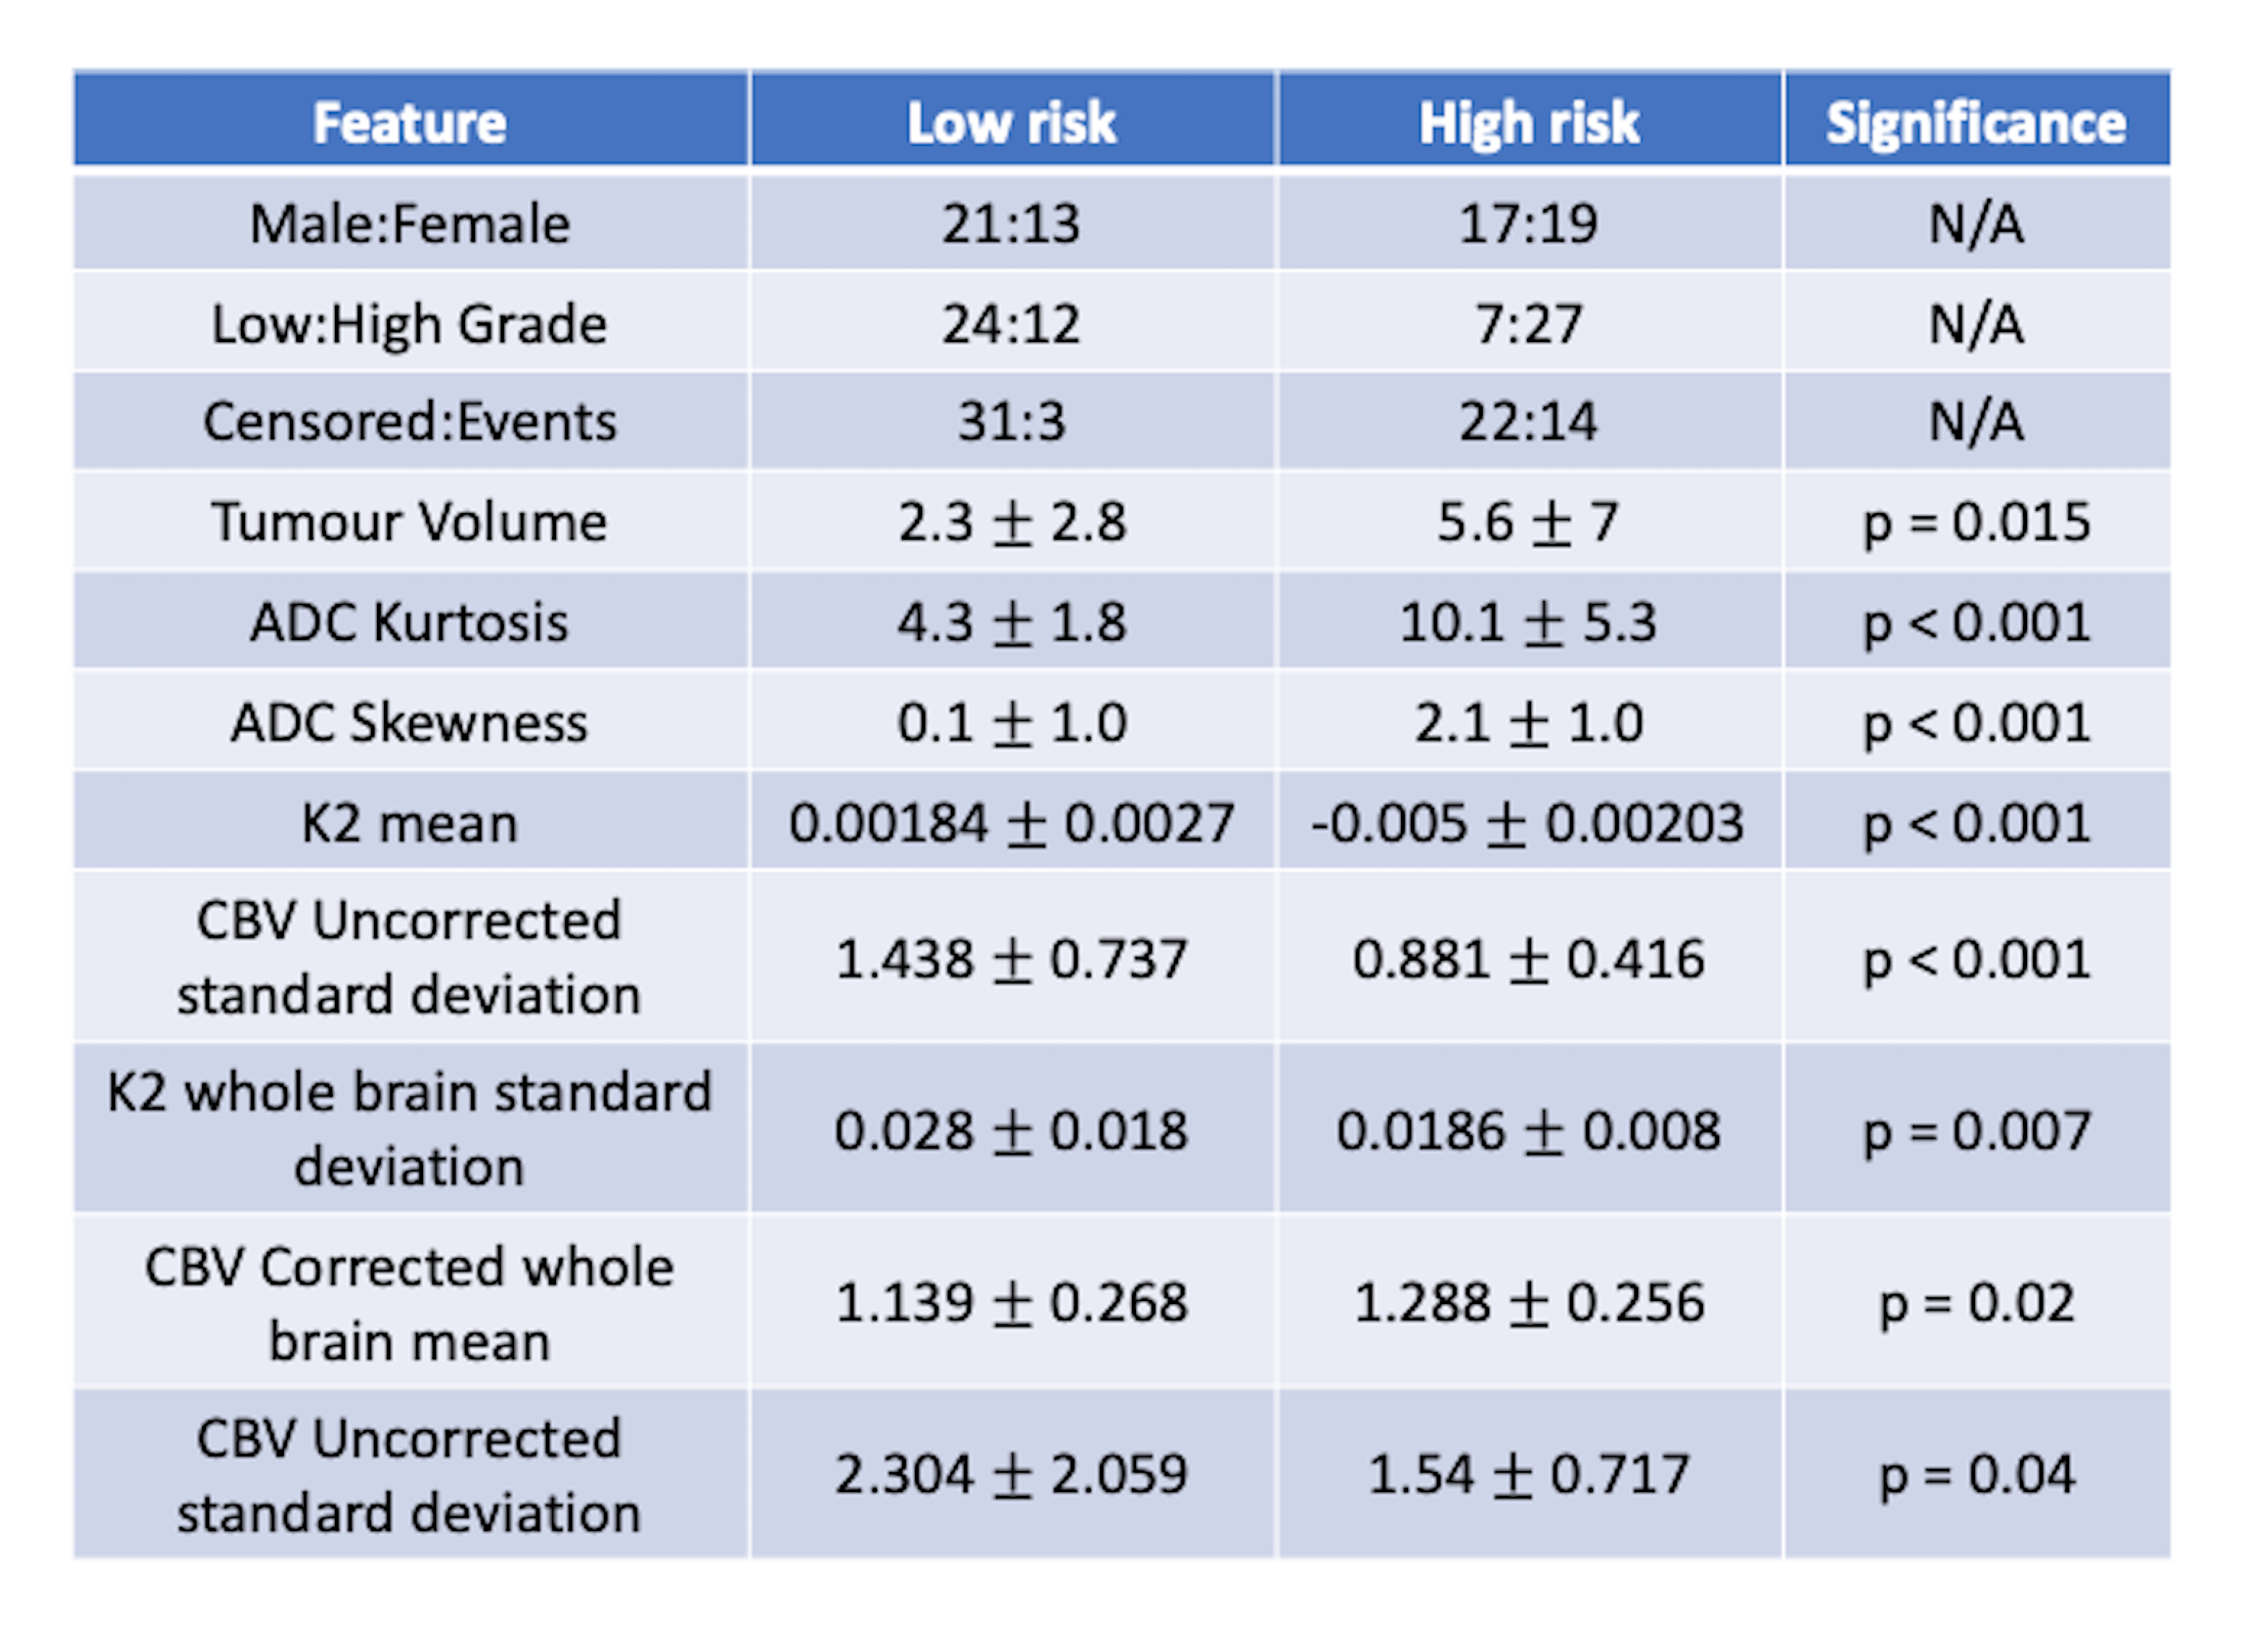
High- and low-risk cluster group
features.
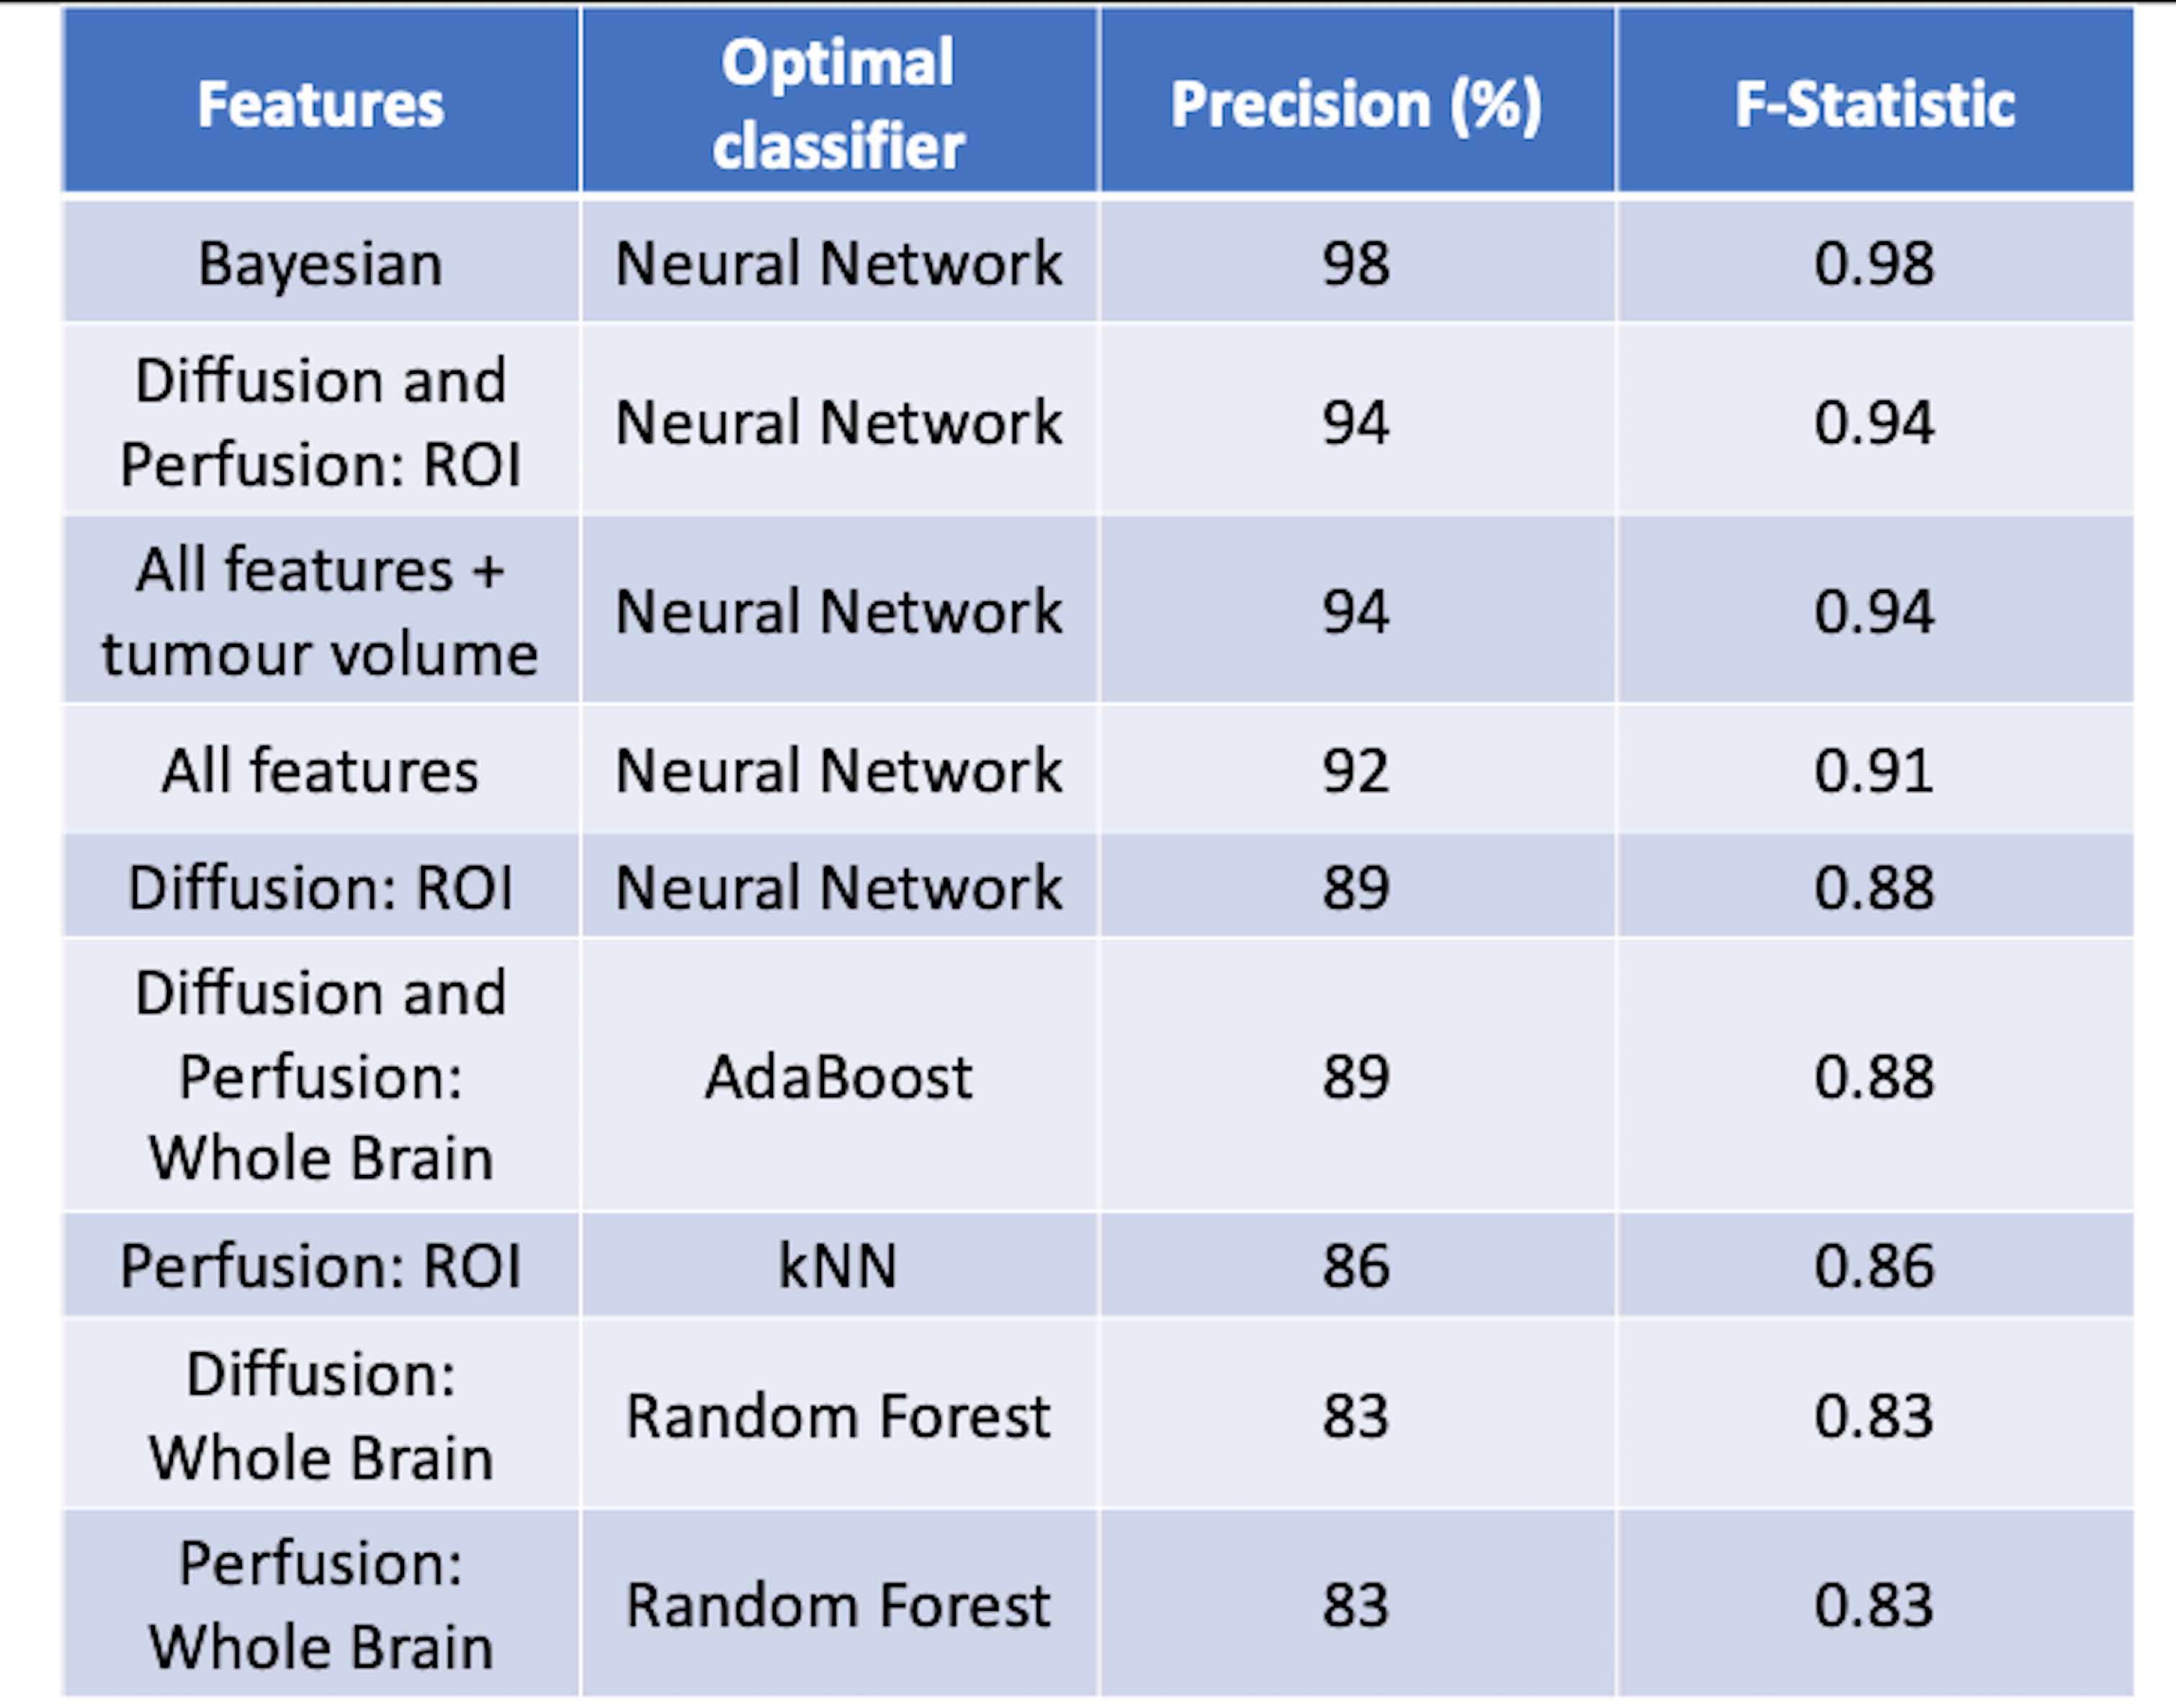
High and low risk supervised learning
results. All features (except Bayesian) used principal component analysis to
reduce dimensionality before supervised learning was performed. kNN
= k nearest-neighbours.