0079
Measuring brain maturation with quantitative MRI1Advanced Clinical Imaging Technology, Siemens Healthcare AG, Lausanne, Switzerland, 2Department of Radiology, Lausanne University Hospital and University of Lausanne, Lausanne, Switzerland, 3LTS5, École Polytechnique Fédérale de Lausanne (EPFL), Lausanne, Switzerland, 4UMR 1253, iBrain, Université de Tours, Inserm, Tours, France, 5Pediatric Radiology Department, Clocheville Hospital, CHRU of Tours, Tours, France, 6SHS DI MR SIP, Siemens Healthcare GmbH, Erlangen, Germany
Synopsis
The sensitivity of T1 mapping towards brain maturation during the first years of life was shown in previous studies. This work investigates whether this sensitivity is high enough that age of young subjects can be directly estimate from T1 relaxometry, which in turn enables to determine the developmental stage of the subject’s brain. A random forest regression was employed to estimate subjects’ age based on median T1 values of different brain regions. Good correlation (r=0.95) was found between actual and predicted ages, and proof-of-concept results in a patient showed the potential of the proposed framework to detect developmental delays.
Introduction
The development of cognitive and motor abilities in infants is associated with the structural and functional remodeling of the brain1,2. Similar patterns of brain developments have been identified, which involve – among others – the myelination of white (WM) and grey matter (GM) tissues, axonal pruning, and an increase in brain size1,3. In particular, developmental delay and other psychiatric disorders were associated with the delayed spatiotemporal maturation of axonal myelination4,5. Hence, a clinical biomarker which is sensitive to this tissue reorganization and maturation would be of help to detect atypical brain development.T1 relaxometry measurements already showed to change rapidly in the first years of life, an effect which was mainly linked to myelination processes6,7. Extending this rationale, this work investigates the possibility to estimate the age of a subject from T1 maps as a quantitative measurement of brain maturation. The predictive power of the different regional T1 values was tested and reported. As proof of concept, the possibility to detect motor developmental delays was investigated in one patient.
Material and Methods
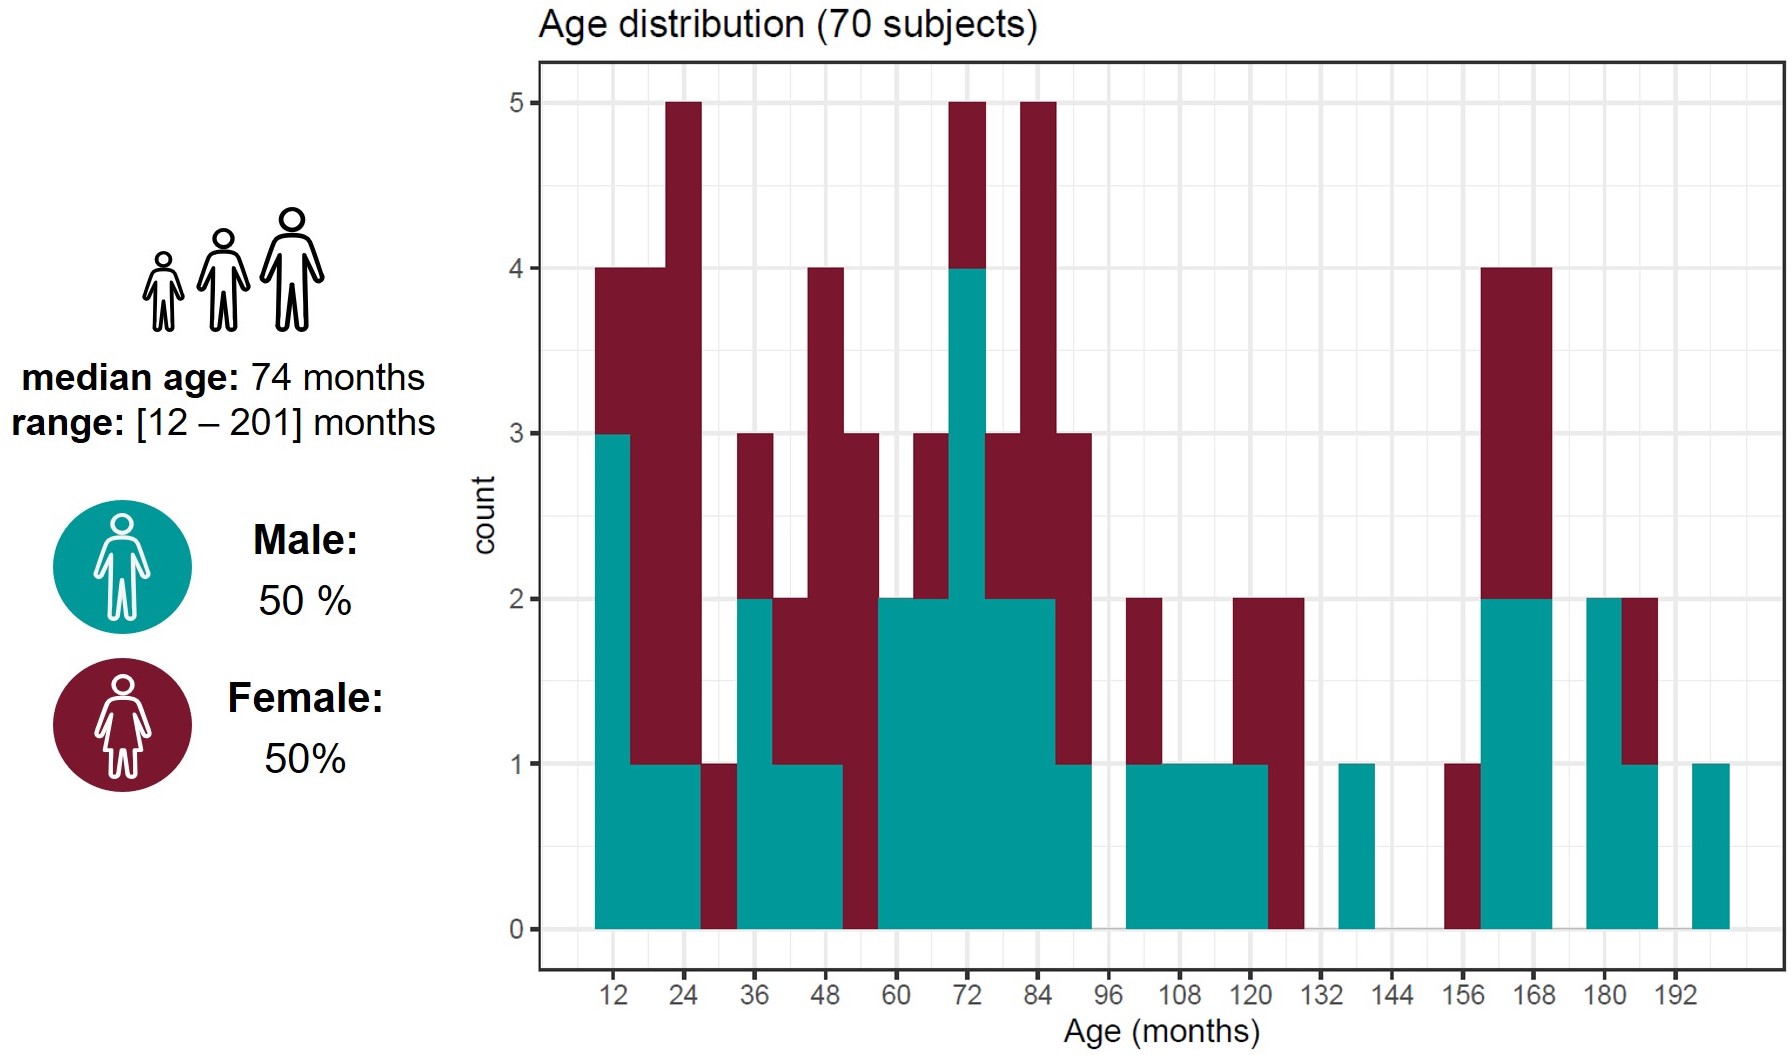
Population: 208 subjects aged from one to sixteen years old were recruited within a two-year prospective study in a university hospital. The study received approval from the local ethics committee (RNI-2017-093). After radiological reading, 70 MRI examinations performed for an isolated mild headache with spontaneously favorable evolution were found to be normal and were considered as healthy subjects in this work (demographics in Figure 1). An additional subject (female, 53 months old) was reported to have a developmental delay of motor abilities and was used for a proof of concept to test whether the predicted age may be younger than the actual age, indicating a delay in brain maturation.Image acquisition and processing: Brain images were acquired at 1.5T (MAGNETOM Aera, Siemens Healthcare, Erlangen, Germany) using a 20-channel head coil without general anesthesia. Whole-brain 3D T1 relaxometry was achieved with the prototype MP2RAGE8 sequence using acquisition parameters tailored to pediatric applications (resolution=1.33x1.33x1.25mm3, FOV=256x240mm2, TI1/TI2=600/2000ms, flip angles=5-6°, TR=5000ms, TA=6:36min). 46 brain regions of interest (ROI) were automatically segmented using an in-house post-processing algorithm specifically designed for this cohort9,10. The median T1 values were calculated for each ROI.
Age estimation: A random forest regression (101 trees, 4 splits at each node) was trained to learn the age of the healthy subjects from the collection of regional T1 values. The performance of the model was evaluated through a leave-one-out cross-validation by iteratively excluding one subject from the training. Accuracy in the predictions was evaluated by computing the Pearson’s correlation coefficient and the mean absolute error (MAE) between the actual and estimated age. The accuracy-based importance of each T1 value was assessed by computing the relative increase in the mean squared error (MSE) of the model accuracy when excluding the investigated variable. After re-training the model with the entire cohort of healthy subjects, the age of the brain (i.e. maturation) was estimated in the patient.
Results
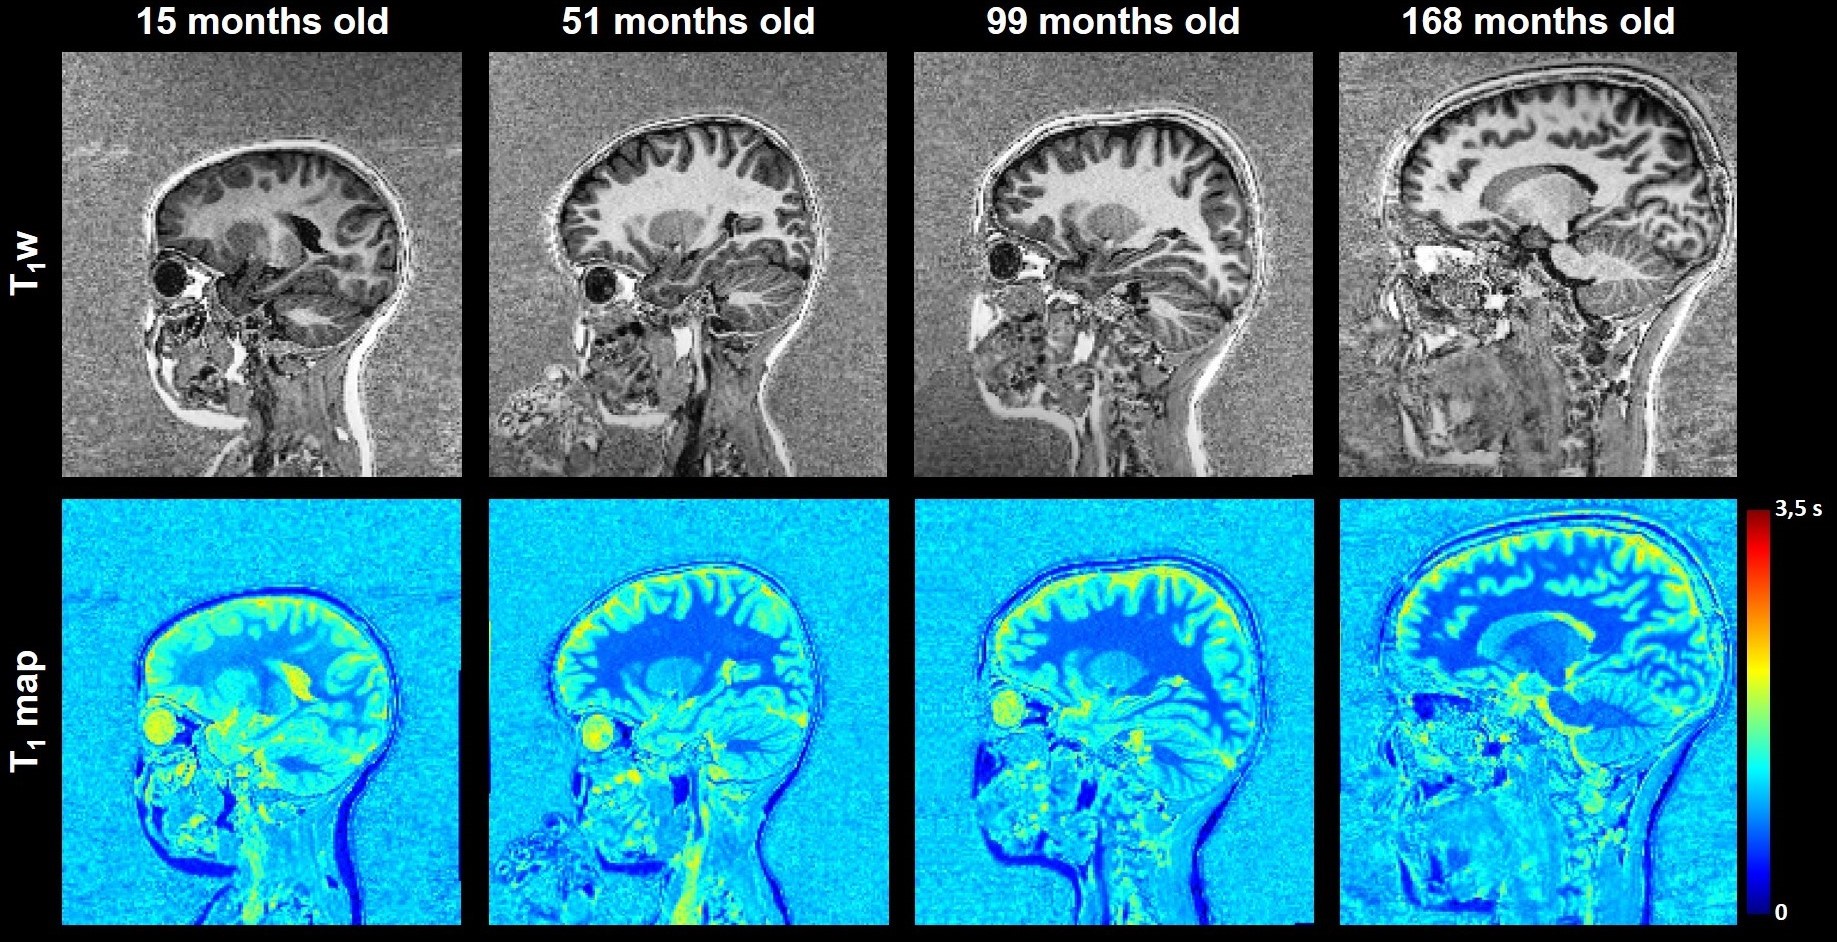
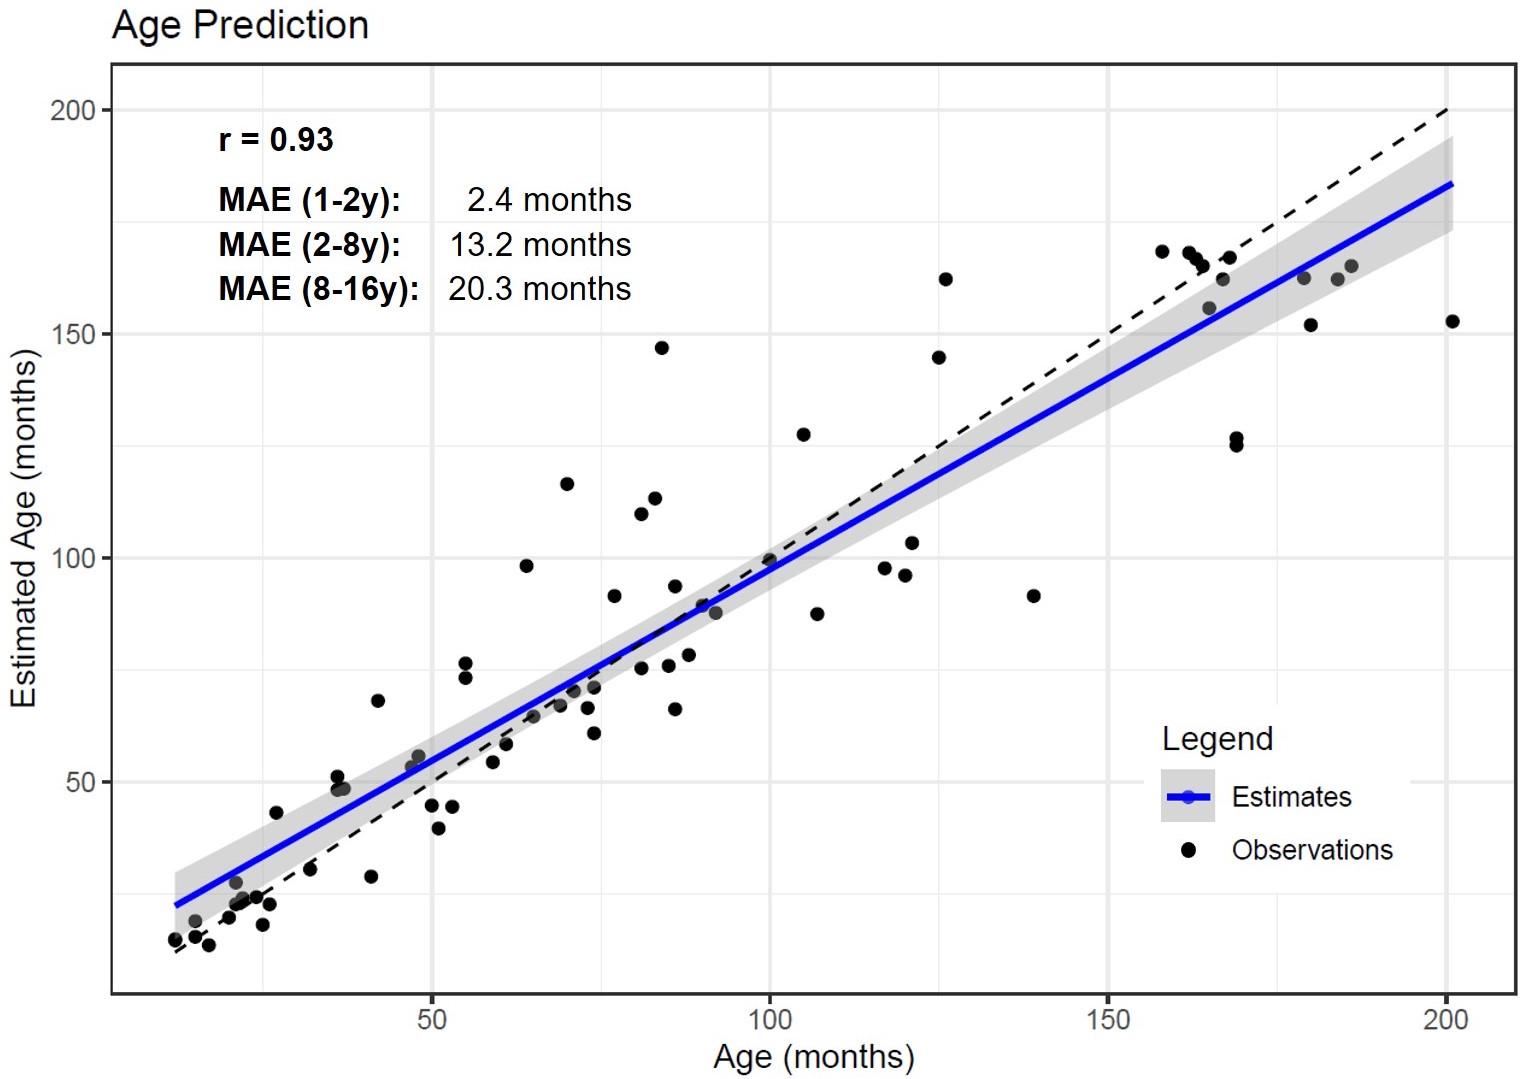
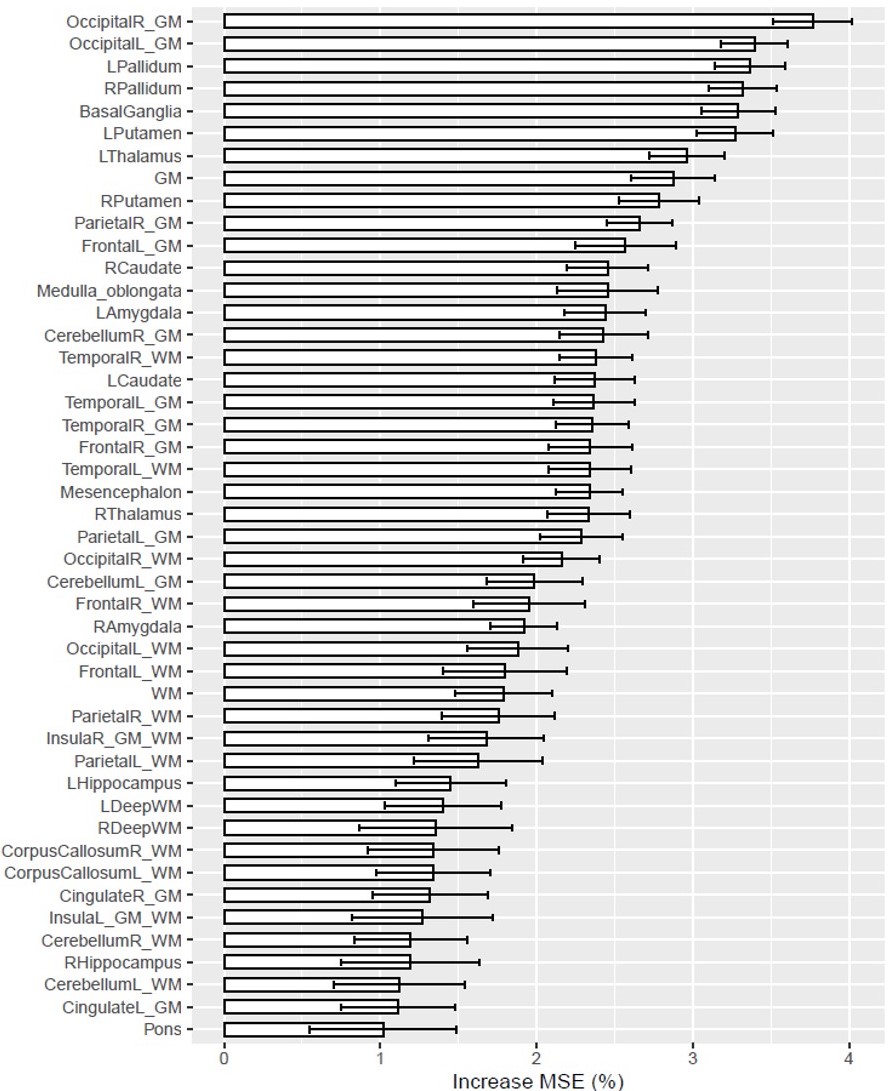
Example images of four healthy subjects with a different age are shown in Figure 2. Estimated brain ages for each subject are reported in Figure 3. A correlation of 0.93 was observed between the predicted and the actual age values. The MAE of the estimations was found to be equal to 2.4 months in the age range between 1 and 2 years, 13.2 months between 2 and 8 years and 20.3 months in subjects older than 8 years. The age is slightly overestimated for younger subjects, while an underestimation is present for children older than 8 years. T1 values in GM structures showed the highest accuracy-based importance, especially in the cortical GM of the occipital lobe, the pallidum, the putamen and the basal ganglia as a whole (Figure 4).The predicted brain age for the enrolled patient of 53 months was found to be 32 months, possibly indicating a developmental delay of 21 months (bigger than the MAE of 13.2 months in the age range of the patient).
Discussion
This work introduces the use of T1 relaxation times in the estimation of age to quantify brain maturation with a random forest regression model. Agreement was assessed between predicted and actual age (r=0.95). The MAE in the estimation was found to be smaller in younger subjects, likely because T1 values change more rapidly in the first years of life6. Notably, T1 values in GM regions were found to have more predictive power than those in WM, supposedly indicating that the neuronal reorganization of the cortex is a continuous progress during healthy maturation, which is reflected in the T1 values.A smaller brain age was predicted for the patient with a delay in the development of motor abilities, demonstrating a potential application of these findings. The predicted age difference exceeds the MAE and can be thus considered relevant. Nonetheless, the possibility of further reducing the MAE should be investigated in the future, for instance using deep learning methods previously explored in adults11.
Conclusion
The potential of T1 relaxometry as biomarker for brain maturation was demonstrated. The proposed model and analysis could be useful in complementing the complex – and often only qualitative – assessment and interpretation of pediatric brain images.Acknowledgements
No acknowledgement found.References
1. Johnson MH, Munakata Y. Processes of change in brain and cognitive development. In: Trends in Cognitive Sciences. Vol 9. Elsevier Ltd; 2005:152-158.
2. Hadders-Algra M. Early brain damage and the development of motor behavior in children: Clues for therapeutic intervention? Neural Plast. 2001;8(1-2):31-49.
3. Toga AW, Thompson PM, Sowell ER. Mapping brain maturation. Trends Neurosci. 2006;29(3):148-159.
4. Pujol J, López-Sala A, Sebastián-Gallés N, et al. Delayed myelination in children with developmental delay detected by volumetric MRI. Neuroimage. 2004;22(2):897-903.
5. Wolff JJ, Gu H, Gerig G, et al. Differences in white matter fiber tract development present from 6 to 24 months in infants with autism. Am J Psychiatry. 2012;169(6):589-600.
6. Chen Y, Chen MH, Baluyot KR, Potts TM, Jimenez J, Lin W. MR fingerprinting enables quantitative measures of brain tissue relaxation times and myelin water fraction in the first five years of life. Neuroimage. 2019;186:782-793.
7. Eminian S, Hajdu SD, Meuli RA, Maeder P, Hagmann P. Rapid high resolution T1 mapping as a marker of brain development: Normative ranges in key regions of interest. PLoS One. 2018;13(6).
8. Marques JP, Kober T, Krueger G, van der Zwaag W, Van de Moortele P-F, Gruetter R. MP2RAGE, a self bias-field corrected sequence for improved segmentation and T1-mapping at high field. Neuroimage. 2010;49(2):1271-1281.
9. Schmitter D, Roche A, Maréchal B, et al. An evaluation of volume-based morphometry for prediction of mild cognitive impairment and Alzheimer’s disease. NeuroImage Clin. 2015;7:7-17.
10. Maréchal B, Piredda GF, Hilbert T, et al. Simultaneous micro- and macrostructural assessment of normal brain development. Submitted in parallel to the Annual Meeting of ISMRM 2020.
11. Cole JH, Poudel RPK, Tsagkrasoulis D, et al. Predicting brain age with deep learning from raw imaging data results in a reliable and heritable biomarker. Neuroimage. 2017;163:115-124.
Figures