0078
Evaluation of brain MRI quality in natural sleep vs anaesthesia in infants within 6 months of life.1Laboratory of Medical Physics and Magnetic Resonance, IRCCS Stella Maris Foundation, Pisa, Italy, 2Department of Developmental Neuroscience, IRCCS Stella Maris Foundation, Pisa, Italy, 3Department of Clinical and Experimental Medicine, University of Pisa, Pisa, Italy
Synopsis
Natural sleep brain MRI (nsMRI) up to 6 months of life to support early diagnosis in term and preterm infants at high risk for cerebral palsy and other developmental disorders is still far from clinical practice, due to unproven feasibility and quality. We extracted some measures of quality (signal to noise ratio, contrast to noise ratio in a cohort of 23 and 53 infants who underwent sedation or natural sleep brain MR respectively. Most of the quality measures extracted across different MR modalities did not differ between nsMRI and sedation MRI (sMRI) suggesting the feasibility of nsMRI at younger ages.
INTRODUCTION
Brain MRI has been recently described as the recommended neuroimaging technique to support early diagnosis and prognosis of cerebral palsy in term and preterm infants at high-risk for adverse outcome1,2, with possible extension to all suspected congenital neurological disorders involving the brain However, motionless MRI is challenging and very often obtained by sedation, whose safety in such a young population is still a matter of debate3,4. We aim at evaluating the quality of natural sleep brain MRI imaging (nsMRI) extended up to 6 months of life in a clinical setting, in comparison to “standard” sedation MRI (sMRI).METHODS
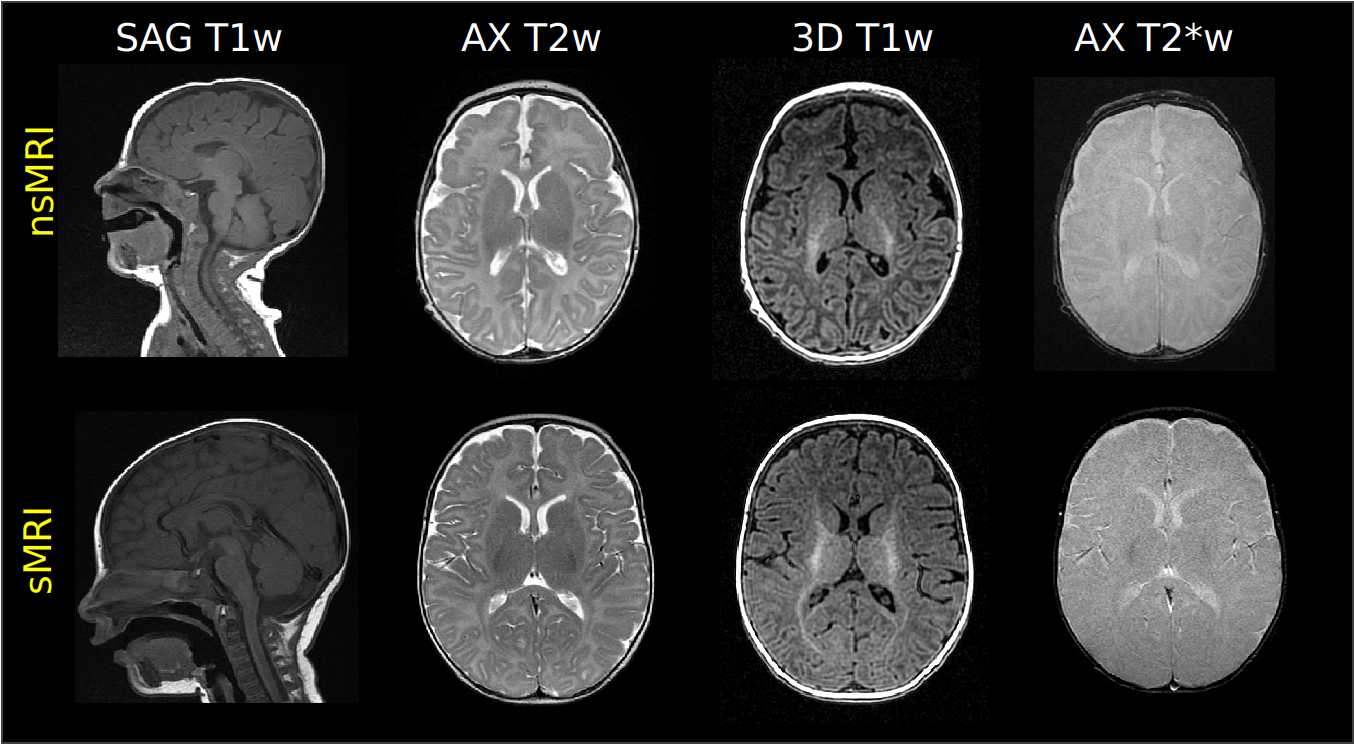
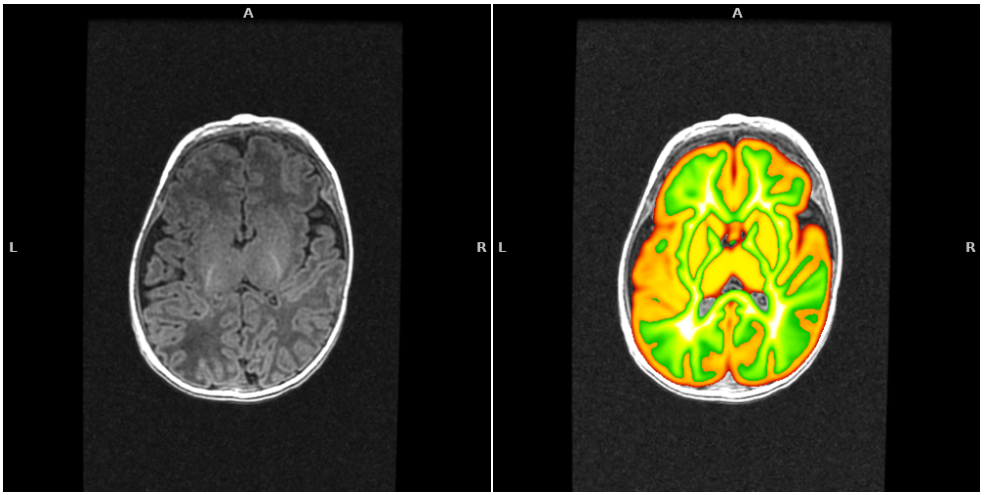
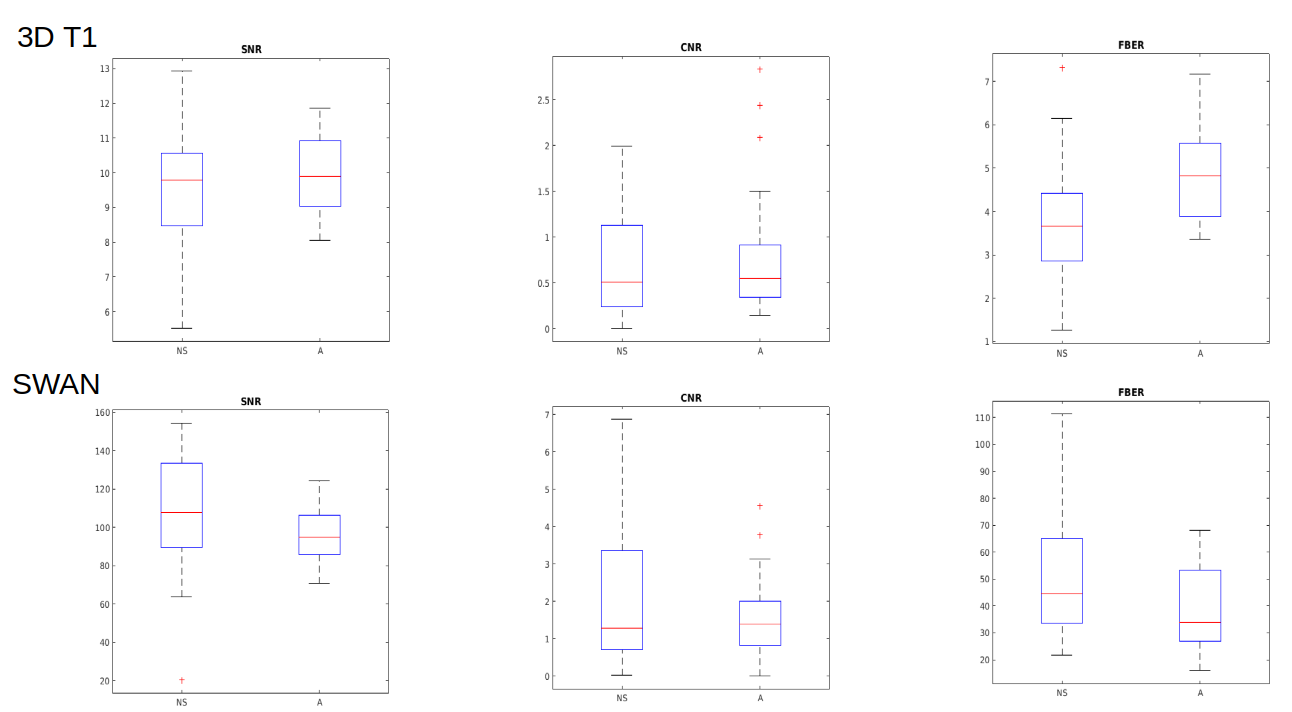
We retrospectively evaluated clinical images of infants younger than 6 months (age range 0-5 months) who underwent sMRI (n=23, age range 0-5 months, mean 3.4±1.4) or nsMRI (n=53, age range 0-5 months, mean 2.5±1.5) at a 1.5 T GE MR scanner. All exams included at least a 3D T1-weighted isotropic acquisition. Other MRI sequences considered for quality evaluation were 2D and/or 3D acquisitions with different weights (T1, T2, T2*, DWI). In Figure 1 some examples of MRI acquisitions are reported. Post-processing steps included gray matter and white matter probability maps identification on the 3D T1-weighted sequence by using ANTS diffeomorphic registration5 of age-matched atlases. First, we registered the T2w UNCInfant012Atlas6, which is distributed together with GM and WM priors, to the T1w NIHPD atlas (0-5 months)7 and applied the warping to the GM and WM priors. Second, we warped the NIHPD T1w atlas to the 3D T1w native space of the infant under process and applied the final warping field to the GM and WM priors. By applying a threshold of 0.9 on the final probability maps we obtained a selection of areas containing almost only GM or WM. By using these regions we identified the following quality measures: i) Signal to Noise Ratio (SNR): the mean intensity within gray matter divided by the standard deviation of the values outside the head; ii) Contrast to Noise ration (CNR): the absolute value of the difference between the mean of the gray matter intensity values and the mean of the white matter intensity values divided by the standard deviation of the values outside the head 8; iii) Foreground to Background Energy Ratio (FBER): the variance of voxels inside the brain divided by the variance of voxels outside the head9. The same metrics were extracted on all the MRI sequences. Groups comparisons on the median of extracted metrics were performed through non-parametric Kruskal Wallis tests.RESULTS
Figure 1 shows images obtained during a nsMRI and a sMRI exam, respectively. The proposed post-processing method was able to automatically identify regions of interests containing GM and WM in MRI brain scans of infants within 6 months of life, which is an age frame where the most consolidated brain scans segmentation tools can not reliably operate due to the peculiar contrast of the developing brain which is very different with respect to adulthood (Figure 2). The extracted metrics showed to be totally comparable in terms of SNR, CNR, FBER for nsMRI and sMRI groups in 2D axial T2w, 2D axial T2*w, 3D T2*w SWAN (Figure 3, bottom) and 3D T2w CUBE acquisitions. We observed a higher FBER in sMRI for 3D T1w sequence (p<0.001) (Figure 3, top right), a higher FBER in sMRI for coronal T2w sequence (p=0.04) and a higher SNR in sMRI for sagittal T1w SE sequence (p=0.001). On the contrary, we measured higher CNR and FBER in nsMRI DWI acquisitions (p=0.01 and p=0.008, respectively).DISCUSSION
Infants MR acquisition without motion artefacts during natural sleep is very challenging. However, it is desirable, since safety of motionless MRI obtained by sedation in infants is still a matter of debate. Moreover, image post processing is particularly difficult due to the peculiar MR contrast of the developing brain in this age frame. Our results show that automated post processing on such data is feasible and that most of the MRI sequences are not negatively impacted by natural sleep acquisition. The higher FBER values in T1w and T2w acquisition can be explained by the presence of the parents near the infants during the natural sleep acquisitions but these differences seem to be clinically not significant, since signal quality and contrast between different structures are preserved in most of the cases. Interestingly diffusion acquisitions have better quality in nsMRI. Further analyses will be necessary to improve single subject post processing and refine quality measurements extraction on such imaging data.CONCLUSION
Natural sleep MRI is feasible within 5 months of life. Our quality analysis suggests that there are no significant differences in overall quality for main images between nsMRI and sMRI. This is due to the fact that possibly respiratory movement might also affect brain movements in sMRI, in such short bodies. Our quality analysis support the use of a feasible protocol including 2D T1w, T2w, T2*w, 3D T1w, DWI and SWI to result in a high quality nsMRI exam for clinical purposes up to five months of age.Acknowledgements
No acknowledgement found.References
1 Novak I, Morgan C, Adde L, et al. Early, Accurate Diagnosis and Early Intervention in Cerebral Palsy: Advances in Diagnosis and Treatment. JAMA Pediatr. 2017 Sep 1;171(9):897-907. doi: 10.1001/jamapediatrics.2017.1689.
2 Neubauer V, Djurdjevic T, Griesmaier E et al. Routine Magnetic Resonance Imaging at Term-Equivalent Age Detects Brain Injury in 25% of a Contemporary Cohort of Very Preterm Infants. PLoS One. 2017 Jan 3;12(1):e0169442. doi: 10.1371/journal.pone.0169442. eCollection 2017.
3 De Sanctis Briggs V. Magnetic resonance imaging under sedation in newborns and infants: a study of 640 cases using sevoflurane. Paediatr Anaesth. 2005 Jan;15(1):9-15.
4 Antonov NK, Ruzal-Shapiro CB, Morel KD et al. Feed and Wrap MRI Technique in Infants. Clin Pediatr (Phila). 2017 Oct;56(12):1095-1103. doi: 10.1177/0009922816677806. Epub 2016 Nov 23.
5 Avants, B. B., Epstein, C. L., Grossman, M., & Gee, J. C. . Symmetric diffeomorphic image registration with cross-correlation: Evaluating automated labeling of elderly and neurodegenerative brain. Medical Image Analysis, 2008 12(1), 26–41. https://doi.org/10.1016/j.media.2007.06.004
6 Shi, F., Yap, P.-T., Wu, G., Jia, H., Gilmore, J. H., Lin, W., & Shen, D. Infant Brain Atlases from Neonates to 1- and 2-Year-Olds. PLoS ONE, 2011, 6(4), e18746. https://doi.org/10.1371/journal.pone.0018746
7 Almli, C. R., Rivkin, M. J., McKinstry, R. C., & Brain Development Cooperative Group.. The NIH MRI study of normal brain development (Objective-2): Newborns, infants, toddlers, and preschoolers. NeuroImage, 2007, 35(1), 308–325. https://doi.org/10.1016/j.neuroimage.2006.08.058
8 Magnotta, V. A., Friedman, L., & FIRST BIRN, F. Measurement of Signal-to-Noise and Contrast-to-Noise in the fBIRN Multicenter Imaging Study. Journal of Digital Imaging, 2006, 19(2), 140–147. https://doi.org/10.1007/s10278-006-0264-x
9 Shehzad Z, Giavasis S, Li Q, Benhajali Y, Yan C, Yang Z, Milham M, Bellec P, and Craddock C, The preprocessed connectomes project quality assessment protocol—a resource for measuring the quality of mri data, Frontiers in neuroscience, 2015.
Figures