0077
Multi-component atlas of fetal brain development via decomposition of diffusion MRI1Biomedical Engineering Department, School of Biomedical Engineering and Imaging Sciences, King's College London, London, United Kingdom, 2Centre for the Developing Brain, School of Biomedical Engineering and Imaging Sciences, King's College London, London, United Kingdom, 3Department of Electrical Engineering (ESAT/PSI), KU Leuven, Leuven, Belgium
Synopsis
Mapping tissue maturation in the fetal brain with diffusion MRI requires modelling transient processes in early brain development. In this work, we extend a data-driven multi-component framework introduced for modelling neonatal brain development to fetal data of the developing Human Connectome Project (dHCP). To this end, we build weekly templates ranging from 23 to 37 weeks gestational age that consist of one fluid and two orientationally-resolved tissue components. The orientation-resolved components exhibit marked spatial patterns and temporal trajectories, and demonstrate pronounced microstructural changes with gestational age.
Introduction
Early brain development is characterised by transient microstructural processes and age-dependent, spatially heterogeneous tissue characteristics3. High Angular Resolution Diffusion Imaging (HARDI) data has been shown to capture aspects of parenchyma maturation in the neonatal period but, in contrast to adult tissue microstructural models, requires an age-dimension to adequately characterise brain development2. Previous work2 has used multi-shell multi-tissue constrained spherical deconvolution (MSMT-CSD)1 in a neonatal cohort to decompose multi-shell HARDI data into multiple orientationally-resolved images. This decomposition was based on a fluid and two age-specific white matter signatures (“response functions”), which together capture temporal, b-value, and angular properties of developing brain tissue.Here, we extend this work to a younger fetal cohort of the developing Human Connectome Project (dHCP), scanned in utero, and derive response functions that exhibit sensitivity to fetal brain development and yield orientation distribution functions (ODFs) that allow the fibre-specific analysis of maturation patterns.
Methods
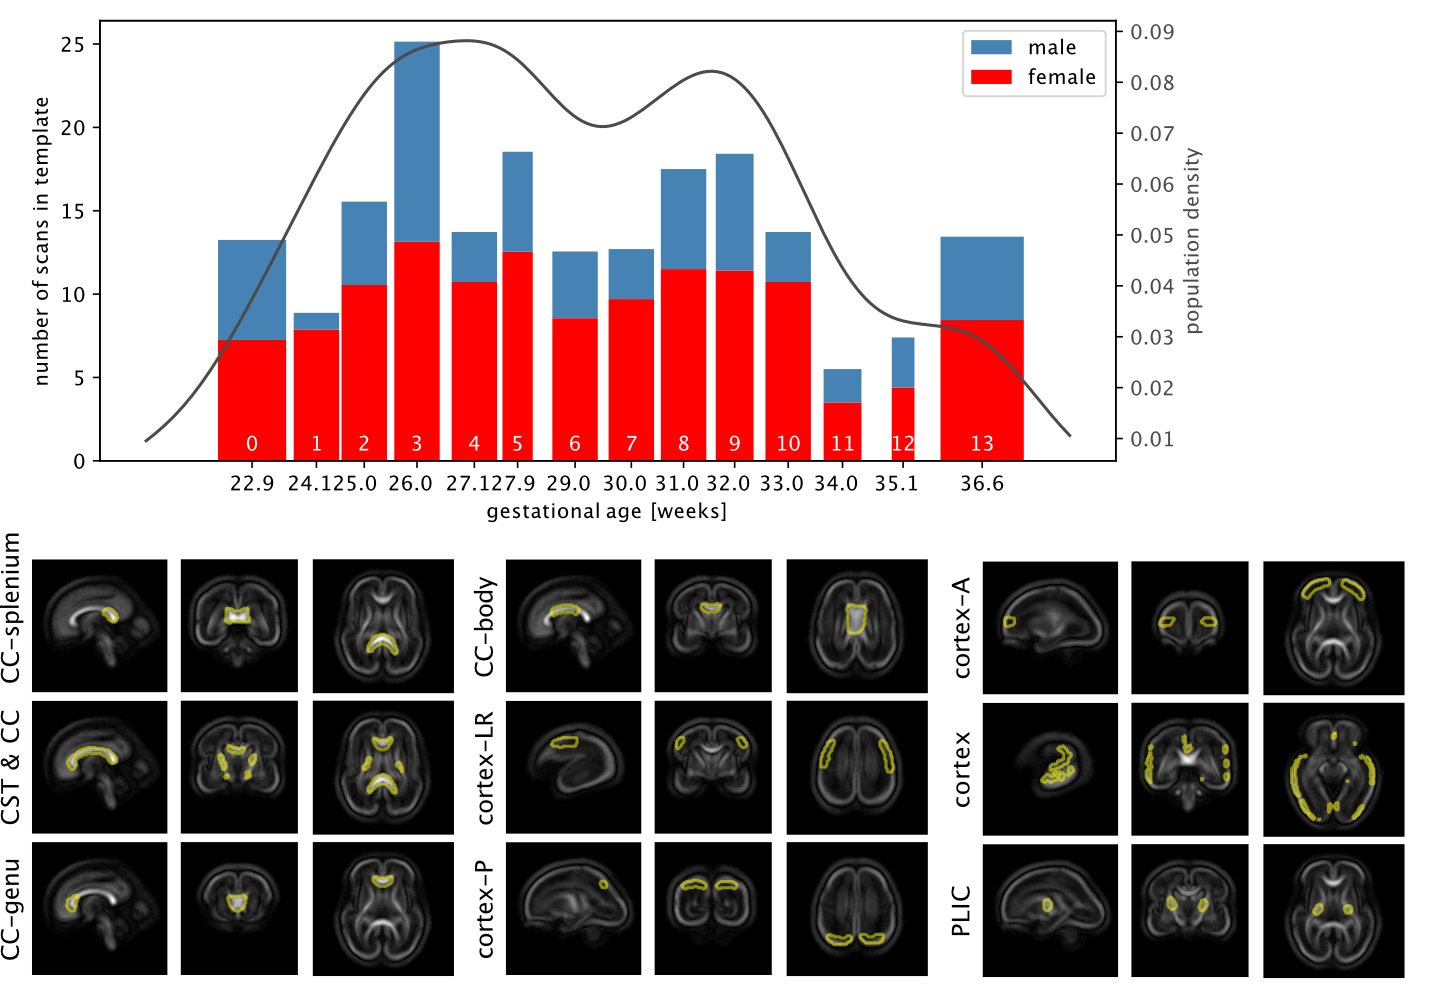
Acquisition and preprocessing follow the pipeline for fetal diffusion MRI in the dHCP4. Data was acquired on a Philips Achieva 3T using a spin echo and field echo sequence5 with a resolution of 2mm. The diffusion encoding was optimised in a data-driven way6, yielding 3 shells with b=0s/mm2 (15 volumes), b=400s/mm2 (46 volumes), and b=1000s/mm2 (80 volumes). Preprocessing consists of denoising7,8 dynamic distortion correction, B1 intensity inhomogeneity correction9, brain masking and slice-to-volume motion correction using a multi-shell data representation with slice-level outlier suppression10,11.The cohort for this study consists of 140 scans from 127 subjects with gestational age between 22.1 and 37.4 weeks, selected for acceptable image quality according to expert rating4. The scans were split into 14 weekly groups (Fig.1).
For group-wise spatial alignment, initial subject-specific ODFs12 were rigidly registered to a manually pose-corrected subset of images, followed by nonlinear diffeomorphic registration13 (upsampled to 1mm grid size). The tissue volume fraction maps from the resulting weekly templates were coregistered14 to age-matched T2-weighted templates from Serag et al.15 to extract age-specific tissue and CSF masks. Finally, all ODF templates were iteratively nonlinearly aligned to a joint population template13 using median aggregation.
Response function estimation and decomposition
To investigate spatio-temporal patterns, location-specific single fibre response functions were extracted in subject-native space16 within cortical, subcortical and white matter regions of interest selected in the jointly aligned atlas (see Fig. 2) that span the brain but are confined to likely single fibre areas.
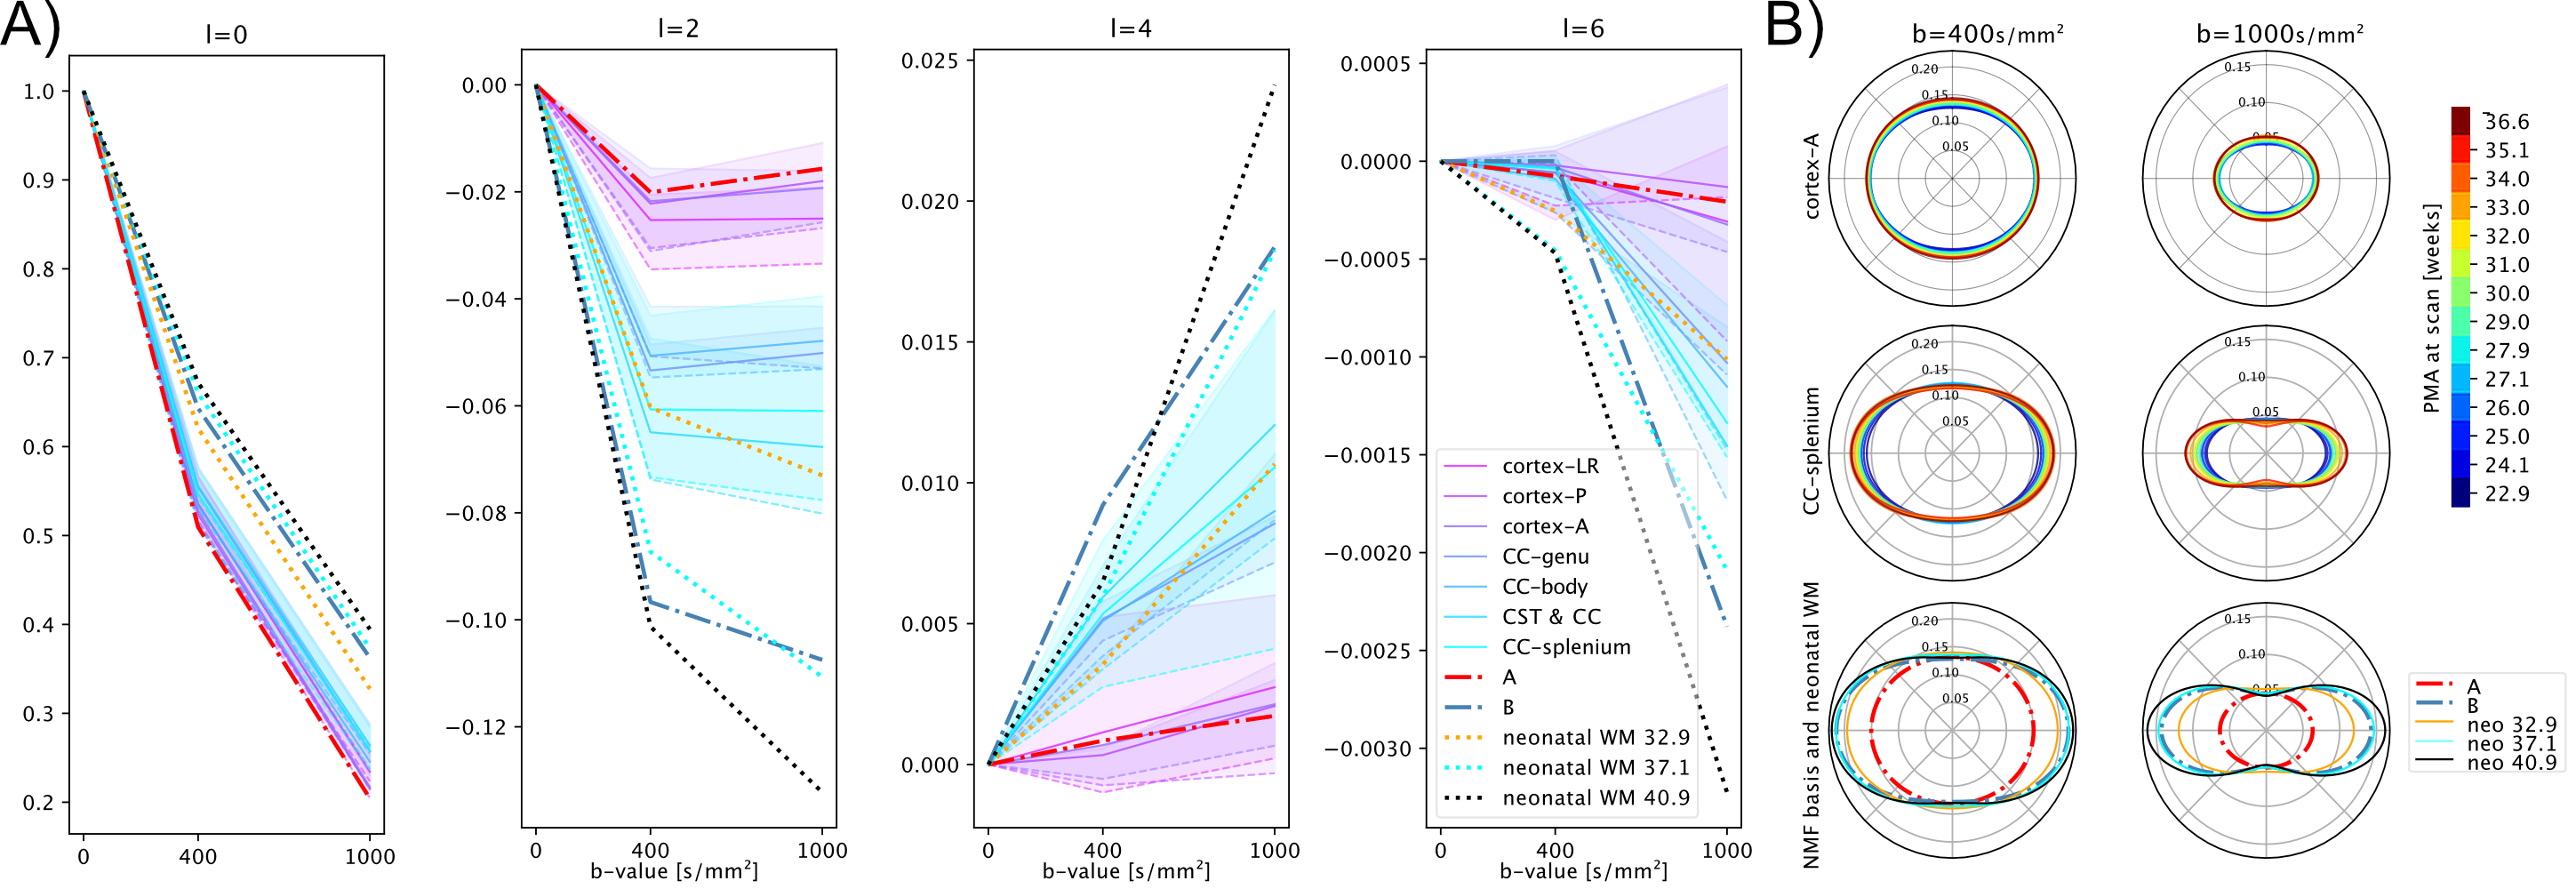
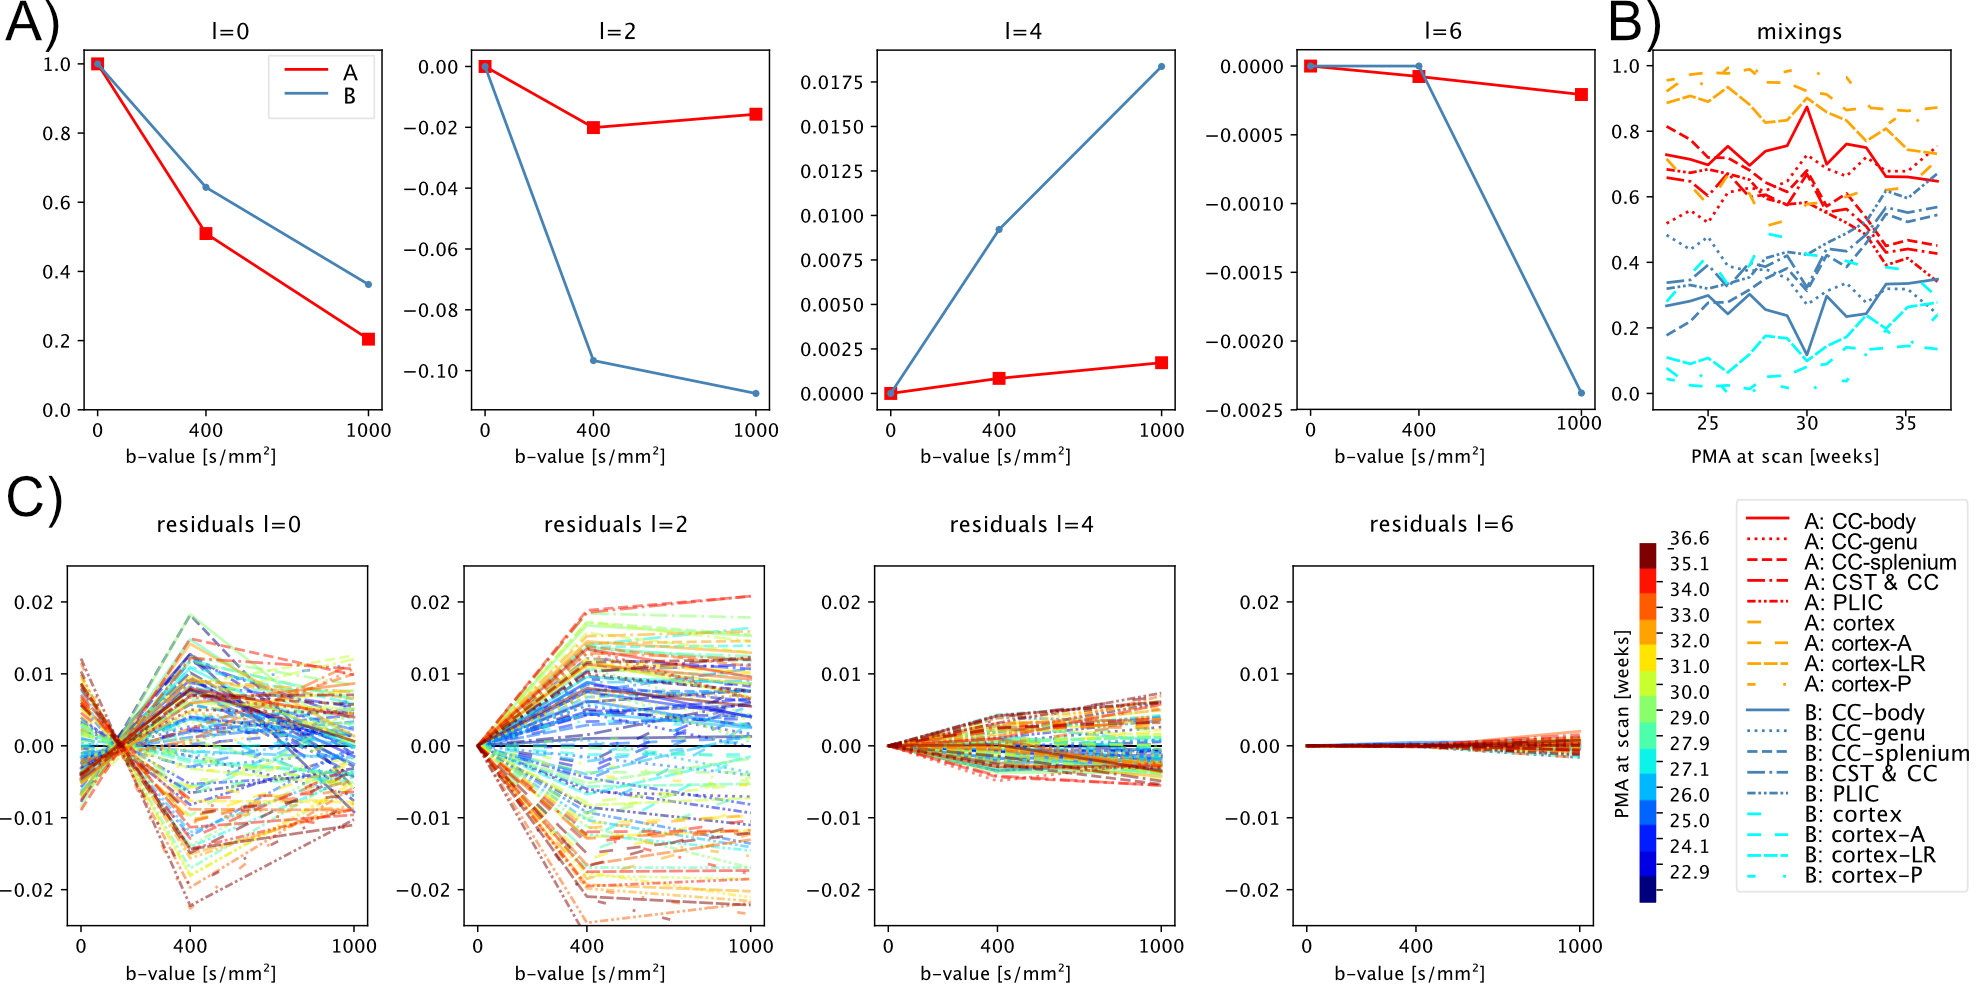
In line with previous neonatal work2, we form a canonical representation of all response functions across ages and regions by expressing them as a linear combination of $$$r=2$$$ components. Here we compute their coefficients using non-negative matrix factorisation (NMF)18,19. NMF decomposes a non-negative matrix $$$X\in\mathbb{R}^{n\,\times\,m}_{+}$$$ into a product of two non-negative matrices $$$W\in\mathbb{R}^{n\,\times\,r}_{+}$$$ and $$$H\in\mathbb{R}^{r\,\times\,m}_{+}$$$ by minimising the objective$$$\frac{1}{2}\|X-WH\|_F\text{, s.t. } W_{ij} \geq 0 \text{, } H_{ij} \geq 0 \forall i,j$$$. In our case, $$$X$$$ represents the $$$m$$$ coefficients (up to order $$$l_max=6$$$) of all $$$n$$$ region- and age-specific response functions, normalised to their $$$b=0$$$ components with non-negativity ensured by flipping signs in alternating harmonic orders and finally clipping remaining non-negative components due to noise to zero. We perform Monte Carlo NMF and select the decomposition that lies both within 1% of the lowest objective function and maximises the dynamic range $$$\frac{1}{r} \sum_j (\max_i(W_{ij}) - \min_i(W_{ij}))^2$$$.The two resulting response functions and a population-averaged CSF response17 are scaled such that the angular mean of the ODFs produced by the subsequent MSMT-CSD sum to one (on average) across all brains in the cohort21.
Results
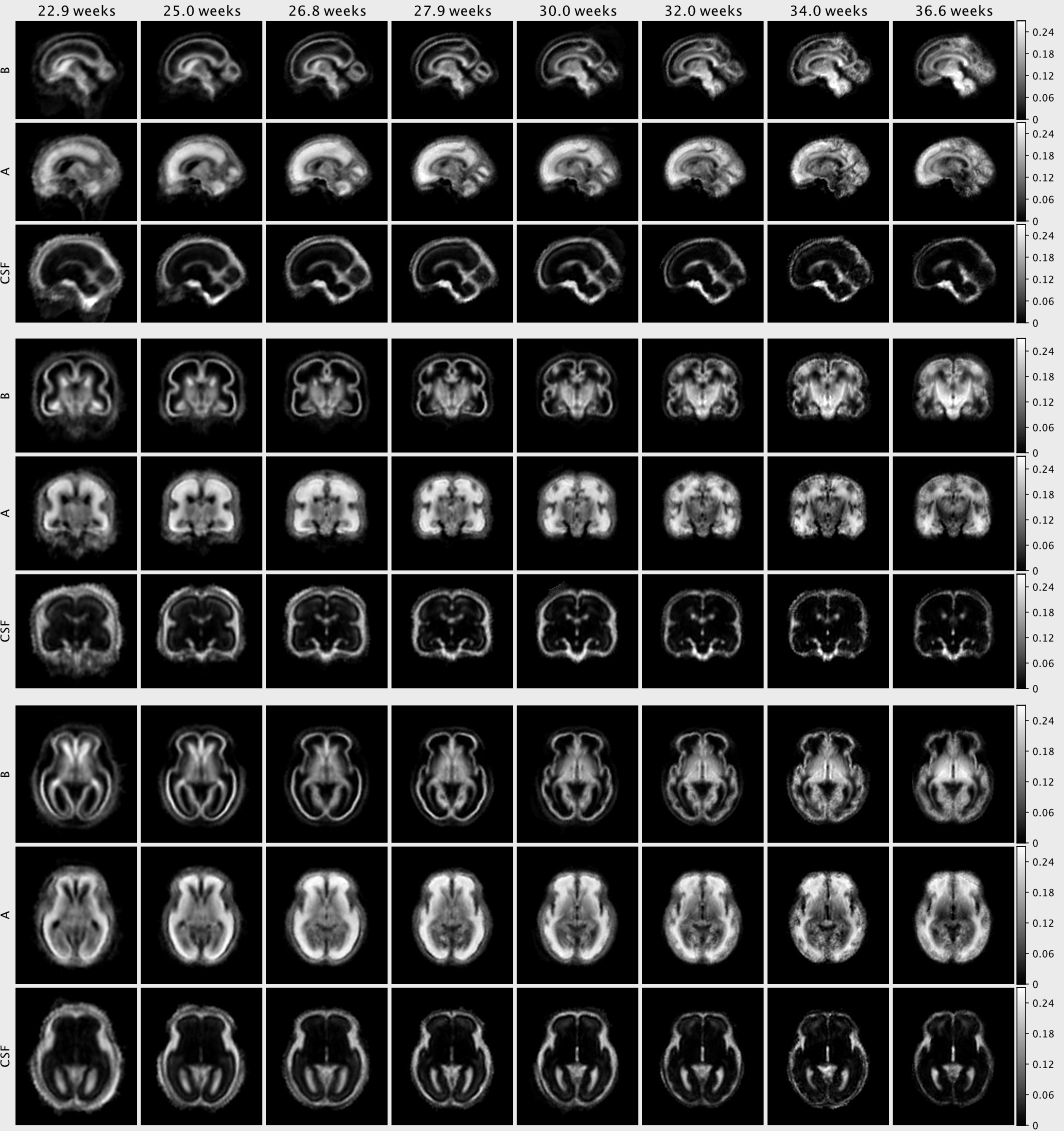
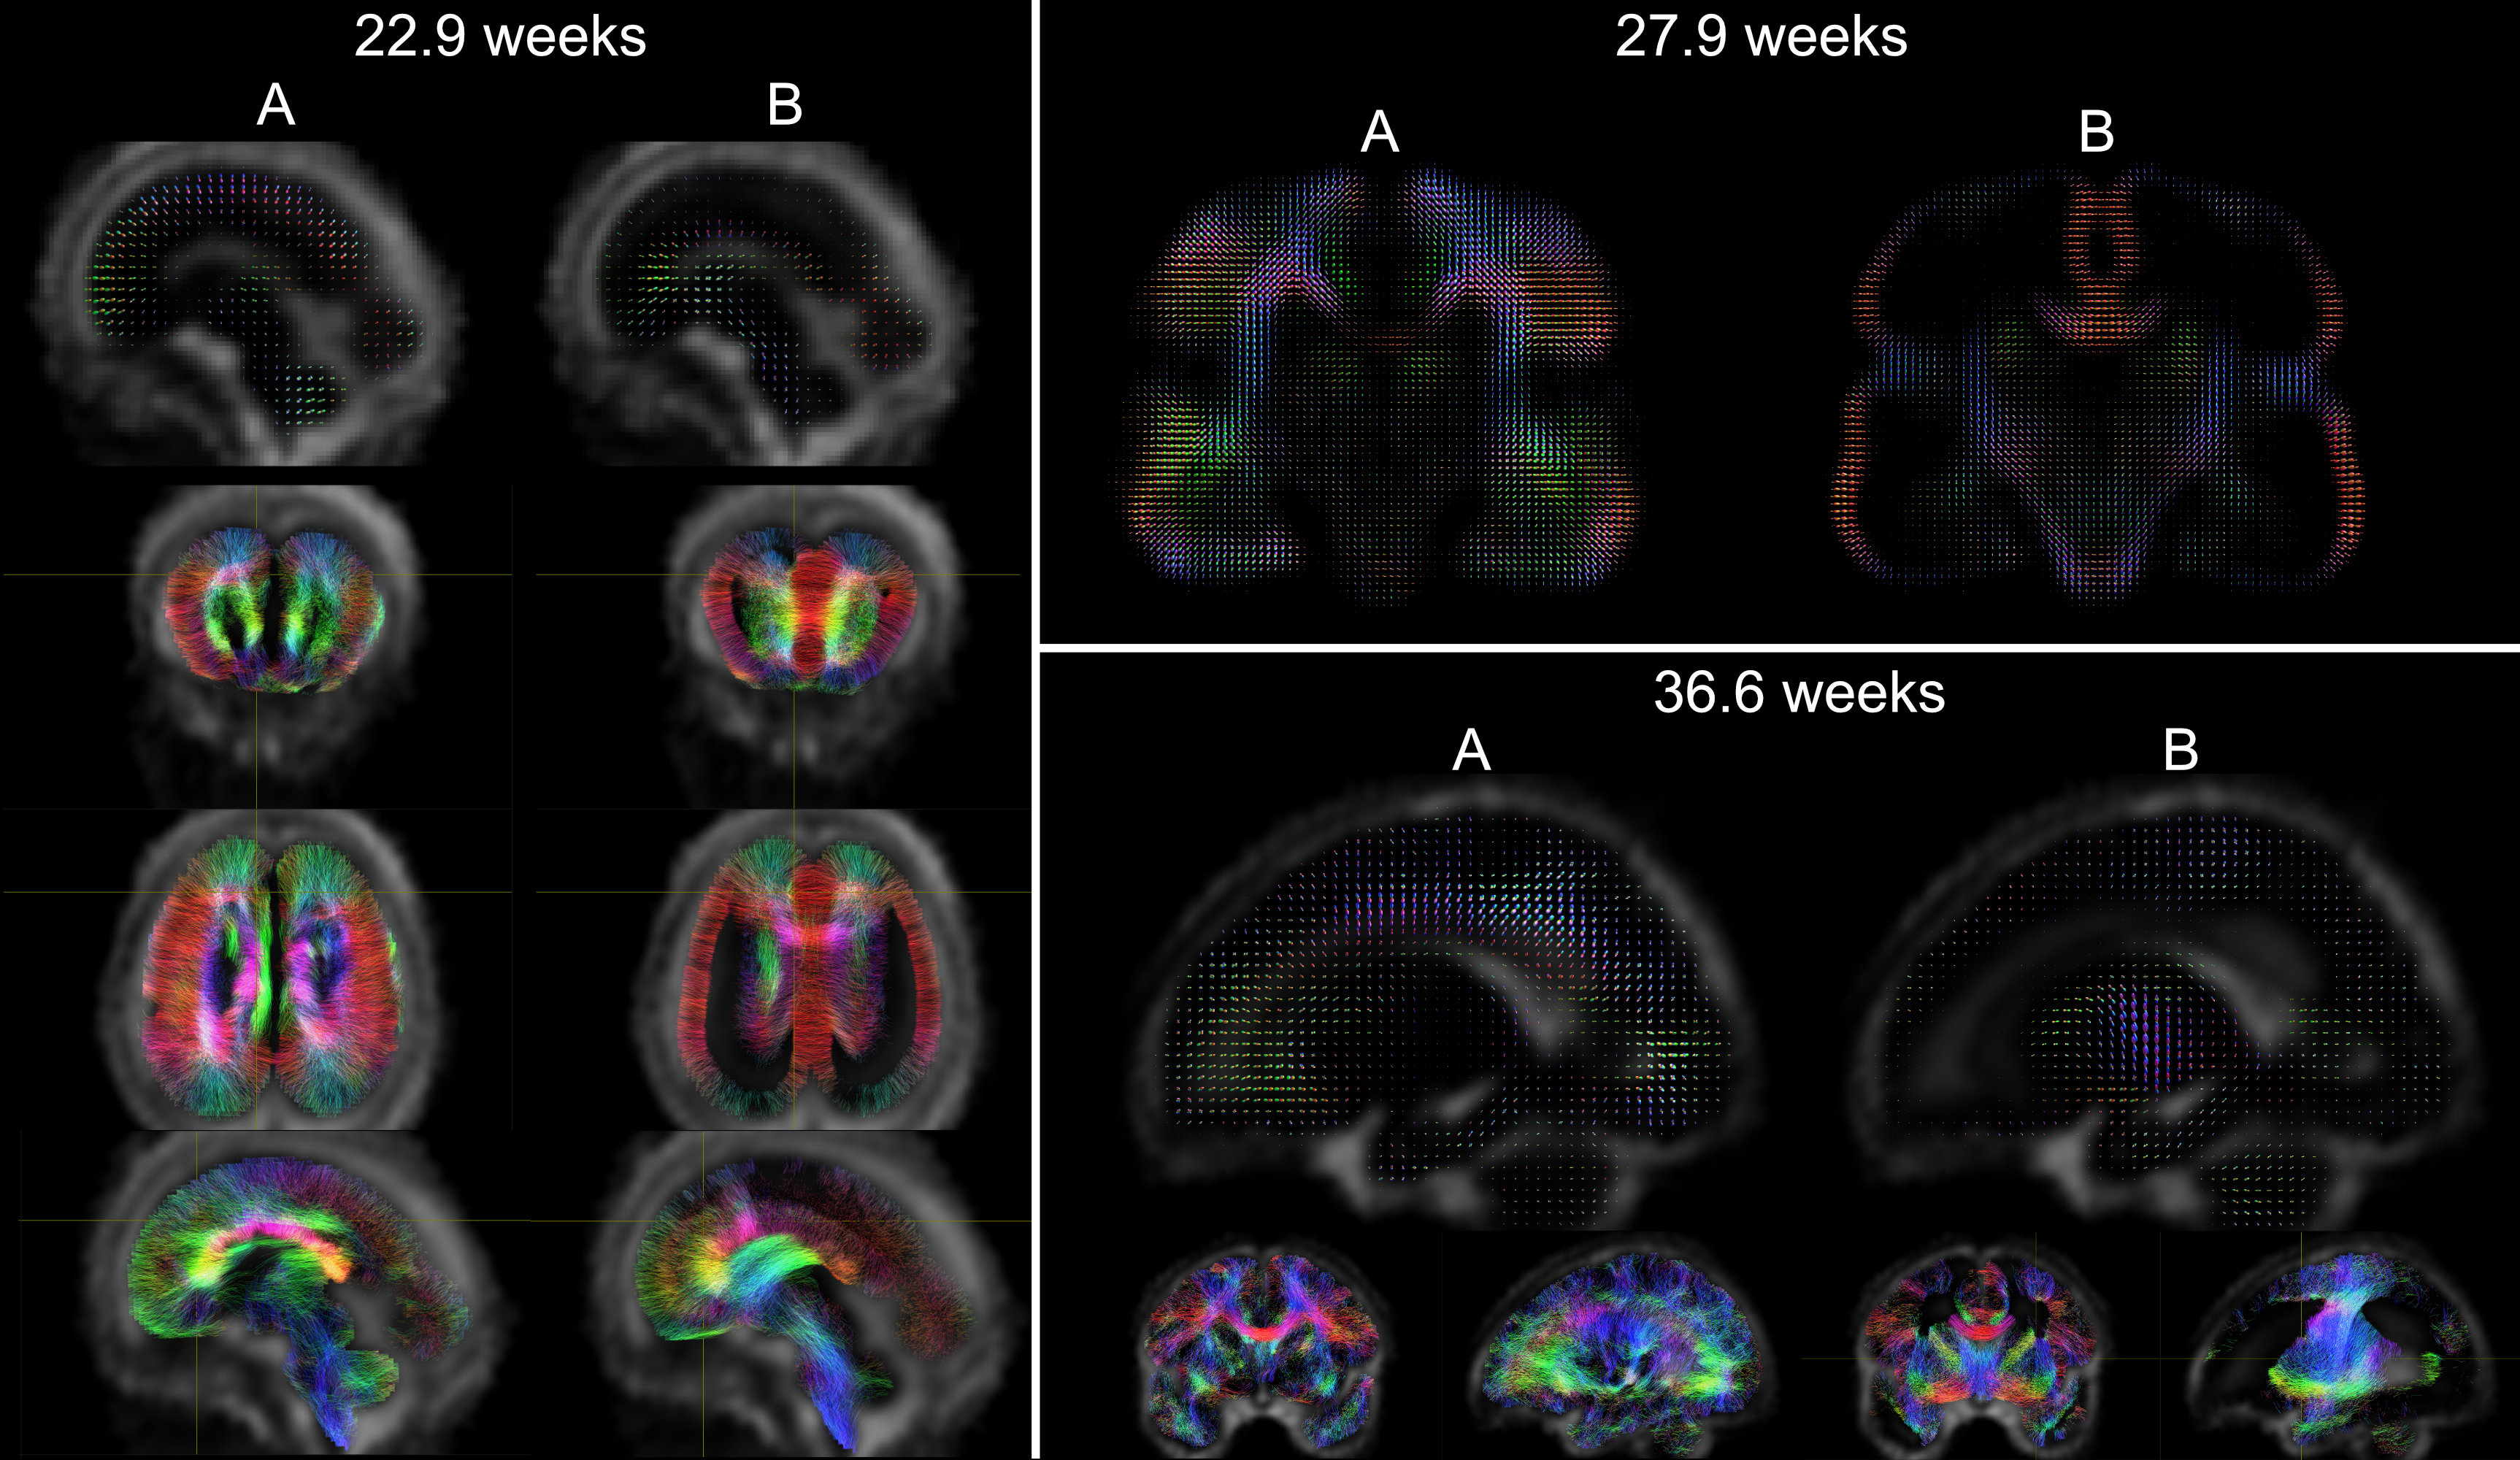
The NMF decomposition of the region and age-specific response functions (Fig. 2A) yields components with nearly linear age-trends in most regions of interest (Fig. 3B). Component A is very similar to cortical tissue in the youngest cohort, component B is most similar to the most mature white matter in the corpus callosum, decays slower with increasing b and is more anisotropic than A. In comparison to ex-utero higher resolution (spatial and angular) neonatal data, component A is remarkably similar to neonatal WM at 37.1 weeks2 (Fig. 2).The volume fraction maps (Fig. 4) are in line with the NMF weight trajectories, and similar to neonatal data2, early maturing white matter structures transition to the anisotropic component while the density in the cortex shows the opposite behaviour. In the younger groups, the two components sharply delineate cortical tissue from the stratified transitional field.
Conclusion
This time-resolved atlas of fetal brain HARDI data decomposes microstructural patterns in early brain development (Fig. 5) and provides a window into important aspects of brain maturation, including transitory tissue patterns, migratory streams and the maturation of white matter pathways such as the cingulum, in-vivo from 23 weeks gestation up to term-age. This atlas exhibits longitudinal patterns similar to previous observations in neonatal data and facilitates the multi-component analysis of microstructural properties in early brain development.Acknowledgements
This work was supported by ERC grant agreement no. 319456 (dHCP project), the Wellcome EPSRC Centre for Medical Engineering at Kings College London (WT 203148/Z/16/Z) and by the National Institute for Health Research (NIHR) Biomedical Research Centre based at Guy’s and St Thomas’ NHS Foundation Trust and King’s College London. DC is supported by the Flemish Research Foundation (FWO; grant number 12ZV420N). The views expressed are those of the authors and not necessarily those of the NHS, the NIHR or the Department of Health.References
1 B. Jeurissen, J.-D. D. Tournier, T. Dhollander, A. Connelly, and J. Sijbers, ‘Multi-tissue constrained spherical deconvolution for improved analysis of multi-shell diffusion MRI data’, NeuroImage, vol. 103, pp. 411–426, Dec. 2014.
2 M. Pietsch et al., ‘A framework for multi-component analysis of diffusion MRI data over the neonatal period’, NeuroImage, Nov. 2018.
3 J. Altman and S. A. Bayer, ‘Regional differences in the stratified transitional field and the honeycomb matrix of the developing human cerebral cortex’, J. Neurocytol., vol. 31, no. 8–9, pp. 613–632, 2002.
4 D. Christiaens et al., ‘Fetal diffusion MRI acquisition and analysis in the developing Human Connectome Project’, in Proc. Intl. Soc. Mag. Reson. Med. 27, 2019, p. 0629.
5 L. Cordero-Grande, A. Price, D. Christiaens, J. Hutter, and J. Hajnal, ‘Spin And Field Echo (SAFE) dynamic field correction in 3T fetal EPI’, in Proceedings of the 26th annual meeting of the ISMRM, Paris, France, Juni 07, 2018, vol. 13.
6 J.-D. Tournier et al., ‘Data-driven optimisation of multi-shell HARDI’, in Proc. Intl. Soc. Mag. Reson. Med., 2015, vol. 23, no. 2897.
7 R. R. Nadakuditi, ‘Optshrink: An algorithm for improved low-rank signal matrix denoising by optimal, data-driven singular value shrinkage’, IEEE Trans. Inf. Theory, vol. 60, no. 5, pp. 3002–3018, 2014.
8 J. Veraart, D. S. Novikov, D. Christiaens, B. Ades-Aron, J. Sijbers, and E. Fieremans, ‘Denoising of diffusion MRI using random atrix theory’, NeuroImage, pp. 1–28, 2016.
9 N. J. Tustison et al., ‘N4ITK: improved N3 bias correction’, IEEE Trans. Med. Imaging, vol. 29, no. 6, pp. 1310–1320, Jun. 2010.
10 D. Christiaens et al., ‘Multi-shell SHARD reconstruction from scattered slice diffusion MRI data in the neonatal brain’, ISMRM Paris, 2018.
11 D. Christiaens et al., ‘Learning compact q-space representations for multi-shell diffusion-weighted MRI’, IEEE Trans. Med. Imaging, Oct. 2018.
12 J. Tournier, F. Calamante, and A. Connelly, ‘Robust determination of the fibre orientation distribution in diffusion MRI: non-negativity constrained super-resolved spherical deconvolution’, NeuroImage, vol. 35, no. 4, pp. 1459–1472, 2007.
13 D. Raffelt, J.-D. Tournier, J. Fripp, S. Crozier, A. Connelly, and O. Salvado, ‘Symmetric diffeomorphic registration of fibre orientation distributions’, NeuroImage, vol. 56, no. 3, pp. 1171–1180, 2011.
14 M. Jenkinson, P. Bannister, M. Brady, and S. Smith, ‘Improved Optimization for the Robust and Accurate Linear Registration and Motion Correction of Brain Images’, NeuroImage, vol. 17, no. 2, pp. 825–841, Oct. 2002.
15 A. Serag, A. D. Edwards, J. V. Hajnal, S. J. Counsell, J. P. Boardman, and D. Rueckert, ‘A multi-channel 4D probabilistic atlas of the developing brain: application to fetuses and neonates’, Ann. BMVA, vol. 2012, no. 3, pp. 1–14, 2012.
16 J. D. Tournier, F. Calamante, and A. Connelly, ‘Determination of the appropriate b value and number of gradient directions for high-angular-resolution diffusion-weighted imaging.’, NMR Biomed., vol. 26, no. 12, pp. 1775–1786, Dec. 2013.
17 T. Dhollander, R. Mito, D. Raffelt, and A. Connelly, ‘Improved white matter response function estimation for 3-tissue constrained spherical deconvolution’, in Proc Intl Soc Mag Reson Med, 2019, p. 555.
18 P. Paatero and U. Tapper, ‘Positive matrix factorization: A non-negative factor model with optimal utilization of error estimates of data values’, Environmetrics, vol. 5, no. 2, pp. 111–126, Jun. 1994.
19 D. D. Lee and H. S. Seung, ‘Learning the parts of objects by non-negative matrix factorization.’, Nature, vol. 401, no. 6755, pp. 788–791, 1999.
20 D. Christiaens, S. Sunaert, P. Suetens, and F. Maes, ‘Convexity-constrained and nonnegativity-constrained spherical factorization in diffusion-weighted imaging’, NeuroImage, vol. 146, pp. 507-517, 2016.
21 D. Raffelt et al., ‘Bias Field Correction and Intensity Normalisation for Quantitative Analysis of Apparent Fibre Density’, in Proc. Intl. Soc. Mag. Reson. Med., 2017, vol. 25, p. 3541.
Figures