0073
Using transverse diffusion to measure changes in muscle fibre number and muscle fibre size during childhood growth in humans
Bart Bolsterlee1,2, Arkiev D'Souza1,3, and Robert D Herbert1,3
1Neuroscience Research Australia, Randwick, Australia, 2Graduate School of Biomedical Engineering, University of New South Wales, Randwick, Australia, 3School of Medical Sciences, University of New South Wales, Randwick, Australia
1Neuroscience Research Australia, Randwick, Australia, 2Graduate School of Biomedical Engineering, University of New South Wales, Randwick, Australia, 3School of Medical Sciences, University of New South Wales, Randwick, Australia
Synopsis
We used diffusion tensor imaging (DTI) to study macroscopic and microscopic features of skeletal muscles during childhood development (5-17 years). From muscle volume and fibre length measurements, we determined the summed cross-sectional area of all fibres. From measurements of diffusion properties and simulations of restricted diffusion in skeletal muscle, we estimated mean cross-sectional areas of individual fibres. Our findings suggest that human muscles grow both by adding fibres and by increasing fibre cross-sectional areas. DTI-based measurements of skeletal muscle micro- and macrostructure could have important applications in understanding both normal and disordered muscle growth.
Introduction
Skeletal muscles undergo large changes in size and structure during childhood development. Transverse growth of the whole muscle, i.e. growth in the plane perpendicular to muscle fibres, must be accompanied by generation of new fibres (hyperplasia), transverse growth of existing fibres (fibre hypertrophy), or both. In rats and mice, postnatal muscle growth appears to originate almost exclusively from fibre hypertrophy and not hyperplasia1, but the mechanisms of muscle growth in humans remain uncertain.In this study we used diffusion tensor imaging (DTI) to study macroscopic and microscopic features of skeletal muscle in children aged 5 to 17 years. We estimated fibre numbers from DTI-based measurements of physiological cross-sectional area2 (PCSA; a macroscopic muscle property equal to the summed cross-sectional areas of all fibres in a muscle) and mean fibre cross-sectional area (FCSA; estimated from measurements of diffusion rates and diffusion simulations3,4). We hypothesised that human muscles grow exclusively through hypertrophy, not hyperplasia, so that fibre number does not change with age.
Methods
We re-analysed previously published data on muscle PCSA, mean axial diffusivity (λ1), radial diffusivity (λ2 and λ3) and fractional anisotropy (FA) obtained with mDixon and DTI scans of the lower legs of 39 children2. Data were available for 59 medial gastrocnemius muscles: both sides of 20 typically developing children and the less-affected side of 19 children with unilateral spastic cerebral palsy.DTI scans of the lower legs were obtained on a 3T Philips Achieva TX with the following settings: DT-EPI with spectral pre-saturation with inversion recovery (SPIR) fat suppression, TR/TE 8715/63 msec, field of view 180x180 mm, slice thickness 5 mm, 16 gradient directions on a hemisphere, NSA 4, b=500 s/mm2 (b0 image with b=0 s/mm2), diffusion gradient time Δ/δ = 30.4/8.2 msec and scan time 568 sec.
Muscle volume was derived from manual segmentation of the medial gastrocnemius muscles on mDixon scans. Using anatomically constrained DTI tractography5, fascicle length was measured for, on average, 3,750 fascicles per muscle (details in ref 2). PCSA was calculated by dividing muscle volume by median fascicle length. Diffusion properties were calculated per fibre tract by interpolating maps of diffusion properties at the fibre tract points. The diffusion properties of a muscle were defined as the median value of all tracts in that muscle.
To determine the relationship between fractional anisotropy and FCSA, we used random walk simulations of the restricted diffusion process in skeletal muscle3,4. A total of 20,000 walkers were placed on a two-dimensional square Voronoi diagram6 resembling a cross-section of muscle tissue with 127 cells (muscle fibres; Fig. 1a). The coefficient of variation of FCSA (Voronoi cell area) was 18%. Walkers took 2,000 steps in randomly chosen directions with a step size r=√(4D0Δ/2000) , where D0, the unrestricted diffusion coefficient, was set as the mean λ1 in our dataset of 1.82 μm2/msec and Δ, the total diffusion time, was set at 30.4 msec, corresponding to the diffusion time of the DTI acquisition. Walkers attempting to cross cell membranes succeeded with a probability of 2rκ/D0 where κ, the permeability of muscle cell membranes, was set at 0.018 μm/msec 7. λ2 and λ3 were derived by eigenvalue decomposition of the diffusion tensor (covariance of walker displacements divided by 2Δ). FA was calculated using λ1=1.82 μm2/msec. Simulations were done with different scale factors for the Voronoi diagram so that the mean FCSA ranged from 79 to 7854 μm2, equivalent to the areas of cylindrical fibres with diameters ranging from 10 to 100 μm.
The simulated FA-FCSA relationship was used to estimate FCSA from DTI-measured FA values, after which fibre number (= PCSA/FCSA) was calculated. Linear mixed models with participants as random factors were used to regress PCSA against diffusion properties, FCSA and fibre number. We also regressed age against FCSA and fibre number.
Results
Children’s muscles with larger PCSAs had higher radial diffusion rates (λ2 and λ3), higher mean diffusivity, and lower fractional anisotropy (Fig. 2), indicative of larger FCSAs. There was no effect of PCSA on axial diffusivity (λ1). The simulated relationship between FCSA and FA (Fig. 1b) was used to estimate mean FCSA for all muscles (Fig. 3 and 4).Muscles with larger PCSAs also had larger mean FCSAs (Fig. 3a) and more muscle fibres. Compared to a muscle with a PCSA of 20 cm2, a muscle with a 3× larger PCSA (60 cm2) was estimated to have 1.5× larger FCSA (661 vs 1,016 μm2) and twice as many fibres (3.1·106 vs 6.4·106). Fibre number also increased with age (Fig. 4).
Discussion
We describe the use of DTI to study fundamental mechanisms of muscle growth during childhood development. Our findings suggest that growth in human muscles originates both from increases in fibre cross-sectional areas and addition of new fibres.The FA-FCSA relationship derived here corresponds well to findings of another simulation study4 (Fig. 1b), but further validation is required. Cadaver measurements of FCSA in gastrocnemius muscles of seven children8 (Fig. 4A) agree reasonably well with our data in younger muscles (5-6 years), but older muscles had larger diameters than we estimated. Future studies could estimate fibre diameters more accurately using time-dependent DTI9 and simulations which include the extracellular matrix4,10.
Acknowledgements
The authors acknowledge the facilities and scientific and technical assistance of NeuRA Imaging, a node of the National Imaging Facility, a National Collaborative Research Infrastructure Strategy (NCRIS) capability. The study was supported by the Australian National Health and Medical Research Council (NHMRC; Program Grant APP1055084).References
- Alnaqeeb MA, Goldspink G. Changes in fibre type, number and diameter in developing and ageing skeletal muscle. J Anat. 1987;153:31-45.
- D'Souza A,
Bolsterlee B, Lancaster A, Herbert R. Muscle architecture in children with
cerebral palsy and ankle contractures: An investigation using diffusion tensor
imaging. Clin Biomech. 2019; 68:205-211.
- Novikov DS, Fieremans E, Jensen JH, Helpern JA. Random walks with barriers. Nat Phys. 2011;7(6):508-514.
- Berry DB, Regner B, Galinsky V, Ward SR, Frank LR. Relationships between tissue microstructure and the diffusion tensor in simulated skeletal muscle. Magnet Reson Med. 2018;80(1):317-329.
- Bolsterlee B, D'Souza A, Herbert RD. Reliability and robustness of muscle architecture measurements obtained using diffusion tensor imaging with anatomically constrained tractography. J Biomech. 2019;86:71-78.
- Sánchez‐Gutiérrez D, Tozluoglu M, Barry JD, Pascual A, Mao Y, Escudero LM. Fundamental physical cellular constraints drive self‐organization of tissues. The EMBO journal. 2016;35(1):77-88.
- Fieremans E, Novikov D, Sigmund E, Liu K, Jensen J, Helpern J. In vivo measurement of membrane permeability and fiber size in calf muscle using time-dependent DWI. Paper presented at: Proc. Intl. Soc. Mag. Reson. Med2011.
- Aherne W, Ayyar DR, Clarke PA, Walton JN. Muscle fibre size in normal infants, children and adolescents. An autopsy study. J Neurol Sci. 1971;14(2):171-182.
- Sigmund EE, Novikov DS, Sui D, et al. Time-dependent diffusion in skeletal muscle with the random permeable barrier model (RPBM): application to normal controls and chronic exertional compartment syndrome patients. NMR Biomed. 2014;27(5):519-528.
- Fieremans E, Novikov DS, Jensen JH, Helpern JA. Monte Carlo study of a two-compartment exchange model of diffusion. NMR Biomed. 2010;23(7):711-724.
Figures
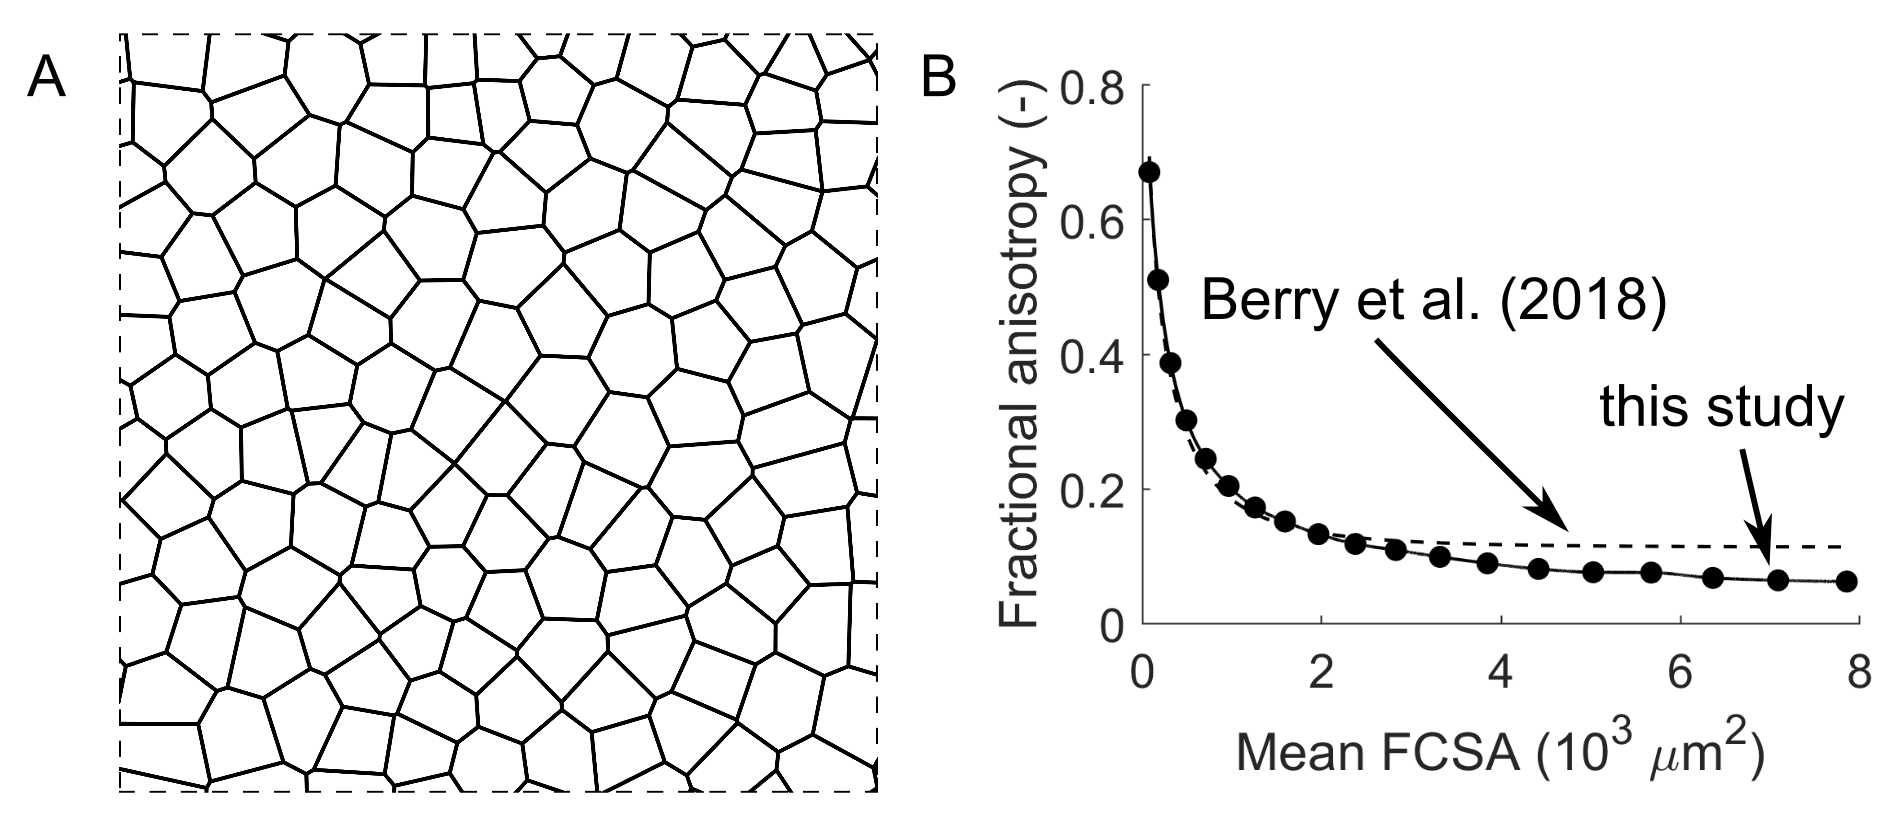
Fig. 1 (A) Voronoi diagram resembling a cross-section of
healthy muscle tissue with 127 fibres (see ref 6 for details). The diagram was
used for random walk simulations of the restricted diffusion process in
skeletal muscle. Diagram dimensions were scaled to vary mean fibre
cross-sectional area (FCSA, the mean area of cells in the diagram). (B) Relationship
between fractional anisotropy and FCSA derived in this study and from
simulations by Berry et al. 4.
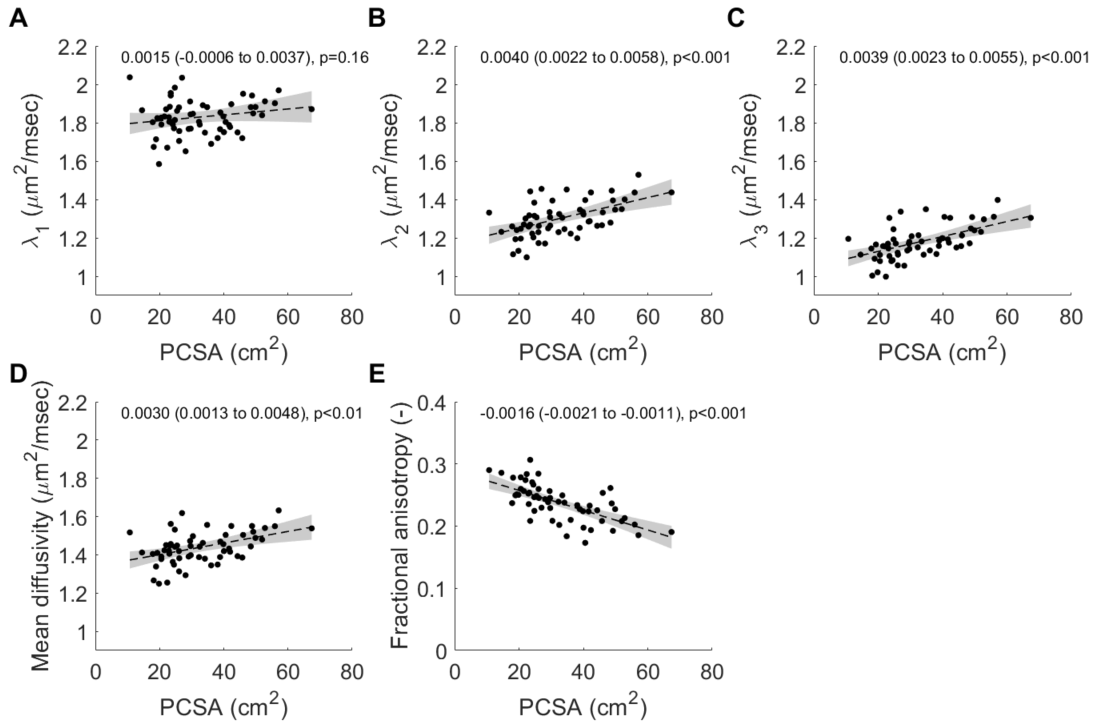
Fig. 2 Relationship between muscle physiological
cross-sectional area (PCSA) and (A) primary eigenvalue λ1, (B) secondary
eigenvalue λ2,
(C), tertiary eigenvalue λ3, (D) mean diffusivity and (E) fractional
anisotropy. The dashed line shows the regression line and grey shaded areas are
the 95% confidence intervals (values provided in insets). Muscles with larger
PCSAs have higher diffusion rates transverse to muscle fibres (increased λ2
and λ3)
suggestive of increased fibre areas.
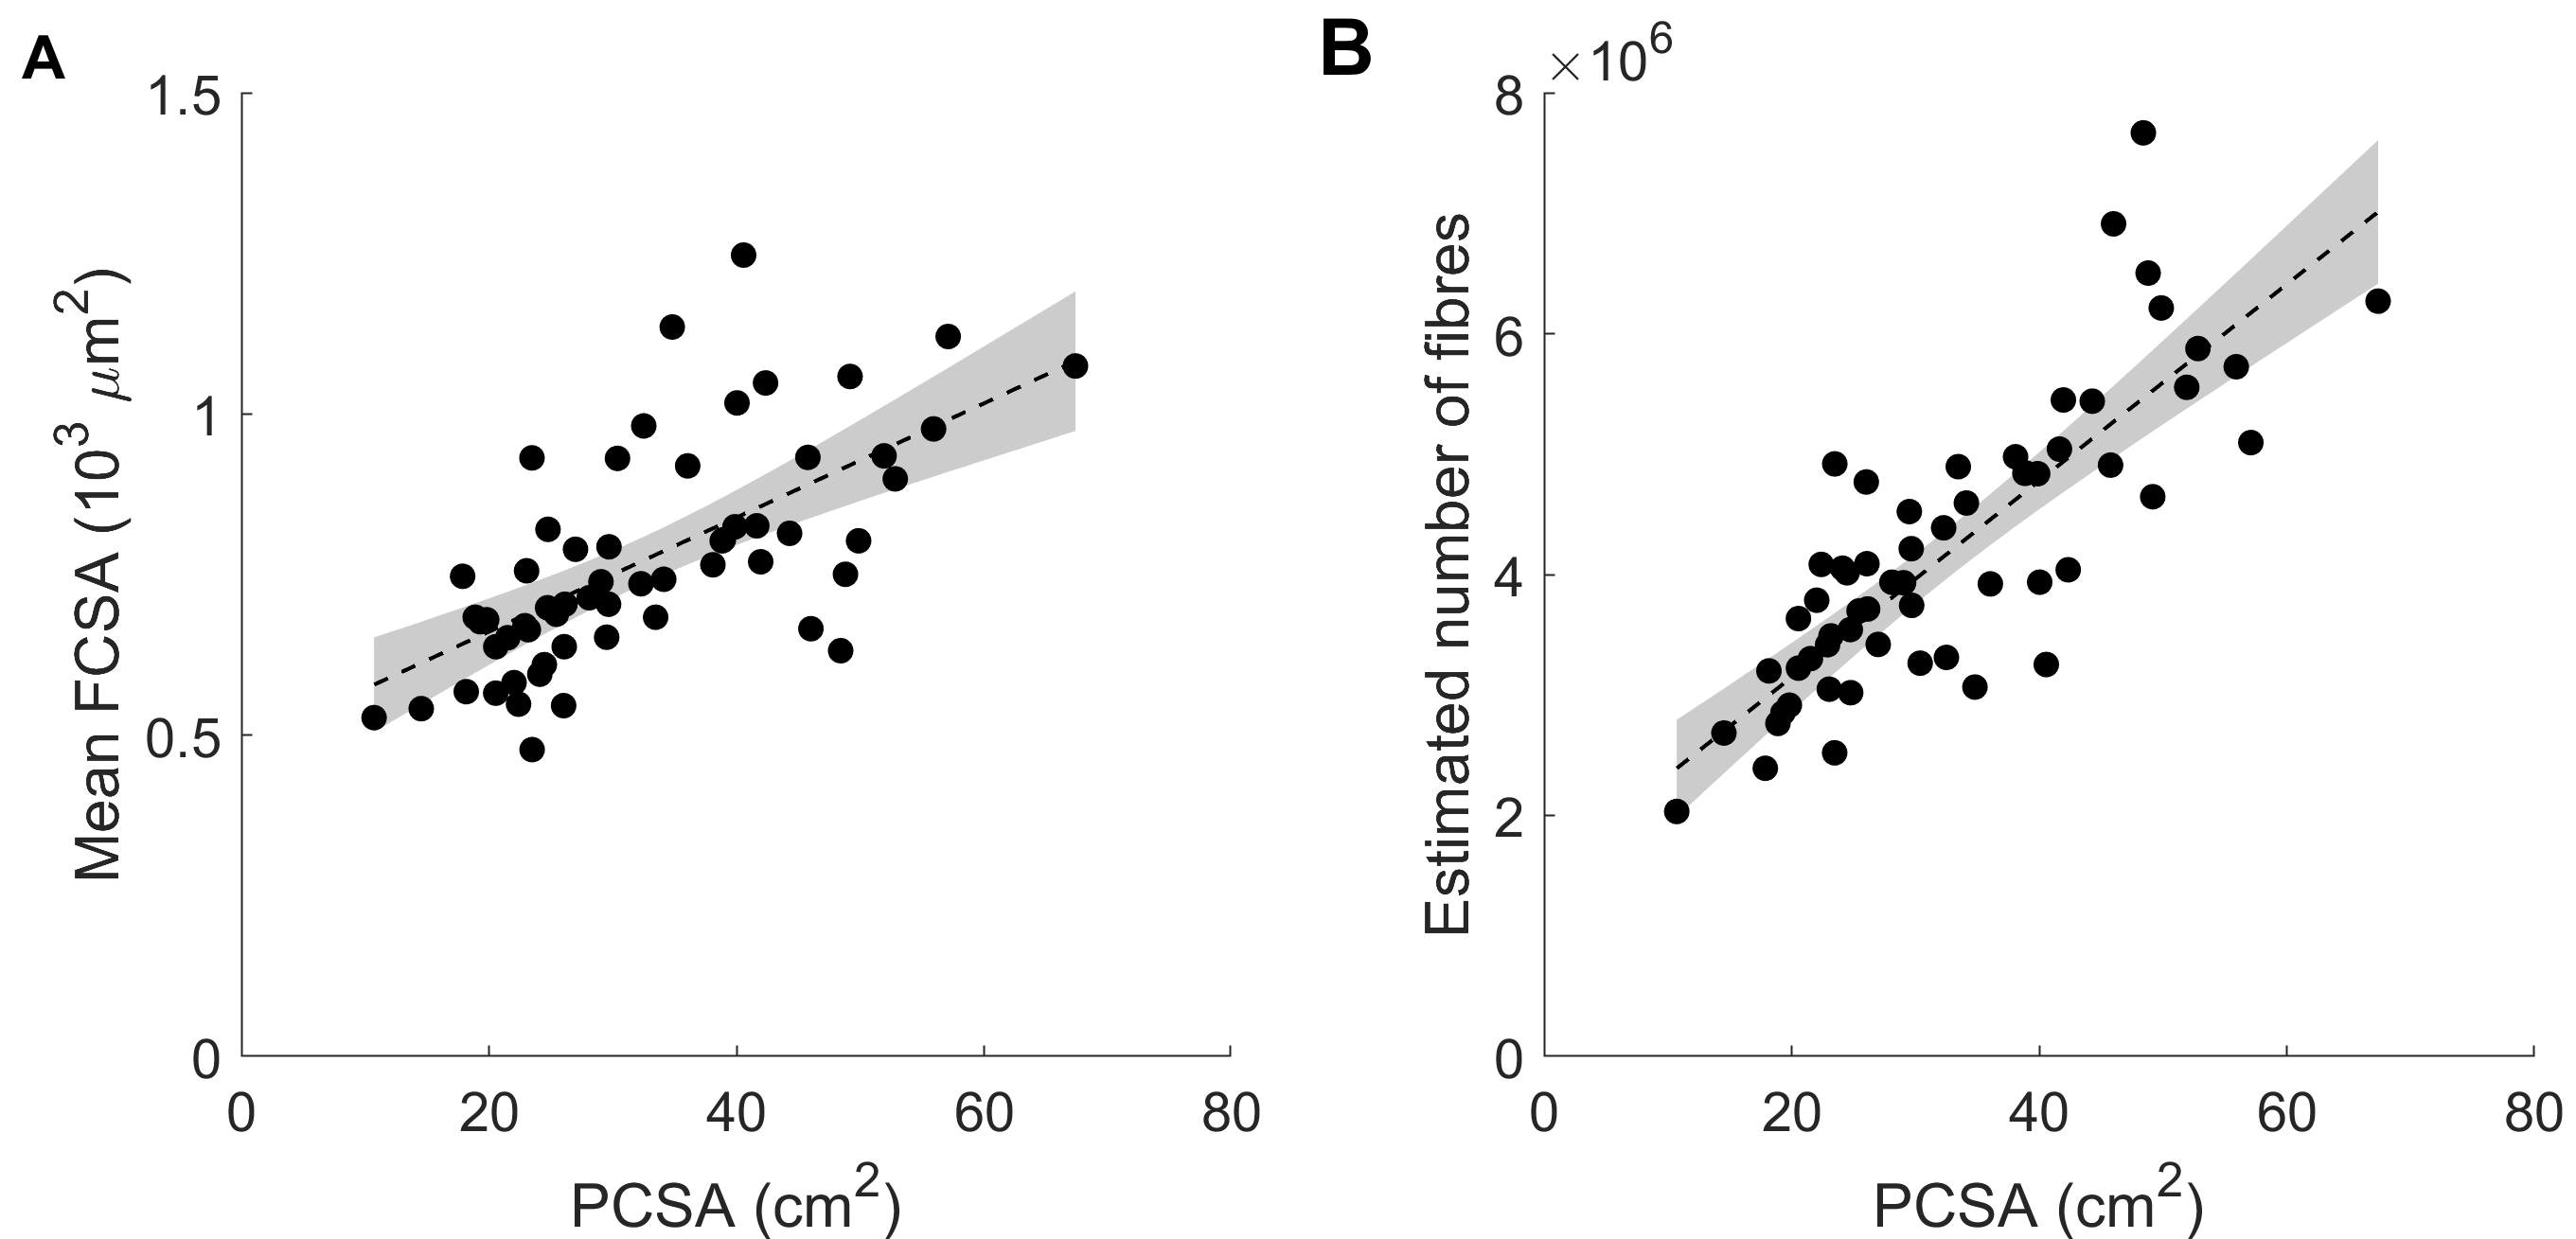
Fig. 3 Relationship between muscle physiological
cross-sectional area (PCSA) and (A) mean fibre cross-sectional area (FCSA) and (B)
estimated number of fibres (= PCSA / FCSA).
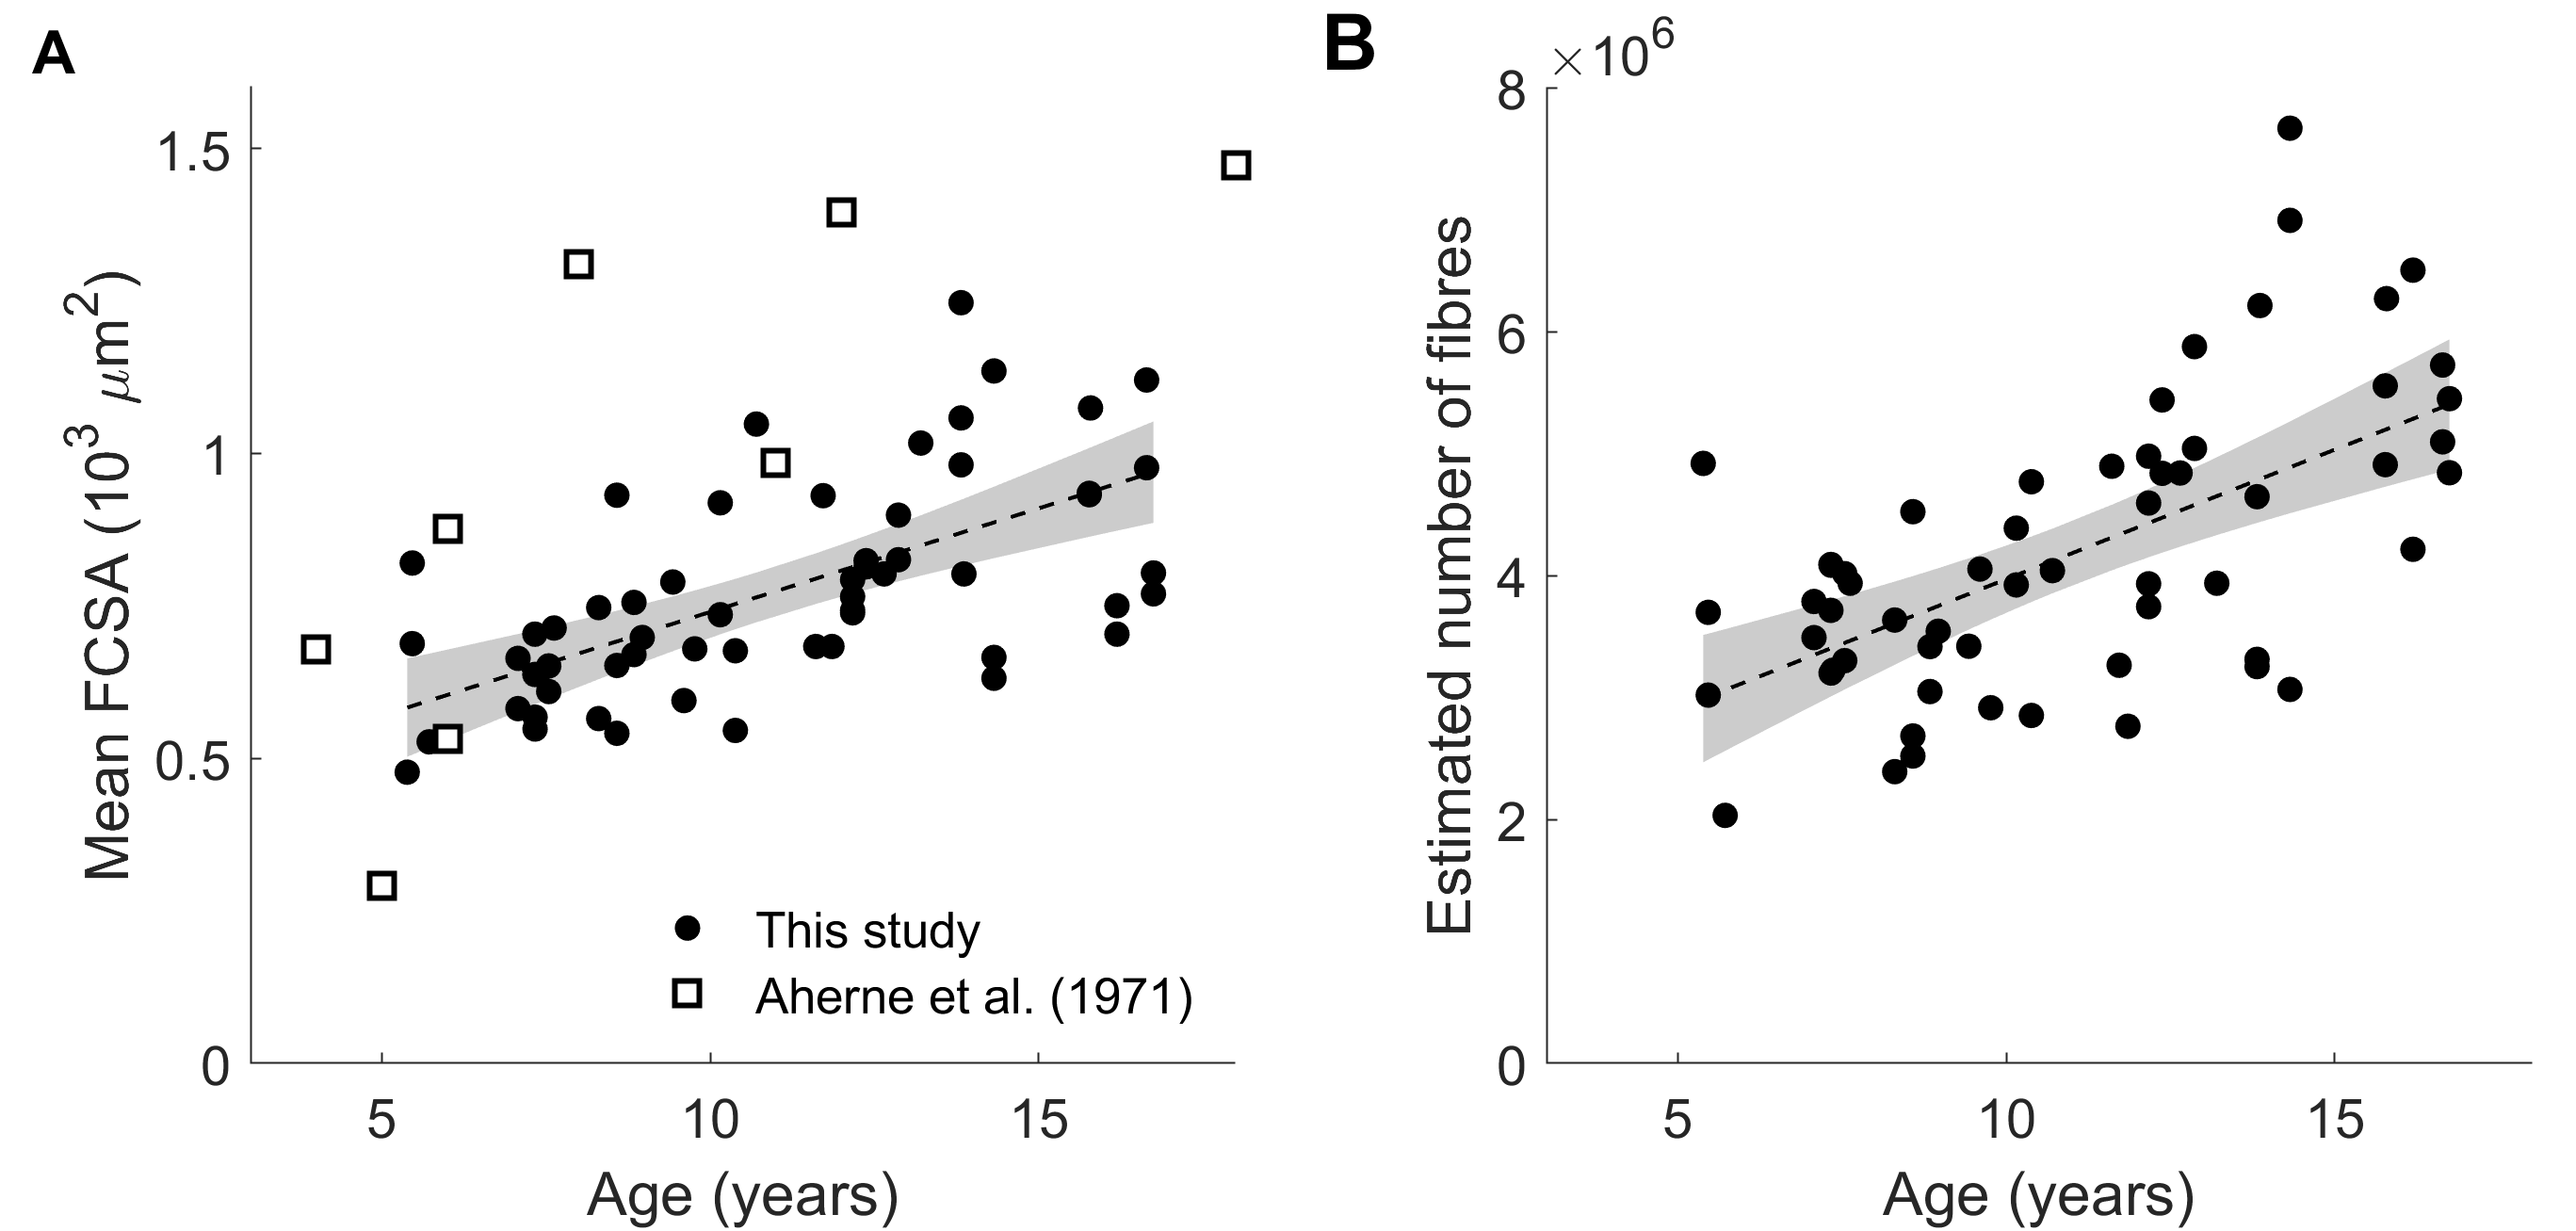
Fig.
4 Relationship between age and (A) mean fibre cross-sectional area (FCSA) and
(B) estimated number of fibres. White squares in (A) are fibre areas measured
directly in the gastrocnemius of the cadavers of seven children aged 4 to 18
years (Aherne et al. (1971), ref 8).